EURUSD - Possible ShortI shared this prediction before on Jan. 10th and so far EURUSD is showing some nice rejection to the upside but to confirm the push below we must wait for it to close below the ascending channel.
Upgrade your trading with me
For FREE SIGNALS and if you would like to see updates on this idea and many more please follow:
@wrightwayinvestments
@wrightwayinvestments
@wrightwayinvestments
✅ Hit the like button, and share for more!
Elliottwaveforecasts

NASDAQ FORMING ENDING DIAGONALNasdaq is forming Ending Diagonal (3-3-3-3-3). Invalidation level is at Wave 4's Terminal. It's possible wave 5 will overthrow. Trade safe, Guys.
This is just my perspective, if there any principle that have been broken on my idea, im open for criticism.

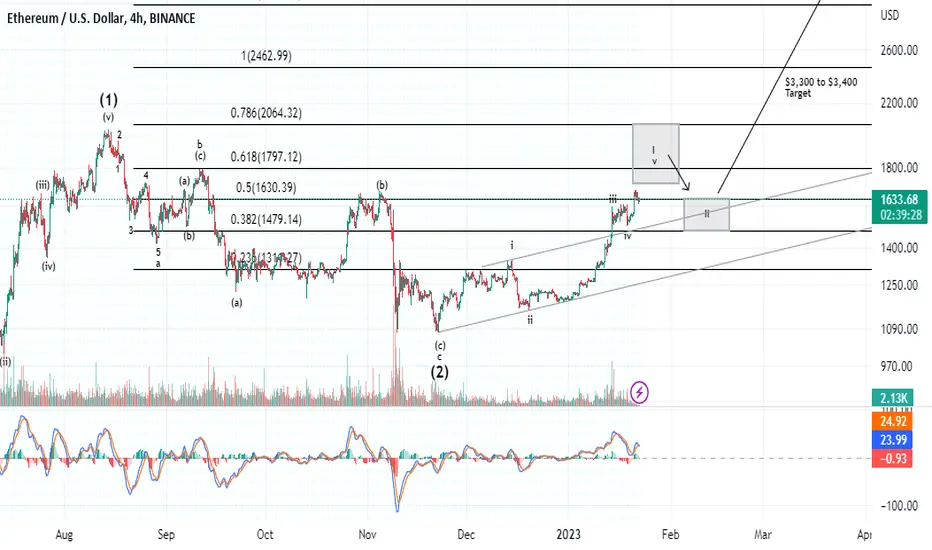
Weekend Update: Ethereum Coming into the I of (3) target boxEthereum has rallied almost 60% in the last two months...and not only is the rally not over, it appears to be in its infancy.
Given the case that ETH has already completed a (1)-(2), and now we're subdividing in our wave (3). This portion of any impulsive pattern I expect to be the strongest portion of the rally. If my count is correct, I expect price to get above 2000 as the .786 Fibonacci level is the ideal resistance are for price to complete wave i of 3. However, with OMH, price could complete below the .786 as we should have a full micro pattern.
What is important is that once wave I and II of (3) completes (black arrows) once price then breaches the wave I high... price should head fairly expeditiously to the $3,300 to $3,400 for just the wave (3) of what I'm forecasting as an impulsive 5-wave pattern.
So, we continue to progress as forecasted. Although I cannot time this move , it would not shock me if by summer time Ethereum could be in the mid $3,000 level.
So far I have no reason to think Ethereum intends to go another route other than the above outlined pathway.
Best to all,
Chris
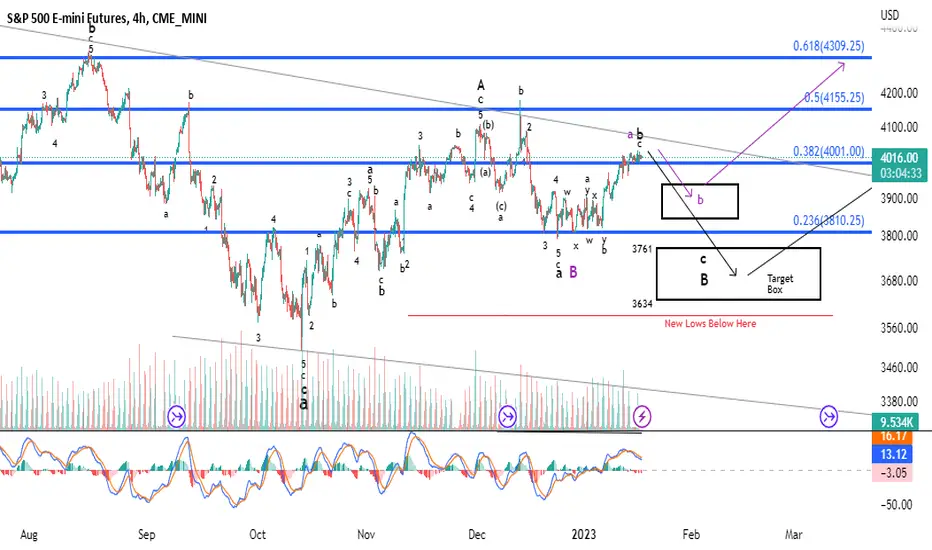
Weekend Update: Slightly Higher Early Next Week, then Down?With price on Friday breaching 3969 which was the point where the purple count would become my primary over the Black count. The above chart features the old purple count as primary now. As you may remember under the purple count chances are much lower that price will make it down to the sub 3788 level. We needed to see an impulsive 5-wave pattern that could reach those levels given how we started and this doesn't appear to be the case. There's a purple "b" on the above chart. Although an alternative, our b could have bottomed. We have a 3-wave move down but only above 4035 does this become reasonable.
I believe we will edge up early next week towards 3992 to as high as 4018 and start lower. This move lower should take us to the mid 3800 area. If price follows that path this is an area I hope to go long in size.
Best to all,
Chris

BTCUSDT 3 Potential Wave CountsBTCUSDT 3 Potential Wave Counts. In all of the 3 cases there's more potential to the upside based on 12h wave analysis.

BTC ZigZag Confirmation pendingLong term zigzag is about to be confirmed within the next month. We need a higher low, followed by a break of the local high to confirm this thesis.

XAUUSD FORECASTMy previous forecast on XAUUSD was bearish continuation and looking for Lower Low, this is an alternative for Bull Run, key level on lower timeframe by using Andrew's Pitchfork was 1914 then 1860.
Trade safe, Everyone!

Evening Update (Early): To "b" or not to "B" I'll make this clear, concise and quick.
PURPLE
If we retrace to at or above 3969....Purple is confirmed. 3969 would be the 50% retracement of wave 3. Now the impulsive count would not be invalidated but probability wise this is not a wave 4. This would be an ABC. The Purple count will not get to and below 3788.
BLACK
If price gets to approximately 3930-3945 and then retreats again to take out 3901.75 and goes to the area of 3880-3885 and begins to retrace higher over the course of the next day or so...this would be a clean 5-down and 3 up for a 1-2 down. This would point us to the mid to low 3700 minimum.
In an abundance of caution I closed my short put position for about 80% of the premium. For accountability purposes, I posted that in the comments section of my morning update.
I will be off the desk tomorrow unless the "DoDo hits the fan" (which I do not anticipate)....I'll post again in my weekend update. I'll still answer DM's and Comments.
Best to all,
Chris

Morning Update: What's Next?I would anticipate our retrace up start today. This retrace will either be a minor wave 4 or a b-wave. If we get above 3972 then it's likely this is a b wave retracement and not a 4th wave in an impulsive wave 1 of c. Incidentally we're now in the target box for purple b.
Micro chart below:
I think we're extending in wave 3 still. So I anticipate a wave 4 retrace and OML if we are to remain impulsive....or we retrace in a b wave higher without a wave 4 consolidation as per the micro chart above. We have the .50% Fib Retracement Support at 3912...as well as the .618% at 3882.75. I expect a reaction off of one those if we get down that far today.
Nonetheless, the most important thing I am watching today is the structure of this wave down, and the anticipated retrace. This will tell me if we're eventually going to sub 3788 or not.
Best to all,
Chris
For those who are interested:
I want to take a brief moment to explain the trade I did last night as I have gotten many DM's inquiring about it. This post is not the place to give a lesson in futures options. I hope to do that in the future as futures options are my main source of profit. When you trade an option, a contract between the buyer and seller is already organized within the option. I NEVER BUY OPTIONS...NEVER-EVER. I only sell. I do so, because I believe sellers have the statistical edge over buyers by an insurmountable percentage. Last night I sold 25 put contracts at the 3880 strike for $4.35 each. In doing do so, the buyer deposited in my account $5367. The trader who bought those options from me obviously thinks the ES will be below 3880 before those contracts expire which is tomorrow at 5pm EST. SO I'm selling a specific price, and at a specific time. Hypothetically, the ES could go to 3879 today but if it's above 3880 at precisely 5pm EST the buyer loses his entire investment to me. I sold those options last night when the ES was at 3939. Since last night the ES has gone against me by 20 points. But because time is ticking those options are only worth $3.50. So if I bought them back from him now I would pay $4,445.50. I would keep $921.50. Those options above 3880 have NO INSTRINSC VALUE. The buyer is gambling in my casino, and I am the house. Now, if the ES goes below 3880 between now and Friday at 5pm EST, these could become very expensive for me to buy back and therefore could lose a lot of money very quickly.

Trade Alert: Sold -25 Jan 23 WK3 3880 PutsJust sold a full tranche of 25 puts that expire in 2 days. Strike of 3880 at $4.35 for a total of $5367 in premium. That's almost $16k for January in Premium.
#FreeMoneyThankYouSPX
Best to all,
Chris

Evening Update: Today was a Good StartWe're now getting into the target box for purple b. To me this move down reeks of a c wave. If this is a c wave...we may not get down to my primary target of sub 3788. To get down to sub 3788 we need a 5 wave move. Here's the micro of what I'm referring to.
As of right this minute, I have to classify this as a C wave down. However, if tonight or into tomorrow, we get a shallow retrace higher and OML ...I'll have 5 clean waves down. Then that's a pattern that could reconcile in the sub 3788 area. If we trade above 3997 for any reason then that target will not happen. That's overlap.
So the retrace is of vital important to my trading strategy.
My shorts are up 90% in less than a week. Unfortunately I was only comfortable with getting off 10 contracts. If you did well today based on my updates, post in the comments...let me hear from you. I always enjoy reading the feedback (Good, Bad or Indifferent).
Best to all,
Chris

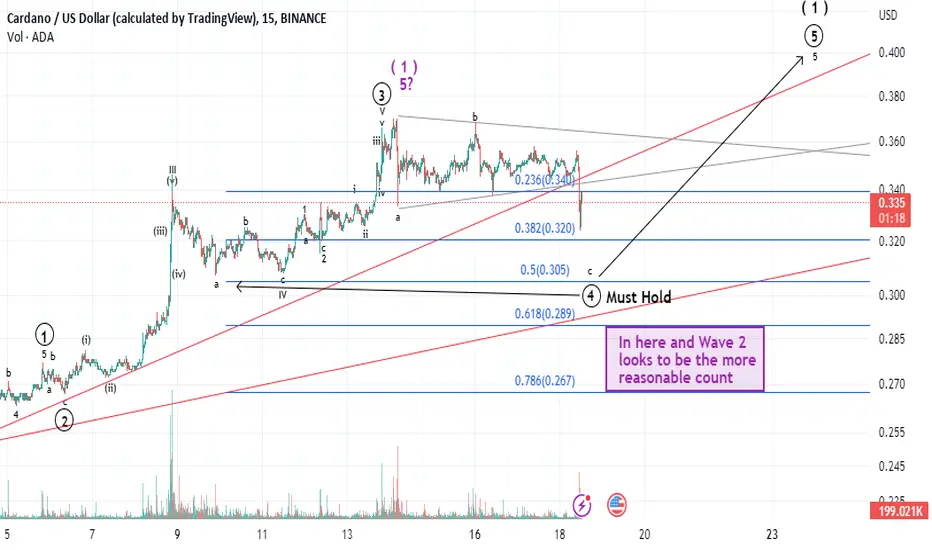
ADA Update: Triangle InvalidatedEarlier today I posted ADA looks ready to complete wave 1 up at $.39 level. In what looked like a clear triangle for wave iv of 5 has been invalidated with this move down. Therefore we have several ways to interpret this pattern.
First this is still wave 4 and nothing there is invalidated and the $.39 target area for wave 1 is still in play. Second, wave 1 is complete.
If my primary black count is playing out, we must hold the wave 4 of one lesser degree (indicated on the chart). If we get below that and then subsequently into the purple target box, then this is a larger wave 2 retrace.
Having just updated on ADA and identified in what looked like a triangle...I wanted to inform my followers due to recent price action, where we are.
Best to all,
Chris
Morning Update: I'm not going to rule out OMHThe failure to break out or down has me thinking price may try to push up and make one more high before rolling over. Additionally, the technicals are not registering any major room for price to decline in a big way. This has prompted me to include an alternative purple count on the above chart. This means B already completed and we're now completing only our a of C of larger b higher towards 4300. I want to be clear this is an alternative viewpoint as of the time of my morning update.
So whether we're topping in purple a, or topping in our black b, but we're topping nonetheless. The negative divergences now on the ES micro below...
...and the SPX cash index are stark.
What will determine if purple or black prevails is ultimately the wave structure once moving to the downside. The black count requires a C wave down. That should be a 5-wave structure. Whereas purple only needs a 3 wave structure to fulfill a minor b. So we wait for price to first break 3950 to tell us we have topped and to start tracking our decline. In either scenario, I do not think we're headed to new lows. This decline should be considered a reset to push to our larger b-wave target of 4300 or 4500.
Best to all,
Chris
Morning Update: ADA poised to complete wave 1 at $0.39In what appears to be a clear wave 4 triangle, ADA appears ready to launch 10%-15% higher to complete this initial pattern off the bottom. From there we would expect a wave 2 retracement. I'll say this in advance as to not give any of my followers the improper expectations.
Wave 2's are far more unpredictable than any other corrective patterns. That is because of alternation with wave 4's. This means wave 4's take cues from wave 2's. A wave 2 can be deep....or shallow. Whereas you do not get the complex patterns associated with wave 4's, you do get the deep-shallow uncertainty. Lastly, there are many posts on trading view about crypto having not bottomed.
That is not my viewpoint as it pertains to Cardano. I believe ADA had bottomed.
If you choose to trade out of ADA you do so with the risk of a wave 2 being shallow and being left behind. However, with all things regarding your trading...these are your decisions.
Best to all,
Chris

Evening Update: Did we top today?As an observer I would use word to describe the market over the last 2 weeks...Undecided. Much of what I track is coming into topping regions. It only stands to reason that the market will let loose soon and confirm my suspicions of lower before higher.
From an Elliott Wave perspective I want to point out 2 patterns that should give those in the immediate bullish camp pause. These overlapping patterns (highlighted in green) can explained in traditional terms as sector rotation, but to an Elliotition, nothing is going to launch off of a pattern that looks like that.
I would say today was boring...but when you're a seller of premium (like me)...today was somewhat of a payday. Let me explain briefly:
I first opened a tranche of short 4100 Jan EOM calls when the ES was 3970. This was the area of the .618 retracement level of the most recent decline from 4180 to 3788. The market has moved against me since selling my first tranche. I sold a second tranche today at 4035 and received less premium.
#BORINGEQUALSMONEY!!!!
#LOWSTRESSTRADING
I sure love selling something that I never owned, that even when I'm wrong, I still win.
Best to all,
Chris

ETHUSD analsis ( Traditional Elliotte Wave ) This is my personal view using the traditional Elliotwave (TEW) for ETHUSD #TEWave
\\
If you agree or disagree with me
Leave a comment and tell me your opinion
\\
if it work boost it make others know
(attention)
This is not a trading recommendation
I just do my hobby..
If you buy or sell based on what is posted here
That's your responsibility .

AUDJPY SELLAudjpy in the 4 th wave structure , abc correction , a cute impluse ride is going to begin towards the downside :) let's see how it plays out

BPT Regular Flat in (B) Simple Zig Zag in ((2))Expecting price to correct upwards between $13.73 and $16.49 in minor C followed by intermediate (C) in ((2)) to between the 61.8% or the 85.4% trend based fib extension. Invalid below 0.5525 cents.

XMR Missing Corrective waveWe still lack one more leg down before fufilling larger scale wxy on Elliott wave. Good entry for short here. On the smaller fractal of WXY we're just missing that X leg.

TQQQ bullish scenario This is the bullish scenario for TQQQ i think we will hit the support at A but a reversal www.tradingview.com could take place at that point

XAUUSD GOLD Don't miss the next wave , it will be more effective i am expecting gold towards 1700 in upcoming days/ weeks , the ride of c wave :)


XAUUSDSomething like this loading in my mind on gold ! dump is incoming , ! let's see how it plays out !!
