Can NASDAQ Hold 24,600 and Push to New Highs?Hey Traders, in tomorrow’s trading session we are monitoring NAS100 for a potential buying opportunity around the 24,600 zone. NASDAQ remains in an uptrend and is currently in a correction phase, with price approaching a key support/resistance level at 24,600.
Structure: The broader trend is bullish, with price moving within an ascending channel.
Key level in focus: 24,600 — a critical support area aligning with the lower boundary of the channel.
Next move: Holding above this level could set the stage for a rebound toward 25,100, which represents the channel’s upper resistance and potential higher high formation.
Trade safe,
Joe.
Elliott Wave

Going Long on the Euro-USDFX:EURUSD
Nice hammer candle today. The trend is up; the trend is your friend. And it seems like it can continue climbing all year to finish its 5th wave impulse, which looks like it is going to be an ending diagonal triangle.
Fed will continue to lower interest rates, which would support the rise of the Euro against the US Dollar.
Going long here with target at $1.22 USD. Stop $1.16 USD. It may take several weeks to reach the target.
Good luck to you.

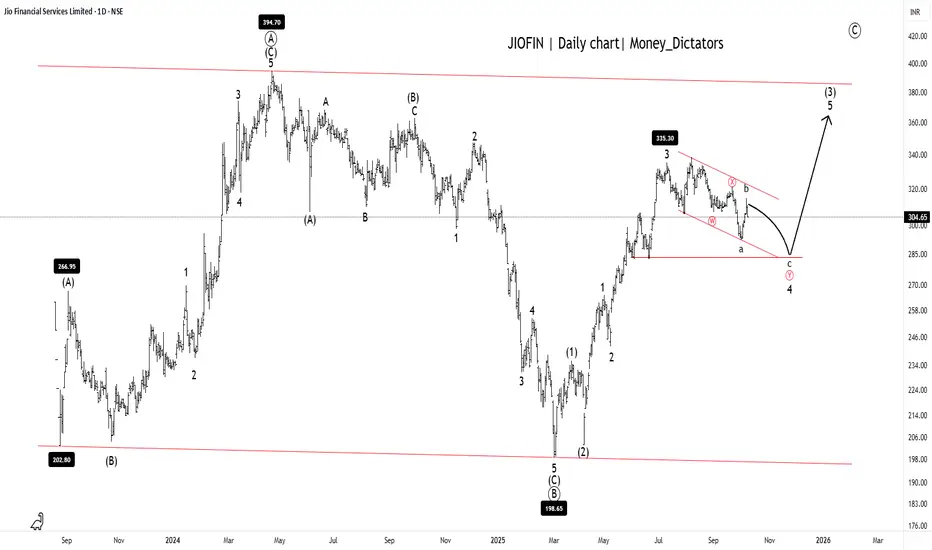
JIOFIN Setting Up for the Next Big Breakout!JIOFIN Daily chart
Possible short-term dip toward 285 - 290.
Long-term Levels: 335, 368, and 342.
Overall Trend: Bullish
Short-term trend: Bearish
JIOFIN is ready for the final upsurge as the correction ends at wave (C). A major A-B-C correction of the primary degree is clearly visible on the daily timeframe chart. Upon closer examination, it appears that the JIOFIN is currently in wave (Y) of wave 4. After completion of the wave 4 structure, Stock will set for the wave 4 for the given long-term levels.
Stay tuned!
@Money_Dictators
Thanks :)
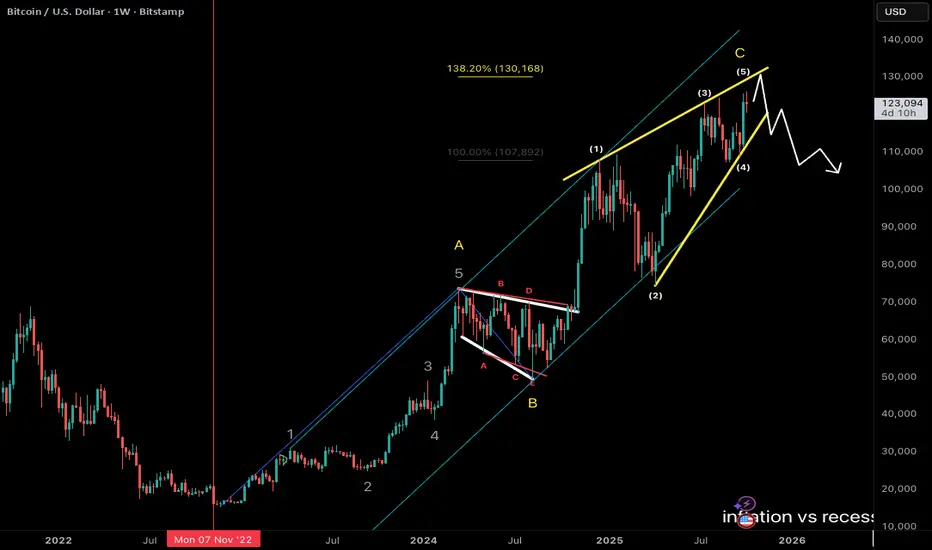
bitcoin ending diagonalbitcoin price going up in a parallel channel
wave A = 12345 and wave C making ending diagonal pattern
C = 138% of A
wave C projection, yellow ending diagonal upper line near 130k
so 130k area is big resistance zone
it has been three years for debasement trade gold and bitcoin are going up
feels like crowd panic on debt
XAUUSD NEXT POSSIBLE MOVE Gold is currently testing a strong support zone where buyers have previously shown strong reactions. If the price continues to respect this level, a bullish push can be expected.
Market sentiment remains positive above support, indicating potential upside if buyers hold their ground.

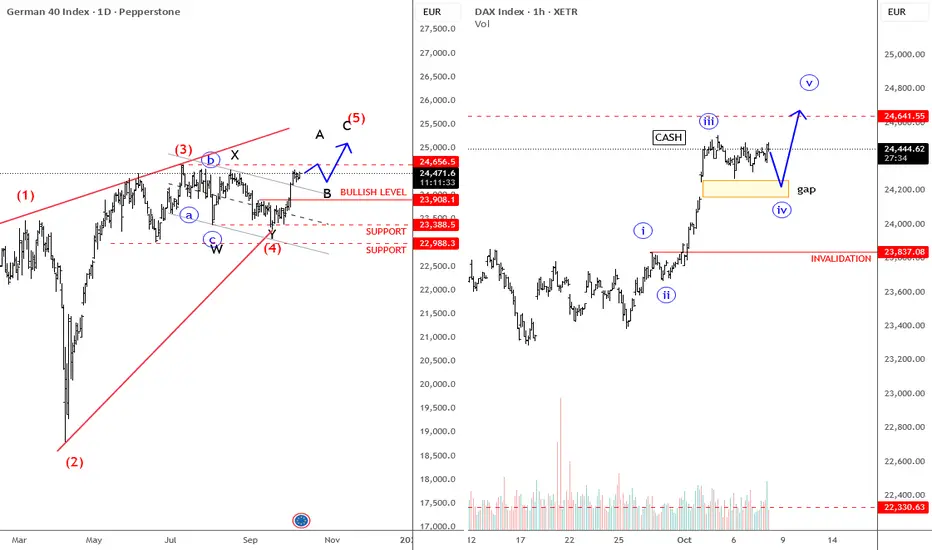
DAX Attacking New ATH German DAX is in a very nice recovery, breaking above the corrective channel resistance line, so apparently we are in risk-on mode on this index, which sooner or later could revisit all-time highs. Keep in mind this could already be a fifth wave, but there’s still room for 25,000 or even 25,500. What I really like on the smaller intraday time frame is the strong recovery since October 1st, and notice there’s a gap from October 2nd — these gaps can often act as reversal points, especially once they get filled on the cash market. L
ooking at the cash chart, it seems that gap could still get filled during the current fourth-wave correction, which could be a very nice spot for the market to resume higher toward the previous July 2025 highs. The gap fill could be an important support, while the short-term invalidation level is at 23,834 — as long as this one holds, the intraday trend remains up.
ETHFIUSDT → Correction to support consolidation. Rally?BINANCE:ETHFIUSDT is correcting after updating its local maximum to 1.9382. The breakout of the 1.6775 zone is an attempt to start distribution after a long consolidation. Will the bulls hold this zone?
Bitcoin is correcting after a false breakout of resistance. Against this backdrop, the entire cryptocurrency market is declining. However, the trend is bullish and the fundamental background is positive. The end of the correction may resume growth in the market.
ETHFI on the daily timeframe is trying to move into a distribution phase after 5-6 months of consolidation. The trend is upward, and after breaking through resistance, a correction to the liquidity zone of 1.6775 is forming. A false breakdown, a change in market imbalance, and consolidation above 1.6780 could increase buyer interest, which in turn could lead to growth.
Resistance levels: 1.8980, 1.9382
Support levels: 1.6775, 1.5343
The chart shows two key levels - 1.6775 and 1.5343. If the bulls hold their ground above the nearest level of 1.6775, this could lead to a rebound and growth, which in turn would confirm the continuation of the distribution phase. Otherwise, the market may test the POC zone at 1.5343, and liquidity capture may in turn trigger growth.
Best regards, R. Linda!

The rise in gold is still continuing.Wave -(i) of (E) is forming, and the target of 3900-4050 remains valid, and it could even go higher than this price. After the completion of wave -(i) of (E), there is a possibility of a corrective period in both time and price. A time-based corrective period is more likely.
Good luck
NEoWave Chart

EURUSD changing directioEUR/USD Finally Breaks Below Key Moving Averages | Technical Analysis Update
In this video, I share my latest EUR/USD analysis — the pair has finally broken below both the exponential (blue) and simple (red) moving averages, marking a potential shift in market structure after months of consolidation since February.
We go step by step through:
🔹Breaking under the EMA + SMA
Elliott Wave count & correction phase
🔹 Confirmation from the stochastic oscillator
🔹 Key trendline break setup
🔹 Fibonacci retracement (61.8%) and projection confluence
🔹 Short entry zones and target levels between 1.08 – 1.09
💡 Important: This is not financial advice — I’m just sharing my personal market analysis and thoughts. Always manage your risk and use proper stop-loss techniques.
If you enjoy detailed, no-nonsense technical breakdowns of the forex market, make sure to:
👍 Like the video
🔔 Subscribe to the channel for more EUR/USD, GBP/USD, and market updates

ETHUSD: Where Price Could Go?4h tf
ETHUSD has bounced back strongly from around $3,826 after completing an A-B-C wave pattern. Right now, the price is testing resistance near $4,756. It could drop a little to around $4,440 before moving higher again. If the uptrend continues, the next target levels are $4,955, $5,300, and $5,500.
Stay tuned!
Thank you,
@Money_Dictators

Future of #GOLD #XAUUSDSurprises from #Gold #Levels and #Positional #Targets.
Based on Analysis from yearly chart and #Fibonocci retracement and #extension
& Based on Elliot wave theory, Gold didn't give a retracement at 1.618 levels, which means, Gold broke and holding above 2950., which means the next possible stop is at 2.618 Fib extension and #elliot wave #analysis 3rd wave. Until it reaches this levels the momentum will continue and will reach quickly !
So the ultimate possible target will be #4617.
The Intermediate monthly resistances will be 4041 / 4277 / 4617.
Riding the 3rd wave, which is an Impulse wave will give quick positional targets.
Need not believe this analysis blindly. Do your own analysis and wait and watch the wonders.
Analysis shared for Educational purpose only. Do your own analysis, to be successful on a longer run !!!
#technical #analysis #wonders. There is no holy grail.

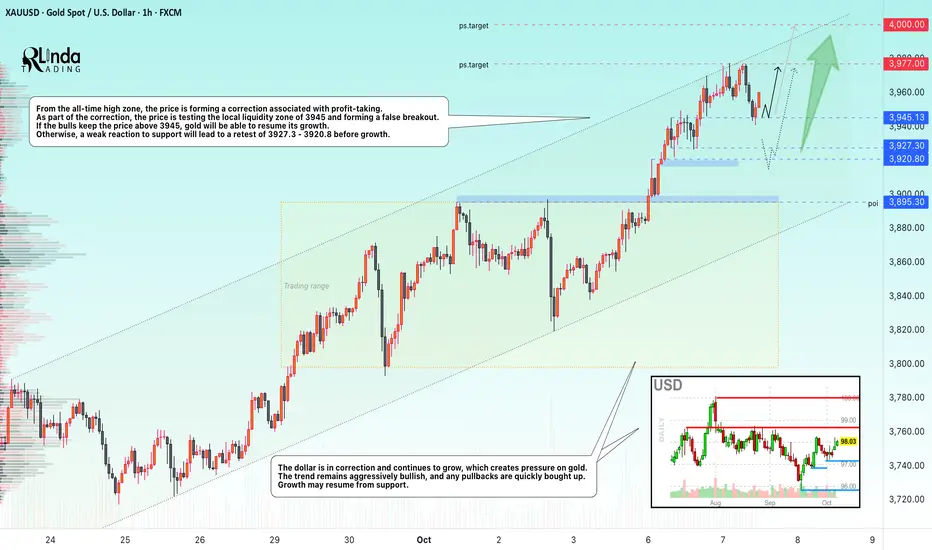
GOLD → The correction will trigger growth to $4,000.FX:XAUUSD hit a new record high of nearly $3,977 and entered a correction phase to build up potential before further growth. Despite the local strengthening of the dollar, the upward trend continues thanks to a combination of macroeconomic and geopolitical factors.
Key supporting factors: Ongoing US government shutdown: The Democrats' fifth unsuccessful attempt to resolve the issue increases uncertainty. Markets expect two interest rate cuts before the end of the year.
China has been increasing its reserves for the 11th consecutive month, and global central banks bought +15 tons in August.
No bearish triggers: Any correction is seen as a buying opportunity.
Gold maintains its upward momentum. Breaking through $4,000 seems a matter of time if current drivers remain in place. Key risks are an unexpected resolution to the shutdown or hawkish signals from the Fed.
Resistance levels: 3977, 4000
Support levels: 3945, 3927, 3920
Technically, a false breakdown of support could lead to continued growth. A retest of 3945 is possible; a weak reaction could trigger a deeper correction, for example to 3927, before further growth.
Sincerely, R. Linda!
Gold Watching 3,850 Support as Dollar Weakens on UsGovt ShutdownHey Traders, in today’s trading session we are monitoring XAUUSD for a potential buying opportunity around the 3,850 zone. Gold is trading in an uptrend and currently in a correction phase, with price approaching this important support/resistance level.
Structure: Gold remains within an overall bullish structure and is also trading inside an ascending channel.
Key level in focus: 3,850 — a key support zone where buyers may look to step in.
Upside target: 3,930 — aligning with the channel resistance and potential area for bullish continuation.
Fundamentals: The ongoing US government shutdown is adding bearish pressure on the US Dollar. Given Gold’s negative correlation with DXY, this environment continues to support the bullish bias for Gold.
Trade safe,
Joe.

AUDUSD Eyes 0.65900 as Gold Nears Record HighHey Traders, in the coming week we are monitoring AUDUSD for a potential buying opportunity around the 0.65900 zone. AUDUSD remains in an uptrend and is currently in a correction phase, with price moving toward this key support/resistance level.
Structure: The broader bias is bullish, with price retracing toward trend support.
Key level in focus: 0.65900 — an important area where buyers may look to re-enter.
Fundamentals: Gold continues to rise and is nearing a fresh ATH, supported by a bearish US Dollar bias. Given the positive correlation between AUDUSD and Gold, further upside on the pair remains likely.
Next move: Monitoring price reaction at 0.65900 to assess whether the trend resumes higher.
Trade safe,
Joe.

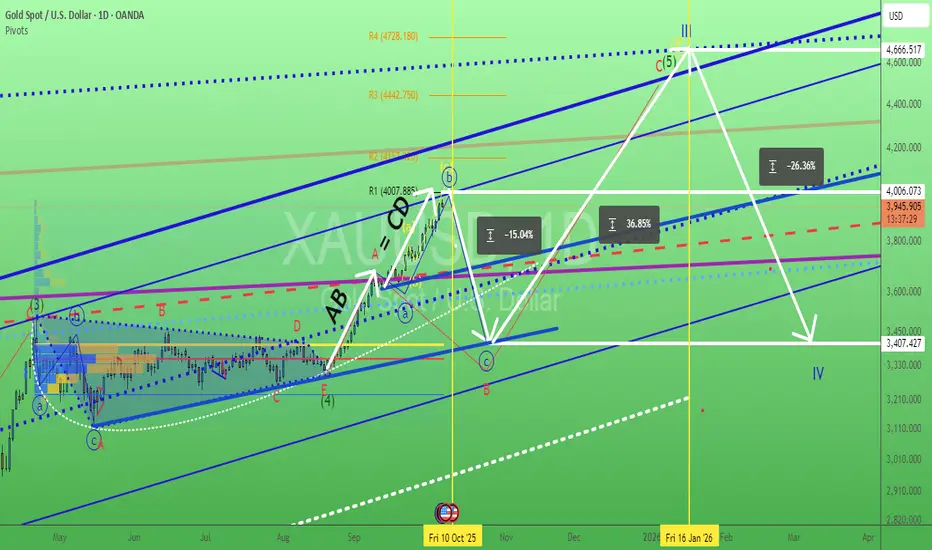
Gold. Waiting NFP trigger? 7/Oct/25XAUUSD nonstop surging need some profit taking? what event trigger the heavy sell off? Coming this Friday delayed NFP? "time / cycle - wise" Look like "some cash out" not just from Gold but also equities market?. 4007.885 are the confluence zone of 1) Monthly R1 2) Parallel Line Resistance 3) AB = CD price volume. and many...P/s all impulsive wave consist of abc subwaves not 1,2,3,4,5 waves
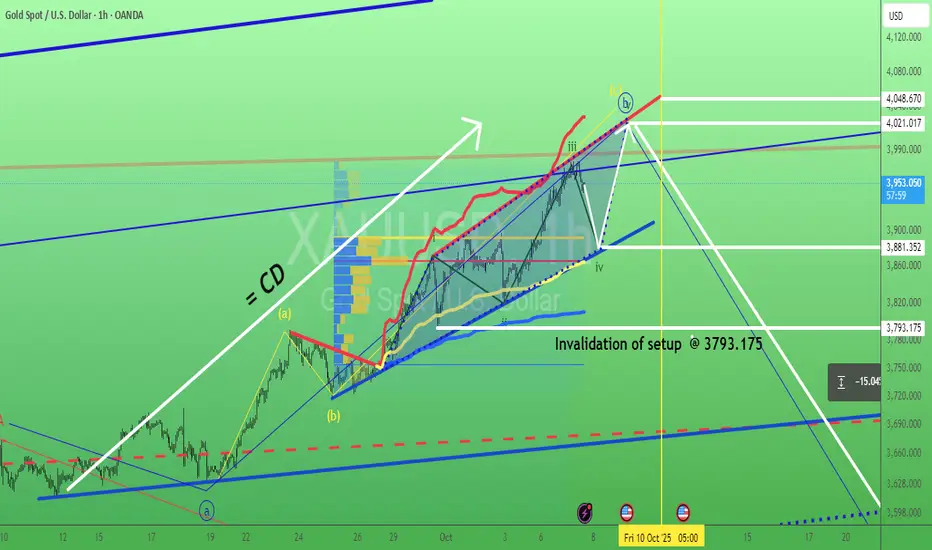
Gold intraday overview. 7/Oct/25XAUUSD short term swing setup. A rising wedge/ Expanding Ending Diagonal pattern. 3880 +/- is confluence zone of 1) VWAP (yellow MA ) support 2) Volume Profile's ( POC ) Horizontal Red Line.
Short - AMDTime period for this play : week to months
Analysis : Elliot wave 12345 ABC. Expect hitting .618 and bounce back up to go higher.
Pattern if wave B completed : Head & Shoulder
Price Target: Wave ABC
ETA Timeline for correction. Please refer to the chart.
Upcoming events:
Tariff active on 8/1/25 - Friday
Earning on 8/5/25 - Tuesday
Top is not in yet, so 2 Possible top-in levels:
Top 1 - $163.45 : Retesting to hit 163.45, rejected, and break $158
Top 2 - $173.94 : Breaking 163.45 and reject at 173.94
=> Overall, It begins trading side way and show some weakness now.
The correction may not pull back to .618, which is the best level. Other scenarios:
- 0.5 fib, where it test wave 3
- 0.328 fib, strong bullish level if it doesn't break & go to the upside faster

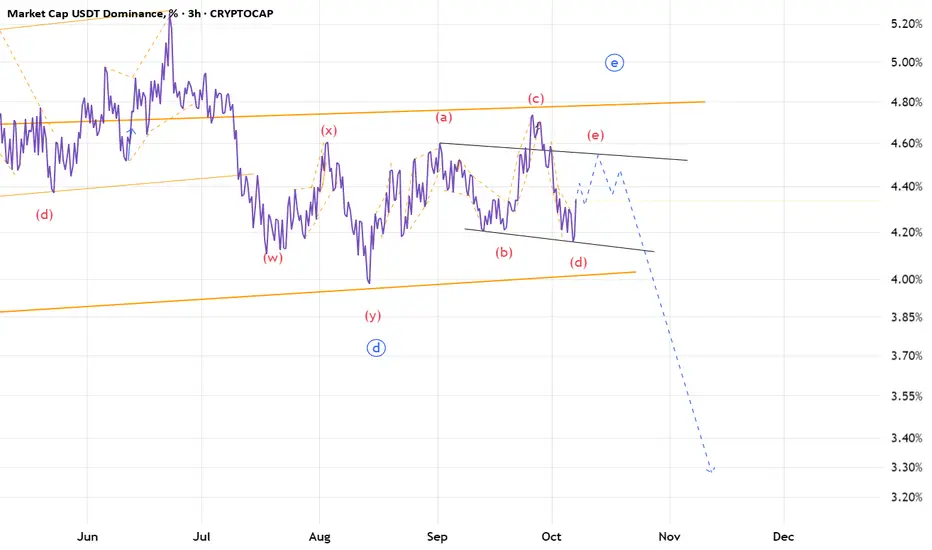
USDT.D(based on NEo wave)the bigger degree is a huge triangle and also wave E is a triangle with abcd waves which all are diametrics.
I hope wave e break the curse and change the pattern.
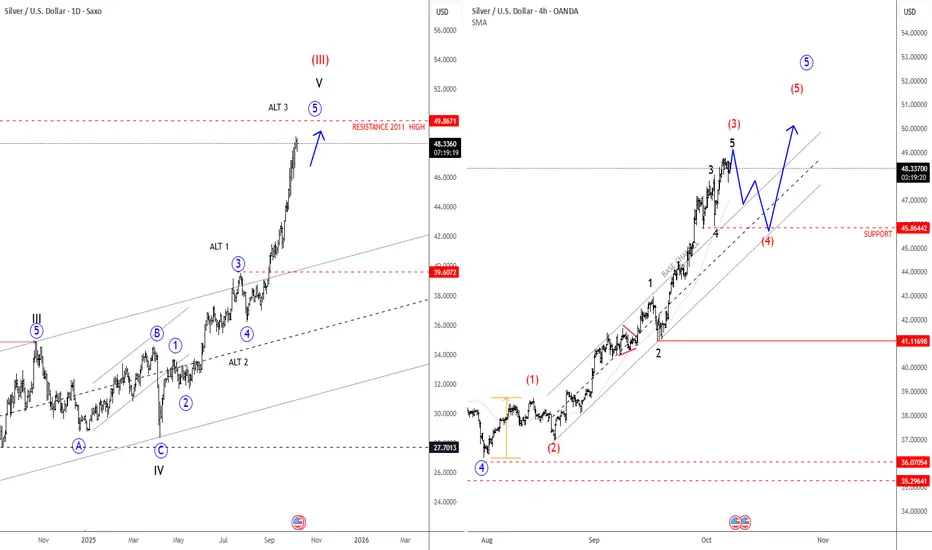
Silver Is Extending Impulsively Higher; All-Time Highs SoonSilver Is Extending Impulsively Higher, which can push the price into all-time highs from a technical point of view and by Elliott wave model.
Silver is on the rise and has been outperforming gold quite a lot over the last week, and it looks like an extended leg up is still in progress; seems like wave three of an extended impulse, therefore more gains are possible after next three-leg retracement. Based on the 4-hour chart, there is a chance that price goes towards 50usd, but there can be some new pullback first. Ideally red wave (4) could stabilize near 45.86. Only a sharp impulse down closer to 43 level will be an indication that higher degree wave four has started.
Higher Time frame charts show an ongoing bull cycle that is now targeting the high from April 2011, which could be the next major level and a potential area for a new retracement, maybe sometime in 2026.
BTQQF - Tommy Lee's Quantum NameBTQ name is lately popular after Tommy Lee mentioned it for Quantum Crypto POC blah blah..
Anyways, Technically this is in a good buy zone.
- Above 200MA
- Above big volume shelf support zone
- Finished ABC correction and Wave 2 about to begin on the primary cycle.
Low float 138M shares, Small Market cap 512M
Can do a epic run if it starts moving up.
Target 1 - 8
Target 2 - 12
Target 3 - 14ish..
Have a tight stop loss below 2.75
The path wont' be straight up but volatile.

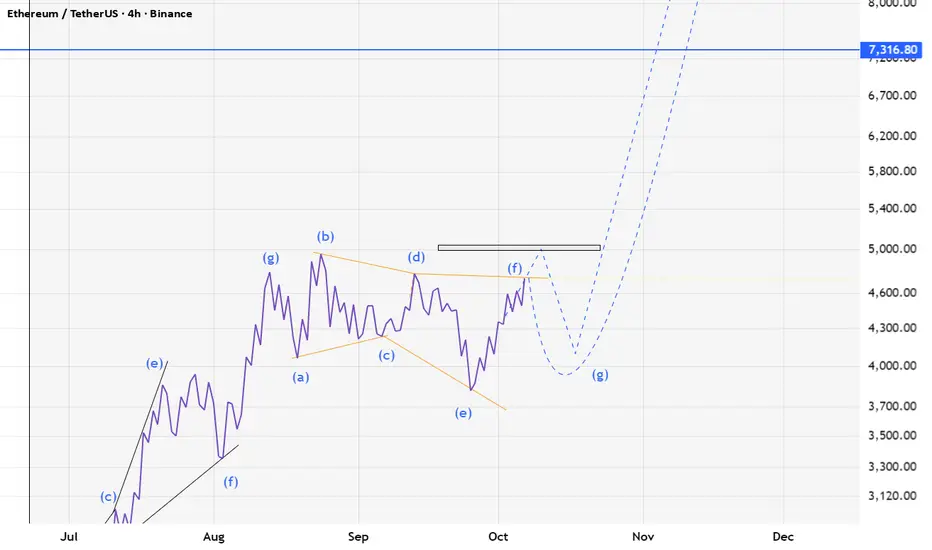
ETH(based on NEo wave)soon eth will start a temporary correction and goes for higher bullish waves.
it is the last chance to buy it.
Stop loss is 3800.
Bitcoin W1 (Wave Analysis) - W1 Scenario 3 - 7/10/2025Bitcoin W1 (Wave Analysis) - W1 Scenario 3 - 7/10/2025
See The Chart

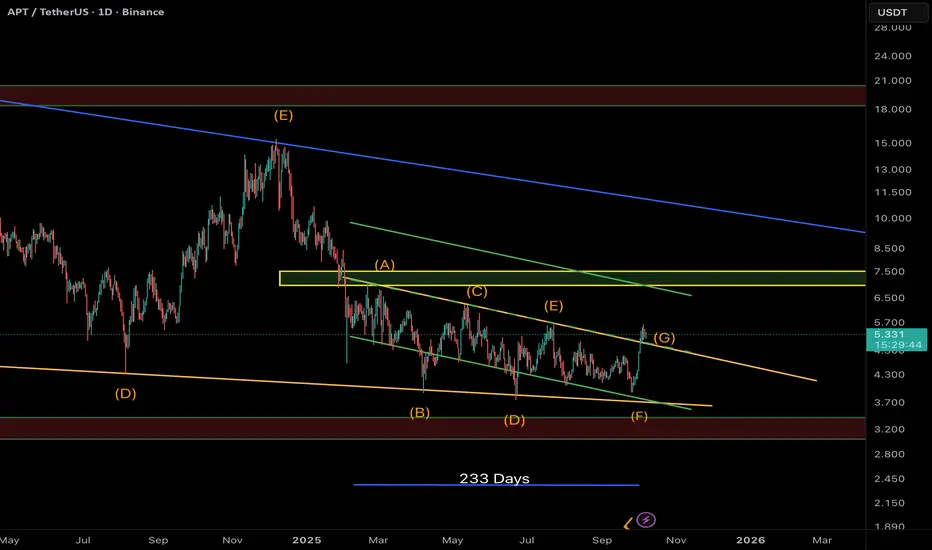
APT — Diametric Pattern Completed? Wave G in Play!APT appears to have completed a 7-leg Diametric correction (A–G) — a rare and complex Elliott structure often seen before major trend reversals.
Currently, price has broken out of the descending channel, confirming the start of Wave G, which could extend toward the $7.0 zone — aligning with the previous Wave A resistance.
Key Points:
• 🌀 Completed Diametric structure (A–G) over ~233 days
• 🟢 Breakout from the descending wedge
• 🎯 Potential target: $6.8 – $7.2
• ⚠️ Support to watch: $4.8 – $5.0 (retest area)
If momentum holds, this move could mark the first bullish leg of a larger reversal phase.