NZDUSD → The hunt for liquidity. Bearish trend...FX:NZDUSD is forming a correction towards consolidation after updating its global minimum. Bears may play aggressively against the backdrop of a strong dollar.
The dollar is quite strong after Thursday's news. After retesting resistance, the index is not falling, but is gathering strength and may continue to grow.
The global trend is downward. After a long consolidation, the currency pair is breaking support and updating its low. The market sentiment is bearish. Against this backdrop, NZDUSD may continue to decline after retesting resistance at 0.560 and a false breakout...
Resistance levels: 0.5606, 0.5635
Support levels: 0.555, 0.55
A false breakout, lack of bullish momentum, and price consolidation below 0.56 could trigger a further decline in price within the current trend.
Best regards, R. Linda!
Elliott Wave

Pgsus is about the end WXY correctionPegasus Airlines about the finish WXY correction as c of abc correction as an ending diagonal which is strict rules that wave 5 must be shorter than wave 3 so we have a clear stop loss point which is 190,5.

S&P500 crashes! Due relief rally or further pain?Nvidia delivered impressive earnings, but the stock reversed and closed nearly 3% lower, triggering heavy selling across tech and risk assets as odds for a December rate cut have collapsed to just 34%, with policy uncertainty amplified by the cancelled October NFP report. Despite a strong market and rising unemployment in September's NFP report, traders remained defensive and fuelled the declines.
Key drivers:
Nvidia beat earnings, but post-report selling intensified sector losses.
The Fed’s odds for a December rate cut have dropped to 34%, amplifying caution.
The abrupt cancellation of the October NFP means the market lacks fresh labour data, fuelling defensive positioning.
S&P 500, Nasdaq, and Bitcoin broke major supports, confirming risk-off conditions.
Right now, the S&P 500 has broken below channel support near 6,600 and failed to climb back in. If prices stay below this threshold, expect another sharp move lower targeting 6,500 and possibly 6,350. There’s potential for upside, given momentum divergence on the RSI 4-hour chart. If we see a short-term bounce and a return to the channel, a move toward 6,682 is possible, which sets up a tactical short opportunity.
Trade idea:
Entry: Midpoint of 23.6/38.2 Fibonacci (6,655–6,682 area)
Stop-loss: Above 61.8% Fib (6,775)
Take Profits: TP1 6,500 (recent low/support), TP2 6,440 (major support), TP3 trail stop to 6,170 (long-term support)
Risk-off drivers are in control. Earnings reversals, Fed uncertainty, and cancelled NFP data are fuelling this price action. Technically, it comes down to whether we see a return inside the channel for a relief bounce or a sharp continuation downward.
Watch your levels, remain nimble, and let fundamentals and technicals, not emotions, guide your trade.
Let me know your setups in the comments, and follow for more high-action technical and macro trade ideas.
This content is not directed to residents of the EU or UK. Any opinions, news, research, analyses, prices or other information contained on this website is provided as general market commentary and does not constitute investment advice. ThinkMarkets will not accept liability for any loss or damage including, without limitation, to any loss of profit which may arise directly or indirectly from use of or reliance on such information.

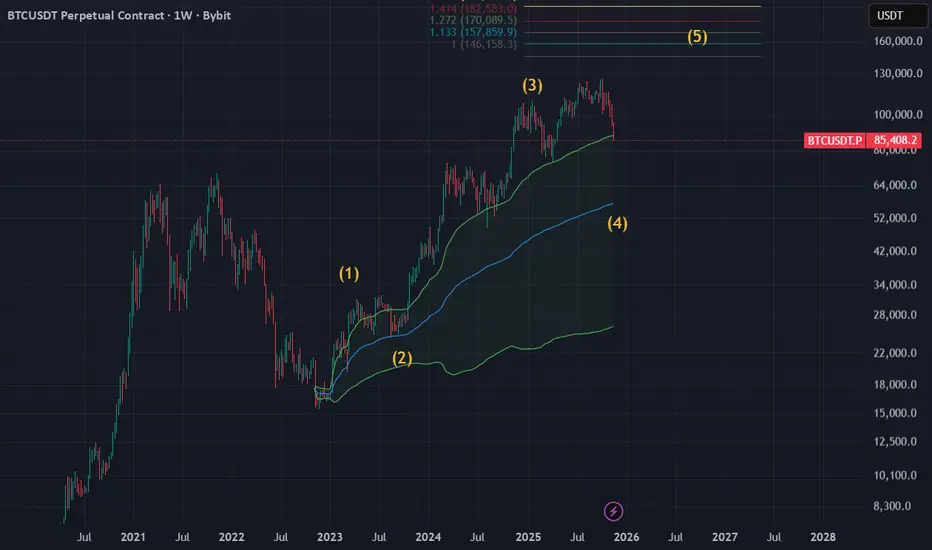
Don't be fearful.We are at Wave 3 correction.150k-200k at Wave 5As we can see on the MACRO LOG scale of this asset, subwaves for each big waves are clearly seen. We look at this dump as a blessing; not something to be feared of. We stay patient for where this dump goes and simply trade it.
Simply looking at the chart, vwap says 50k-ish is a very good zone to look into. Much much happy to come in if we visit below 50k with a failed auction to jump in.
Ofcourse, this is a very much big swing idea that does not mean too much for trading levels.
This approach is for investors who simply see bitcoin as an asset.
For a trader like us on this website, we must look on intermediate levels.
Goodluck traders!
GOLD → Waiting for NFP... High importance level!FX:XAUUSD is stagnating ahead of the news. The market is in a phase of uncertainty, with long shadows and short candlestick bodies. The key factor will be the US employment data for September.
We have not seen unemployment data for more than seven weeks, which makes this data highly significant. Complete uncertainty. Significant deviations from forecasts could significantly change expectations for Fed rates. The probability of a Fed rate cut in December fell to 33% after the publication of the minutes, in which the regulator expressed concerns about inflation.
The market expects 50K jobs to be created in September, compared to 22K in August.
The unemployment rate is forecast at 4.3%, with wage growth at 3.7% year-on-year.
The further dynamics of gold depend on the NFP data. Weaker indicators may reinforce expectations of Fed policy easing and support price growth, while strong data will put pressure on the metal
Resistance levels: 4082 - 4111
Support levels: 4040, 4006
In the current circumstances, having only one scenario means narrowing your view of the situation as much as possible. The market can be aggressive on news. Weak data could lock the price within the current range (trading between graces). However, a breakout of resistance at 4082 - 4111 and a close above this level could trigger growth. Otherwise, a breakdown and consolidation below 4040 could break the current bullish trend and trigger a sell-off to 3930 (especially against the backdrop of the Fed's weak but hawkish stance).
Best regards, R. Linda!

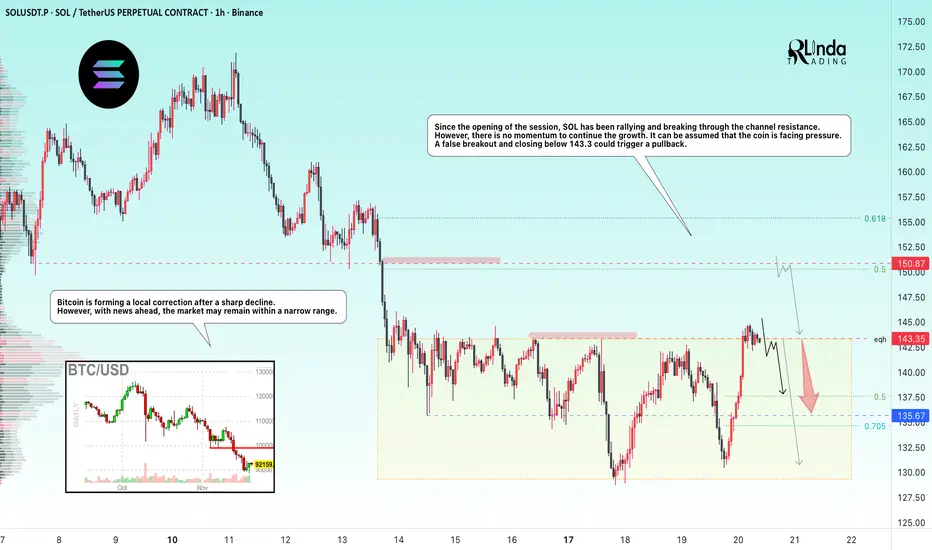
SOLANA → Manipulation - false breakout of resistance BINANCE:SOLUSDT.P flew up to resistance at 143.35 at the opening of the session and attempted to break through it, but bears may not let the price rise ahead of the news...
Bitcoin is forming a local correction after a sharp decline. However, news is ahead and the market may remain within a narrow range.
From the opening of the session, SOL rallies and breaks through the channel resistance, wasting 75% of its intraday growth potential. However, there is no momentum to continue the growth. It can be assumed that the coin is facing pressure. A false breakout and closing below 143.3 could trigger a pullback.
Resistance levels: 143.35, 150.87
Support levels: 135.67, 130.0
Two key levels for countertrend movement: 143.35 - 150.87. If the liquidity pool does not stop the price at the nearest level, then 150.87 can be considered as an additional level for trading a false breakout.
However, news on unemployment is coming soon, and the market may react quite aggressively. Therefore, if there are no trading opportunities before the news, I recommend refraining from action for an hour and waiting out the storm...
Best regards, R. Linda!
BTC Perfect Elliott Wave Zigzag With Terminal Wave-CBTC has formed into a near-perfect zigzag with a near-perfect terminal wave-C.
Highest Degree (Zigzag pattern):
Wave-C = A+B in time
Wave-C is the most complex and time consuming part of the pattern (common for terminal impulses)
There's clear alternation in time/price for all waves
Wave-B retraced <0.618% of wave-A (required for zigzags)
Channeling confirms end of all waves clearly
Wave-C (Terminal pattern):
Wave-3 = 1.382 * Wave-1 in price (common in 5th wave extensions)
Wave-3 = (Wave-1+Wave-2)0.5 in time
Wave-4 = ~1.618 * Wave-2
Wave-4 = ~(Wave-2+Wave-3) in time,
Wave-4 alternates with wave-2 in price/time
Wave-5 = 1.618(Wave-3) in price
Wave-5 = (Wave-3+Wave-4) in time
Channels as an expanding wedge, expected for 5th-wave extensions
Sentiment indicators are also reading near all time lows, as low as it was during the covid lows and FTX lows.
Given this setup as an isolated pattern, and with the high probability Bitcoin is towards the middle of a long-term pattern, this is a strong setup for a move towards ATH.
To confirm it, we should see wave-C being full retraced in less than half the time it took to form.

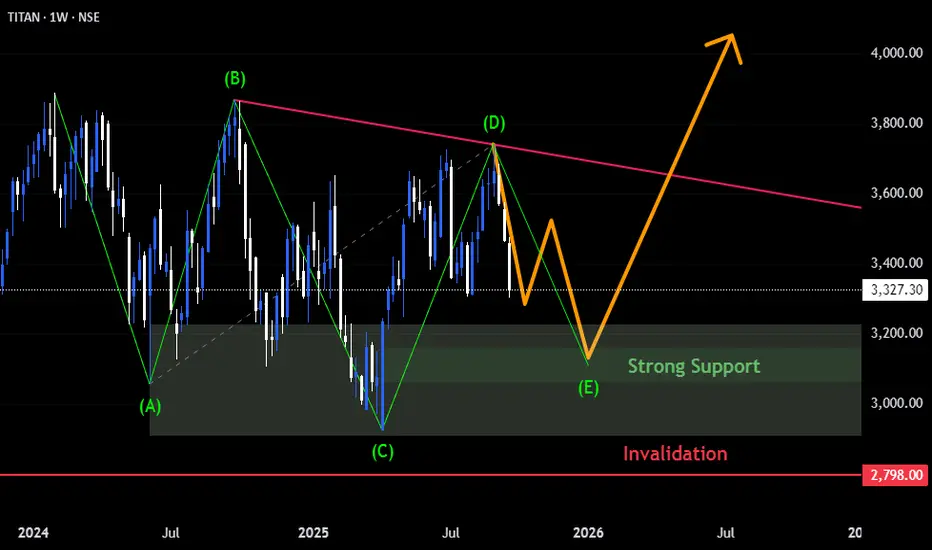
Titan Triangle Pattern TITAN is currently forming a Wave 4 Triangle as per Elliott Wave.
Waves (A), (B), (C), (D) are already complete.
Price is now inside Wave (E), which may take a few more weeks to develop.
Strong Support lies in the ₹3,100 – ₹3,200 zone.
Once Wave (E) is done, we may see a strong Wave 5 rally towards ₹4,000+.
💡 Wave 4 triangles usually act as continuation patterns — so the next leg (Wave 5) can be very powerful!
👉 Stay tuned with SpiderChart for more Elliott Wave forecasts and market insights.
NVDA - The Truth About Nvidia's ReversalAfter an impulse wave always comes a correction. Here you see the wave A going down and the wave B going up. The unexpected reversal everyone is talking about is the start of wave C to the downside.
The insane wave B has run its course and hit the ceiling. There's no more room to go. That's why there was a reversal. It has nothing to do with external forces or circumstances. It's the nature of the Elliott Wave.
All the optimism for Nvidia has been factored into wave B. You can easily tell by how long and extended the wave is. High optimism always accelerates the price, which results in longer impulse waves. In other words, all the juice has been squeezed and there's no more juice to squeeze. Nothing lasts forever. It's time for wave C to make an appearance.

#Bankifty directions and levels for nov 21thYou can use the same condition that we used when analyzing the Nifty chart thats Both the current and alternate views are bullish. The first view suggests that Gift Nifty indicates a neutral start. If the market opens neutral and then breaks the previous high, the rally is likely to continue. In this case, you can use the 20 EMA for trend identification. As long as the price stays above the 20 EMA, follow the prevailing direction. However, if it breaks below the 20 EMA, it may signal a potential reversal on the minor (15-minute) timeframe. Note that this analysis does not apply during consolidation phases.
On the other hand, if the market declines initially, the 38% Fibonacci retracement level will act as support. This is a trend-decider level, meaning that as long as the 38% Fibonacci level holds, the market trend remains bullish. If it breaks below this level, a minor reversal is possible. In that case, we can expect the price to move toward the 50% to 78% retracement levels within the current swing.(alternate view)

#Nifty directions and levels for nov 21thBoth the current and alternate views are bullish. The first view suggests that Gift Nifty indicates a neutral start. If the market opens neutral and then breaks the previous high, the rally is likely to continue. In this case, you can use the 20 EMA for trend identification. As long as the price stays above the 20 EMA, follow the prevailing direction. However, if it breaks below the 20 EMA, it may signal a potential reversal on the minor (15-minute) timeframe. Note that this analysis does not apply during consolidation phases.
On the other hand, if the market declines initially, the 38% Fibonacci retracement level will act as support. This is a trend-decider level, meaning that as long as the 38% Fibonacci level holds, the market trend remains bullish. If it breaks below this level, a minor reversal is possible. In that case, we can expect the price to move toward the 50% to 78% retracement levels within the current swing.(alternate view)

BTC.D – Five Waves Completed: Preparing for a Wave 2 RetracementBTC Dominance has reached a pivotal stage. After completing a clean five-wave impulsive structure to the upside, the chart is now signaling the early stages of a broader corrective retracement. This aligns with classic Elliott Wave behavior: once a five-wave advance concludes, the market typically enters a deeper, sentiment-resetting Wave 2. For BTC dominance, this phase often marks a shift away from Bitcoin strength and into altcoin outperformance — the groundwork for a potential altseason.
Across the chart, the impulsive top is clear. Wave (v) terminated inside a major multi-year resistance zone, accompanied by structural exhaustion and weakening momentum. Following the top, BTC.D broke below the rising trendline that had supported the entire advance. The subsequent retest and rejection of this trendline confirms that the prior trend has ended. This kind of structural break is a textbook early signal for the start of a corrective wave.
Wave 2 in dominance is known for being deep and rapid. Fibonacci retracements between the 0.5 and 0.786 levels are typical, and the BTC.D levels align perfectly with this expectation. The 50% level sits around 50.6%, the 0.618 at 47.5%, and the 0.786 at 43.5%. This entire region forms the primary target area for the developing Wave 2. It represents the zone where BTC.D is most likely to stabilize before preparing for a larger Wave 3 advance later on. But during Wave 2, dominance usually weakens sharply — often fueling significant rotations into altcoins.
The horizontal structure reinforces this view. The 61–63% band, which previously acted as demand, has now turned into resistance. As long as BTC.D remains below this zone, the bearish corrective thesis remains firmly intact. Only a decisive reclaim of this level would challenge the view that Wave 2 is unfolding.
There is an alternative scenario on the chart: the possibility that the entire structure is part of a larger macro regular flat, meaning the current move could be a Wave C push up into 69–73%. While technically valid, this path requires BTC.D to reclaim the broken trendline and break cleanly above the 63% resistance band. Until those signals appear, this scenario remains secondary.
At present, the dominant evidence points toward the onset of a Wave 2 decline — one that could bring BTC dominance back into the 50–43% range. Historically, such corrections have aligned with some of the most powerful altcoin expansions. If BTC.D continues to reject from the current zone, the conditions for another altseason may already be forming.

CRYPTO: USDT.D (1W)USDT.D – Reaching a Critical Inflection Zone (Elliott Wave + Fibs + S/R)
USDT Dominance is approaching a major decision point that has repeatedly acted as a structural pivot for crypto cycle rotations. With price pressing into a heavy multi-year supply zone around 6.3–7.0%, the current rise appears to be completing one of two higher-degree structures:
A corrective ABC where the market is finishing wave (c) of B,
Or a deeper Elliott Wave correction completing wave (c) of 2 before a larger risk-on impulse begins.
Both interpretations converge toward the same conclusion: USDT.D is nearing exhaustion, and the reaction here will likely set the tone for broader crypto trends heading into 2025–2026.
Elliott Wave Structure
The current advance fits cleanly within a corrective pattern. After the large impulsive decline, price carved out the classic five-wave drop into the 2024–2025 bottom. The rebound has since unfolded in a clear counter-trend form, with wave (a) and (b) already established and wave (c) extending into the upper resistance band.
The 6.5–7.0% zone is particularly important because it sits just beneath the invalidation level of the current wave count and marks the upper boundary of the corrective channel. Any strong rejection here would confirm the completion of wave (c) under both scenarios.
Fibonacci Confluence (Why This Area Matters)
The region USDT.D is testing is reinforced by multiple Fibonacci signals:
0.618 retracement of the previous decline
0.272 extension aligning with (c) projections
0.786 retracement as an upper limit on aggressive B-wave/extensions
Confluence between the fibs and long-term horizontal resistance
This creates a powerful “cluster zone” suggesting diminishing upside potential.
Major Support & Resistance Structure
The chart shows clear historical behavior around these key areas:
6.3–7.0% → Multi-year supply zone
This zone rejected price in past cycles and corresponds with corrective wave tops.
3.8–4.2% → Primary demand zone
This level aligns with previous accumulation, neckline structures, and fib retracements.
If USDT.D reverses, this zone becomes the first key target.
1.7% (1.618 extension)
The macro downside projection, which historically aligns with strong altseason periods.
Inverted Head & Shoulders Within Elliott Wave Context
A unique feature of this structure is the inverted head and shoulders that formed during the bottoming phase:
Left shoulder → wave (iii)
Head → wave (v)
Right shoulder → wave (b)
This is a classic Elliott Wave phenomenon. H&S (and inverted H&S) patterns often appear during transitional phases between impulsive and corrective structures, especially near the end of wave 1 or wave 2.
In this case, the iH&S acted as the springboard for the current rise — but it also signals that the corrective upside may be near completion.
Macro Projection: What Happens If We Reject?
A clean rejection from the 6.3–7.0% resistance would imply:
Completion of wave (c) of B or wave (c) of 2
Start of a major downside leg toward the 4% zone
Potential continuation into the 1.618 extension near 1.7%
Historically, such declines in USDT.D correlate with broad crypto strength, BTC rallies, and altcoin expansions.
Conclusion:
USDT Dominance is sitting at a highly compressed, multi-confluence resistance zone that aligns perfectly with both Elliott Wave and Fibonacci symmetry. Whether this structure resolves as completion of B or wave 2, the message is the same:
This is a high-risk area for dominance upside and a high-potential area for crypto risk-on rotation.
A decisive reaction in the coming weeks will likely define the next major phase of the crypto market

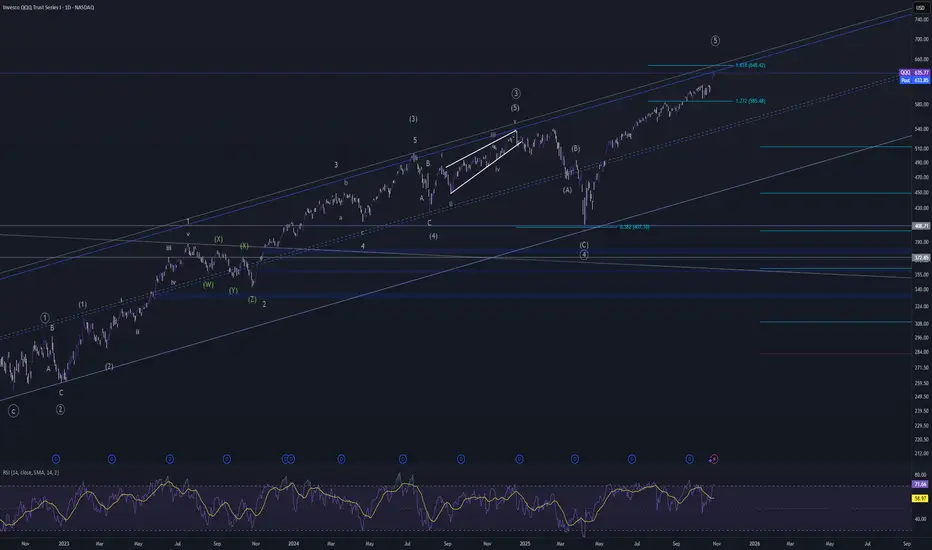
QQQ finally topping out?Getting near the top of the channel since 2022. The 161.8% extension of the drop down to April is right above today's high as well. Market is overbought with bearish divergence on the daily, weekly, and monthly. Maybe 1 more high???
TOTAL market cap to hit all time high! 🚀 Why I believe TOTAL MARKET CAP is bottoming & gearing up for a run to new ATHs 🟢📈
After reviewing Elliott Wave counts + classical price action, the structure looks extremely constructive. Here’s why 👇
🔍 Key Reasons I'm Expecting a Major Rally:
Wave 4 appears complete 🧩
Price just tapped the long-term trendline exactly where Wave 4 should typically end — shallow, corrective, and sentiment-driven.
Clean ABC correction ✔️
The drop has formed a textbook A-B-C zigzag, with Wave C terminating right on structural support.
Approaching major long-term trendline 📉➡️📈
Total market cap is retesting a multi-year ascending trendline that has held throughout the entire macro cycle.
A bounce here would be structurally consistent with the start of a Wave 5 rally.
Wave 5 structurally due ✨
Elliott Wave theory expects a strong, impulsive Wave 5 after a clean Wave 4 retracement. These are typically high-momentum rallies.
Bullish confluence across timeframes ⏳
Daily + weekly oversold metrics line up directly at major structural support.
🔥 If this read holds, TOTAL MARKET CAP could be preparing for a rally straight into new all-time highs.

Ethereum – Downside path📉 CRYPTO:ETHUSD is approaching the equal legs area at 2788–2432, which can trigger a daily bounce in the coming weeks.
After that reaction, the market is expected to form another lower high before continuing the downside path toward the previous April lows near 1500.

CRYPTO: BITCOIN (1D)Bitcoin Elliott Wave Analysis: Critical Decision Zone as BTC Tests Long-Term Support
Bitcoin is approaching one of the most important support levels in its current Elliott Wave cycle. The broader technical picture still supports a long-term bullish count, but the market is now testing the boundaries of that view. How BTC reacts at this level may define the entire trajectory of 2026.
Wave Count Overview: Completing a Major (4) or Something Deeper?
Your chart suggests BTC is likely in a Wave (4) corrective phase following a strong impulsive advance from 2022–2024. Price has now retraced deeply into the 0.618–0.786 Fibonacci zone, which often serves as the final stopping point for a Wave (4) low.
Key features in the structure:
Strong impulsive Waves (i), (ii), (iii), and (iv) are clearly marked within a long-term ascending channel.
BTC is retesting the lower boundary of this channel — a historically high-probability support area.
A significant Hidden Bullish Divergence is forming on the RSI, reinforcing the idea that momentum to the downside is weakening.
These elements together suggest that BTC may be bottoming out, but the market needs to confirm.
Critical Support Levels
There are two major zones to watch:
1. 0.618–0.786 Retracement Zone (current level)
BTC is currently inside this cluster:
0.618 ≈ $91,173
0.786 ≈ $83,459
This area is where Wave (4) corrections often complete. A bounce here could launch the final Wave (5) toward the $140,000–$160,000 region.
2. Long-Term Invalidation Level (~$74,149)
You highlighted this line on your chart.
If BTC breaks and closes decisively below this level, the long-term bullish Elliott Wave count is invalidated. That would imply the market has entered a larger corrective structure — potentially the start of a multi-month bear phase.
Bullish Scenario: Preparing for Wave (5)
If BTC holds the bottom of this support cluster and rebounds:
Wave (5) could begin from this area
Price targets for Wave (5) extend toward $147,000 and higher
Hidden bullish divergences strengthen the case for upward reversal
RSI is oversold, historically a strong buy signal during corrections
This aligns with the idea that BTC is months away from the next major rally.
Bearish Scenario: Deeper Correction if Support Breaks
If support fails — especially if BTC falls below the $74,149 invalidation line — then:
The long-term bullish count is broken
BTC may begin a larger ABC or W-X-Y correction
Price could revisit the broad bear market box you highlighted near $26,000–$32,000
Macro sentiment across crypto would likely deteriorate sharply
This would shift the narrative from “Wave (4) ending” to “Cycle correction in progress”.
Conclusion: BTC at a Major Decision Point
Bitcoin is entering a highly sensitive region technically:
Hold support → Begin Wave (5) toward new all-time highs
Lose support → Revisit lower macro levels before the next cycle begins
Right now, the evidence leans bullish — RSI divergence, channel support, and Fibonacci alignment — but the invalidation level cannot be ignored.
BTC is likely close to a major bottom, but one final sweep lower remains possible before the next major uptrend begins.

XAUUSD PULLBACK SCENARIOLooking GOLD 2H seems like it might to complex correction, wave 2( wave A,formed, current B is finishing, leg C with be formed), other wise if breaks that lows, means was 2 just ended on that pullback top. Goodluck

CRYPTO: ETH/BTC (1D)ETH/BTC Elliott Wave Outlook: Is More Downside Ahead for Altcoins?
The ETH/BTC pair continues to sit at a critical juncture, and the broader altcoin market is watching closely. Using an Elliott Wave framework, the current structure suggests that both bullish continuation and a deeper corrective leg remain possible — but the next move depends heavily on how price behaves at the present support zone.
Current Structure: Wave (4) or Something Deeper?
Based on the chart, ETH/BTC completed a strong impulsive rally into what appears to be Wave (3), followed by a prolonged corrective structure labeled W–Y, which forms the basis of Wave (4).
Price is currently consolidating inside a key support zone — an area that aligns with the 0.618 retracement of the prior major impulse. This is typically a high-probability region for a Wave (4) low to form. But so far, buyers have not shown strong dominance, and price remains under a descending resistance trendline.
Scenario 1: Support Holds → Wave (5) Rally
If ETH/BTC holds the shaded support block, we may see the next leg higher — Wave (5).
This would likely result in:
A breakout above the descending trendline
A move toward the Fibonacci extensions shown on the chart
Altcoins gaining relative strength against Bitcoin
Wave (5) targets typically project toward the 0.236–0.382 extension, aligning with the higher levels drawn on your chart. This would favor a strong ETH recovery relative to BTC into early 2026.
Scenario 2: Support Breaks → More Downside First
However, a break below this structure — especially a move beneath the previous swing low — would invalidate the bullish Wave (4) interpretation.
If that happens:
ETH/BTC enters a deeper corrective phase
Altcoins (especially ETH) may continue underperforming
Price could drop toward the deeper 0.618 Fibonacci zone
The "invalidations" level becomes a critical marker
This deeper decline would likely be the final washout before a much larger upside reversal — essentially completing the correction before a true macro impulsive wave begins.
So, Are We Expecting More Downside for Alts?
Yes — more downside is still possible, but not guaranteed.
The market is sitting at a decision point:
Hold support → Begin Wave (5) upward
Break support → One more significant drop before recovery
Until the current range resolves, ETH/BTC remains neutral-to-cautiously-bearish, with structural bullish potential still intact as long as the key invalidation level holds.

SELL BITCOIN It's ready for the drip just needs to fill some ob- and fvg within the four hour ob-
Keep watching and good luck good trading

Bitcoin Roadmap: Is This the Beginning of the Short-Term Rally?Today I want to share with you the Bitcoin ( BINANCE:BTCUSDT ) chart on the 15-minute time frame. This analysis is in line with the previous analysis (still valid) .
These days, considering that Bitcoin is facing many parameters to analyze. One of the most important parameters is the SPX500 index ( SP:SPX ). I am long on the SPX500 index.
Bitcoin is currently moving in the Support zone($91,900-$88,400) and near the Support lines and Cumulative Long Liquidation Leverage($91,131-$90,477) .
In terms of Elliott Wave theory, it seems that Bitcoin completed wave 5 with an Expanding Ending Diagonal , and we can now expect the start of the bullish waves , at least in the short term .
I expect Bitcoin to start rising from the Support zone($91,900-$88,400) and at least attack the Resistance lines . If the Resistance lines and the $95,700 level are broken with high momentum, we can expect further growth of Bitcoin.
First Target: $93,921
Second Target: $95,273
Third Target: $97,477
Stop Loss(SL): $89,537
Points may shift as the market evolves
Cumulative Long Liquidation Leverage: $88,570-$87,227
Cumulative Short Liquidation Leverage: $94,500-$93,785
Where do you think Bitcoin’s correction will go?
Please respect each other's ideas and express them politely if you agree or disagree.
Bitcoin Analysis (BTCUSDT), 15-minute time frame.
Be sure to follow the updated ideas.
Do not forget to put a Stop loss for your positions (For every position you want to open).
Please follow your strategy and updates; this is just my Idea, and I will gladly see your ideas in this post.
Please do not forget the ✅' like '✅ button 🙏😊 & Share it with your friends; thanks, and Trade safe.

The GBPJPY Trap | Smart Money’s Next Big Move📉 GBPJPY – Potential Completion of Wave (B), Major Correction Ahead
The long-term bullish cycle on GBPJPY appears to be approaching exhaustion, with technical structure and macro dynamics both signaling a potential Wave (2) corrective phase in motion.
🧩 Elliott Wave Structure
The impulsive advance from the 2020 lows likely represents Wave (1) of a broader cycle, topping near the 208.00 region. Current price action suggests a completed Wave (B) within a larger (A)-(B)-(C) corrective structure, implying downside continuation toward the Wave (2) completion zone between 168.00–158.00 .
📊 Market Structure & Smart Money Context
A Break of Structure (BOS) has emerged beneath 205.00, confirming distribution after prolonged accumulation. Price has also swept liquidity above the prior swing high, aligning with classic Smart Money Concepts — premium pricing before a potential markdown phase.
🔍 Fibonacci & Confluence Zones
The 0.618–0.786 retracement of the Wave (1) impulse coincides with the 168.00–158.00 area, a key Fibonacci confluence that aligns with prior weekly demand and unmitigated imbalance zones . This confluence supports a high-probability reaccumulation area once corrective pressure subsides.
💼 Fundamental Backdrop
From a macro perspective, GBP remains constrained by persistent inflation and stagnating growth, while JPY fundamentals are shifting as the BoJ hints at policy normalization. Any tightening in Japanese yields could amplify downside momentum in GBPJPY.
🎯 Projected Levels
Near-term support: 175.00
Key demand zone: 168.00–158.00
Long-term invalidation: Below 158.00
🕰 Outlook
Until the market confirms a higher-timeframe reversal pattern within the identified demand zone, further downside remains probable. Medium-term traders should monitor liquidity sweeps and BOS confirmations on lower timeframes for re-entry setups.
Stay sharp — Wave C could be fast and decisive! ⚡
What’s your take, traders? 🤔
Do you think Wave C is about to drop hard or will bulls surprise us again? 🐻📉🐂
📈Drop your analysis 👇 — let’s see who nails the next big move! 🚀
⚠️ Disclaimer:
This analysis is for educational purposes only and does not constitute financial advice. Always perform your own due diligence before executing any trades.
#GBPJPY #ElliottWave #SmartMoneyConcepts #MarketStructure #ForexAnalysis #TechnicalAnalysis #Fibonacci #FXTrading #MacroAnalysis #TradingView

XAUUSD_1H_BuyGold Analysis Short and Medium Term Elliott Wave Analysis Style The market is completing wave B and entering wave C.
