HBAR Bull Pennant or deeper correction?HBAR wave (2) appears to be completed at $0.122 the 0.5 Fibonacci retracement and High Volume Node support.
However, price does appear to have completed an ABC corrective wave up keeping the the wave (2) alive with a target of the S1 pivot, 'alt-coin golden pocket' 78.6 Fib retracement and High Volume Node support. The high probability terminal target area if we continue lower.
Bulls want to see the local downside action complete as a bull pennant and continue to the upside negating the ABC corrective wave.
Currently price is a below the weekly pivot, RSI is crossed bearishly at the EQ.
Upside targets remain $0.77 - $1.16 at the R3-R5 weekly pivots.
Safe trading
Elliott Wave

FET Macro Outlook, Why Hasn't it moved?NYSE:FET macro still appears to be in an expanding megaphone pattern with an expected terminal target of the R2 pivot at $4.73 almost a 10x from here.
After being one of the best performers late 2024 FET drew a lot of attention and trapped a lot of new investors and traders. This attracts whales, who pray on the assets sentiment and hope. They apply continued downside pressure every time it pumps as new traders will get excited about that big profits happening again and this wont stop until everyone capitulates and leaves the asset.
Wave 2 of V appears to be underway with a target of the ascending orange support line.
Analysis is invalidated if we drop below wave IV and head to the High Volume Node support at $0.3 keeping wave IV alive but highly likely terminating there and starting a new uptrend with power.
Price is below the weekly 200EMA and weekly RSI is in bottoming zone but and may print bullish divergence.
I plan to execute longs at the key areas to capture at least a bounce profit if not the bottom.
Safe trading

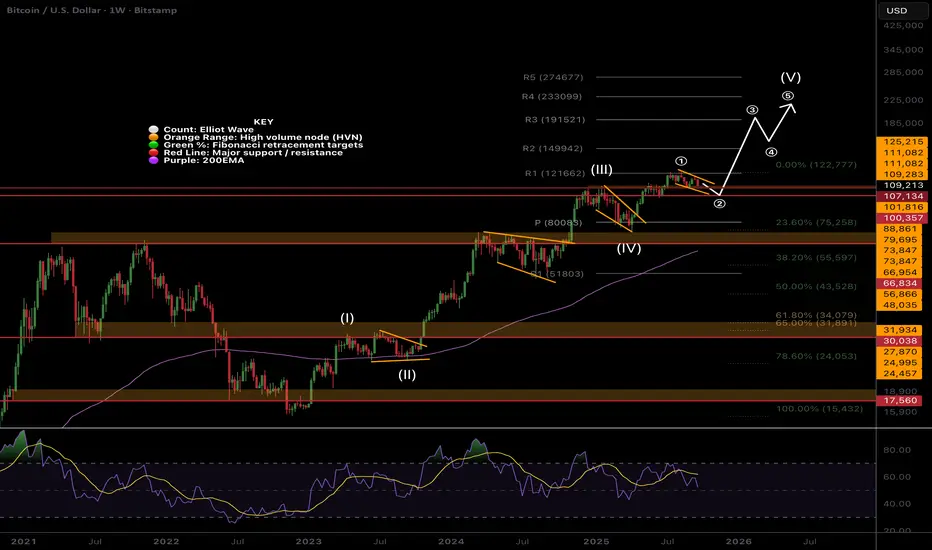
BTC Macro Outlook, Why all the Worry?When you zoom out CRYPTOCAP:BTC looks fantastic, sitting in a range at all time high, but the sentiment is extremely negative, a winning combination for continued upside!
Wave (1) of V into all high appears complete at the R1 pivot. Wave 2 has a downside target of the next High Volume Node at $107k the previous all time high range.
A deeper pullback to the weekly pivot would not be surprising and hit investors hard into capitulation, reminiscent of 2017. Price would meet with the rising weekly 200EMA around $80k. This move could present an excellent buy opportunity and would still have the same terminal targets in the long run!
For now the trend is up with price so far doing a x8 from bottom. TradFi dream of returns like this.
Weekly bearish divergences are dropping away as RSI is back at the EQ.
Safe trading
ETH Macro Picture, Pullback then $10k?CRYPTOCAP:ETH had a massive rally from the wave (II) bottom with a poke above all time high followed by extremely greedy sentiment on social and mainstream media of which I was warning should mark a local top and trap new investors.
Price has now pulled back to the first High Volume Node support target. I am expectinga deeper pullback over the next few weeks to complete wave (2) with an initial terminal target of the weekly pivot $3179 which is also the 0.382 Fibonacci retracement. That would be shallow for wave 2 which is expected in a wave III. However, the 0.5 Fibonacci retracement sits at the next major High Volume Node support where it is expected to meet the weekly 200EMA adding a lot of confluence to this are as the next bottom, $2660.
Any further downside bring up the S1 weekly pivot, golden pocket and high volume node, $2250.
There is weekly bearish divergence from the early 2024 highs.
I will play this trading plan point by point and look for longs at key levels to at least secure some bounce profits if not find a bottom.
Safe trading

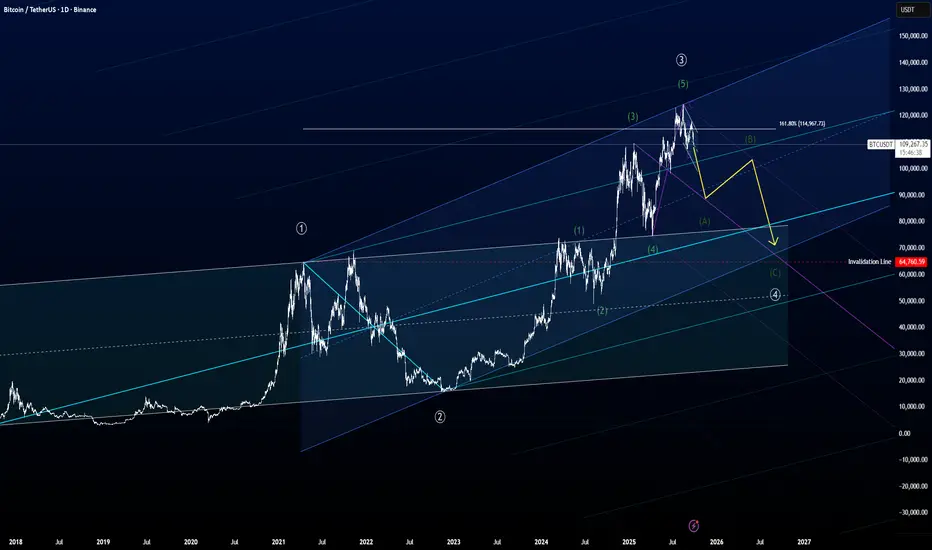
BTC has started going down the slope..I can easy count 5 green intermediate waves up.
Last top was just above the 161,8% fib level of primary white ((1)).
It's outside of the pitchfork, it's outside of the white base channel indicating the primary white 3 was underway.
By having a good 5 wave structure in the last wave up, I believe this is the intermediate green 5 wave done, and hereby primary white 4 has started.
How low can it go? By a rule from Elliott, wave 4 cannot enter the territory of wave 1, so this would mean the absolut low of wave 4 would be at the 64,760 level.
After we had, what I counted as a primary white wave 2 formed as a flat, it will be fair to presume we will have a relative quick primary white wave 4, because of the guideline of alternation. Also as a guideline we can lean to a Kennedy Channeling Technique, which states that wave 4 is usually not done before touching the bottom of the acceleration channel, which I have colored in blue.
The simplest path of wave 4 would be a zig-zag, which I have drawn in yellow. And I anticipate the first wave down, intermediate green A, not to end before around $90.000, then we will have a intermediate green B, then intermediate green C.
A choice could very well be that it will form as a triangle, because so many still believe the surge of BTC never stops. But still my anticipation of intermediate green wave A will be around the $90.000 level.
This is the most optimistic count I feel I could do on BTC. Another, but not as likely, count could be that we already have seen the wave 5, and then there is no absolute bottom other than 0.
Because this would mean we have seen the top of wave 1 of a higher degree, and wave 2 can retrace all the way back to the start of wave 1 without invalidating anything.
But this pessimistic count is not my preferred count at the moment.
Solana macro retracement complete , full on bear marketEyeing 40-70 dollar solana post macro C wave correction. the ending diagonal on the retracement gives me reason to believe we are in full bear , and we have been for a while. Looking for critiques and alternate wave counts are welcome to test my thesis. I would love higher prices ,but I have to protect my positions if i'm seeing bearish counts.

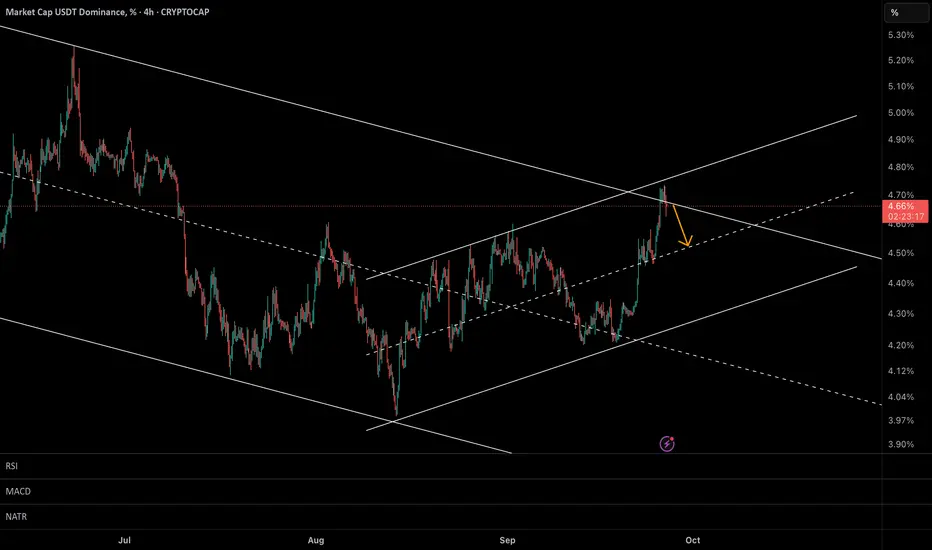
USDT Dominance at a Critical Turning Point–Will Correction BeginIn my previous analysis, I highlighted that USDT dominance had likely completed a 5-wave Elliott structure around 4.60%–4.65%, suggesting that a corrective ABC decline could follow.
That call played out accurately, with dominance stalling right at the projected resistance zone.
🔎 Current Update:
• Price has now hit the top of the larger descending channel as well as the upper boundary of the short-term rising channel → creating a confluence resistance near 4.70%.
• This level remains a high-probability reversal zone.
📊 Scenarios:
• 🔻 Bearish (More Likely):
Rejection from 4.65%–4.70% could confirm the corrective ABC pattern, targeting 4.30%–4.20% next.
👉 This would signal capital rotation back into crypto & altcoins.
• 🟢 Bullish (Alternative):
A confirmed breakout above 4.70% would open the door toward 4.90%, extending pressure on the crypto market.
⸻
📌 Conclusion:
Given the technical confluence, the odds still favor a pullback in USDT dominance, which could give altcoins some room to breathe in the coming sessions.
GOLD → Consolidation ahead of the news. Rise or fall?FX:XAUUSD is consolidating in the range of 3738-3759 in anticipation of US PCE inflation data, a key indicator for forecasting further Fed policy. Pressure on the metal is intensifying amid a strengthening dollar.
The revision of GDP growth in Q2 to 3.8%, a decline in jobless claims, and an increase in durable goods orders have lowered expectations for aggressive Fed easing.
The new tariffs imposed by Trump have supported demand for defensive assets, but have not been able to offset the pressure from the rise of the USD.
The overall fundamental backdrop is stagnant amid Powell's uncertain stance and the start of a rate cut cycle. The market reaction is mixed...
Gold is in wait-and-see mode. Strong PCE data could send the price to support at $3700, while weak data could bring back interest in record highs.
Resistance levels: 3754, 3759, 3776
Support levels: 3738, 3728, 3703
Technically, the price is storming the resistance of the downward correction and the resistance of the “triangle” consolidation. A breakout and close above 3754-3759 will confirm the bullish sentiment, which could trigger growth towards the ATH. Otherwise, we can expect a retest of 3738-3728 before a possible rise.
Best regards, R. Linda!

EURUSD | Rising Wedge structure WAVE 4Price is moving inside a Rising Wedge.
Wave (IV) correction is unfolding 🔻, targeting 1.1570–1.1500 support zone.
From there, a bullish leg ⚡ (Wave V) can start, aiming above 1.20.
👉 Short-term: Bearish bias.
👉 Medium-term: Bullish continuation after Wave (IV).
⚠️ Educational view, not financial advice.

Bitcoin Roadmap: Can BTC Hold the $108K Before Next Big move!?Bitcoin( BINANCE:BTCUSDT ) managed to break the Support zone($110,920-$109,900) and Support lines yesterday with the help of a Bearish Marubozu Candle(the Marubozu candle volume was acceptable).
Bitcoin is still moving in the Heavy Support zone($112,000-$105,800) and near the important Support line, Potential Reversal Zone(PRZ) , Cumulative Long Liquidation Leverage($108,165-$107,000).
In terms of Elliott Wave theory, Bitcoin appears to be completing microwave 5 of the main wave 3. Microwave 4 of the main wave 3 is of the Contracting Triangle type, and the main wave 3 is of the extended type.
I expect Bitcoin to start rising and attack the Resistance lines after completing the main wave 3 from the Potential Reversal Zone(PRZ) , Support zone($108,200-$107,240), and Important Support line.
Cumulative Short Liquidation Leverage: $110,624-$109,836
Note: If Bitcoin touches $106,800, we can expect a break of the Heavy Support zone($112,000-$105,800).
Note: If Bitcoin goes above $111,000, we can expect a renewed rise in Bitcoin.
---------------------------------------------
One of the indices that helps the Roadmap of Bitcoin and other tokens is the USDT.D%.
USDT.D% currently seems to have managed to break the heavy resistance zone and this is NOT good news for Bitcoin and other tokens, and perhaps a further correction in the crypto market is on the way.
USDT.D%’s roadmap for me is that it is almost in line with today’s analysis of Bitcoin.
---------------------------------------------
Please respect each other's ideas and express them politely if you agree or disagree.
Bitcoin Analysis (BTCUSDT), 1-hour time frame.
Be sure to follow the updated ideas.
Do not forget to put a Stop loss for your positions (For every position you want to open).
Please follow your strategy and updates; this is just my Idea, and I will gladly see your ideas in this post.
Please do not forget the ✅' like '✅ button 🙏😊 & Share it with your friends; thanks, and Trade safe.

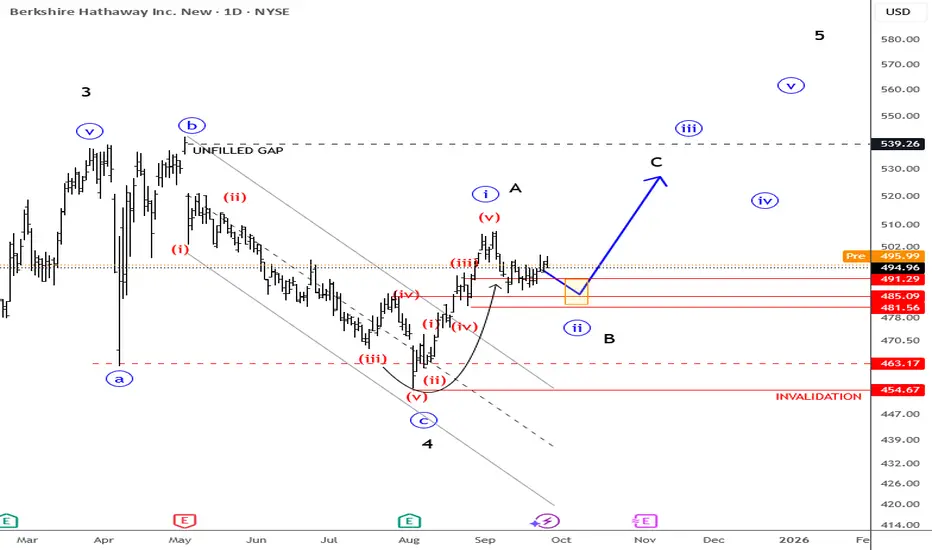
Berkshire Hathaway: Clear Wave Structure Offering More GainsWhen I scan through charts, whether it’s stocks, currencies, or commodities, I want to focus on something that has a clear wave structure. Patterns like this allow me to read price action with more confidence, without needing to guess or force an opinion. Berkshire Hathaway is one of those charts right now.
What stands out is the sharp selloff, which looks like a textbook impulse. More importantly, there’s also a clear impulsive move from the lows. That combination suggests we could be looking at wave C low of a completed flat correction. If that’s the case, then more upside should follow.
Even in a less bullish scenario, where the structure plays out only as a temporary A-B-C rally, we would still expect further gains in wave C after the current pause. Either way, the clear structure points higher near term.
For me, this is where the opportunity lies. Markets are full of noise, but when you find a chart with this kind of clarity, it becomes easier to focus and build a plan around it.
Grega
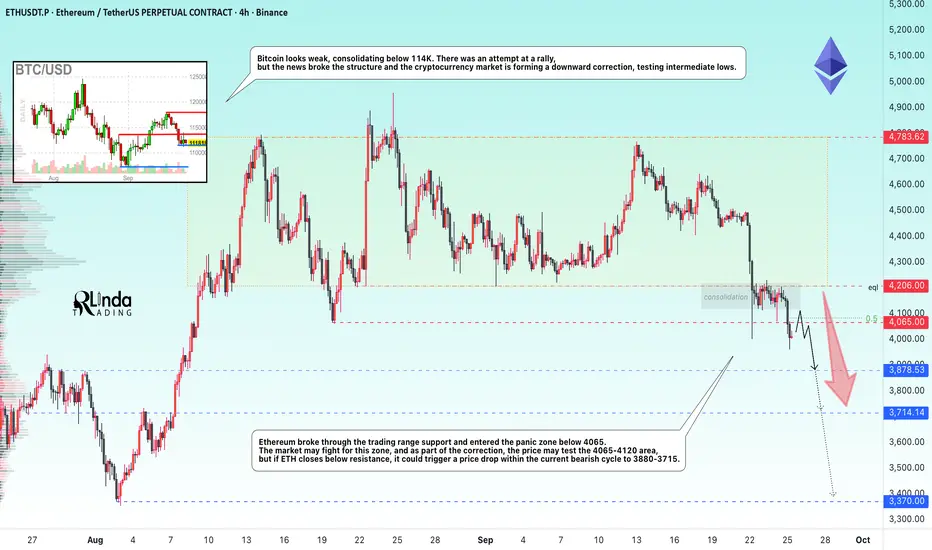
ETHEREUM → False breakout of 4100. Panic?BINANCE:ETHUSDT is forming a false breakout of resistance on the daily chart, formed by the ATH of the previous bullish cycle - 4100. Closing below this level could cause panic in the market...
Bitcoin looks weak, consolidating below 114K. There was an attempt at a rally, but the news broke the structure and the cryptocurrency market is forming a downward correction, testing intermediate lows.
Ethereum broke the support of the trading range and entered the panic zone - below 4065. The market may fight for this zone, and as part of the correction, the price may test the 4065-4120 area, but if ETH closes below resistance, it could trigger a price drop within the current bearish cycle to 3880-3715.
Resistance levels: 4065, 4120, 4206
Support levels: 3880: 3715, 3370
On D1, the structure is weak, the price breaks through 4100-4090 and consolidates in the sales zone. Everyone who bought above 4100 can now start active sales due to the activation of stop orders, panic, fear, and the reversal of their positions. If the market does not receive support (bullish driver), the correction may continue. The nearest target is 3878 - 3715 7 3400
Sincerely, R. Linda!
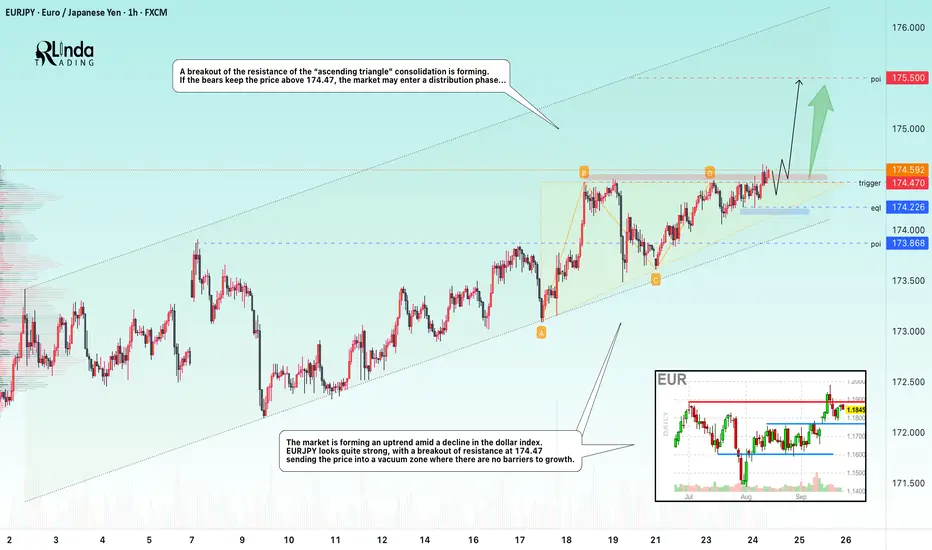
EURJPY → The classical model of technical analysis FX:EURJPY is attempting to break through resistance. The trend is bullish, and the probability of continued growth after consolidation above 174.50 is quite high...
The market is forming an uptrend amid a decline in the dollar index. EURJPY looks quite strong, breaking through resistance at 174.47 sends the price into a void zone where there are no barriers to growth.
A breakout of the “ascending triangle” consolidation resistance is forming. If the bears keep the price above 174.47, the market may enter a distribution phase...
Resistance levels: 174.47, 175.0
Support levels: 174.226, 173.86
The classic technical model for the continuation of the movement is a breakout of the resistance of the ascending triangle. Consolidation of the price above 174.47 - 174.5 may provoke a continuation of the movement within the bullish trend.
Best regards, R. Linda!
Bitcoin Might Be Forming a New Ending Diagonal!! (Preliminary Analysis – No Clear Confirmation Yet)
The only factor supporting the diagonal possibility is that the rise marked in red is not an impulsive wave, which could indicate a classic ending diagonal formation.
However, the starting point of the third wave of the diagonal remains uncertain. It could start from the current level or after a drop to around 60K before initiating an upward move.
As stated in the title, this analysis lacks strong confirmations and should be viewed as an early observation. 🔍📉📈

ETH Elliott Wave - WXY Correction Complete soon!This chart analyzes Ethereum (ETHUSD) at the conclusion phase of a major WXY corrective structure, highlighting the technical environment for a new impulsive wave sequence. Price action is assessed using multiple technical indicators:
Elliott Wave Structure: The chart maps a completed 1-2-3-4-5 impulse, followed by W–X–Y corrective waves. The final Y leg approaches the critical Point 4 support, maintaining overall cycle validity and setting the stage for significant trend reversal once completed.
Ichimoku Cloud: ETH price is currently testing the lower bounds of the Ichimoku cloud, reinforcing a major support zone. A close above the cloud would further validate trend reversal; a breakdown would signal extended bearish pressure.
Volume Profile: Recent sessions show a spike in trading volume as price approaches historical support levels, indicating potential capitulation and increased probability of trend exhaustion.
Fibonacci Retracement: Key supports are identified at the 38.2%, 50%, and 61.8% levels, with the 38.2% zone (around $3,600) as a strong candidate for final Y wave completion based on confluence with cloud and momentum indicators.
RSI and Stochastic RSI: Both relative strength oscillators are in oversold territory, consistent with the final stages of a corrective structure. A bullish crossover or RSI divergence would strengthen the reversal thesis.
CVO/OBV: Volume-based momentum indicators confirm heavy participation during the latter stages of the sell-off, validating the probability of a strong bounce once buyers re-enter.
Scenario Outlook:
The analysis anticipates that, upon completion of the WXY correction—ideally above the Point 4 support (roughly $3,350)—Ethereum is set for a new impulsive uptrend as part of the final bull market rally. The setup favors strategic accumulation in the defined support zones, with projected upside targets ranging from previous all-time highs (~$4,950) to extended Fibonacci projections should the market move through a classical 1-2-3-4-5 impulsive wave.


Bitcoin Setup: Eyeing CME Gap at $113KBitcoin( BINANCE:BTCUSDT ) is currently trading in a Heavy Support zone($112,000-$105,800) and near the Support zone($110,920-$109,900), Support lines, Potential Reversal Zone(PRZ) , and Cumulative Long Liquidation Leverage($110,430-$109,660).
In terms of Elliott Wave theory, Bitcoin seems to have completed a microwave 5, the reason for today's drop was the correction in the SPX500 index( SP:SPX ) and the release of US indices(Final GDP q/q, Unemployment Claims).
Also, we can see the Regular Divergence(RD+) between Consecutive Valleys.
I expect Bitcoin to move back above 100_EMA(Daily) because the breakout volume was not enough, and attack the Resistance lines. If the Resistance lines are broken we can expect the CME Gap($113,380-$113,275) to fill.
First Target: $112,600
Second Target: $113,280
Stop Loss(SL): $109,280
Cumulative Short Liquidation Leverage: $114,866-$113,720
Please respect each other's ideas and express them politely if you agree or disagree.
Bitcoin Analysis (BTCUSDT), 1-hour time frame.
Be sure to follow the updated ideas.
Do not forget to put a Stop loss for your positions (For every position you want to open).
Please follow your strategy and updates; this is just my Idea, and I will gladly see your ideas in this post.
Please do not forget the ✅' like '✅ button 🙏😊 & Share it with your friends; thanks, and Trade safe.

JD - Good area to go longJD is a lagger when compared to BABA.
This is in a good buy zone now.
Technical -
- Wave 3 just started
- Held good in the value area around 30
- Held above 50 WMA
- Weekly Bull Flag
Long anywhere here (My avg is 35)
Target 1 - 43 -- Tough one, once this is clear, we can see some momentum
Target 2 - 52
Target 3- 61
Target 4- 71
Stop Loss - 30

CHFJPY – Wave Analysis OutlookCHFJPY has been unfolding within a complex corrective structure labeled as W–X–Y. The recent advance looks extended, and based on the current structure, I’ll be watching closely for a potential bounce from the green box zone (support area).
This green box represents a key confluence of support, aligning with both the trendline and Fibonacci extension levels.
If price holds and consolidates here, a bullish reaction could develop, giving continuation toward the upside.
The 1st target sits near 187.30–187.50 (–0.236 Fib), while the 2nd target is around 189.10 (–0.618 Fib extension).
A failure to hold the green box, however, could invalidate the bullish scenario and open deeper pullback targets at 185.26 / 184.57 / 183.44.
👉 My primary expectation is for buy setups if the pair shows strength from this zone, targeting higher extensions.
⚠️ Disclaimer: This outlook is my personal wave analysis and shared for educational purposes only. It is not financial advice. Trading involves risk — always do your own research and manage risk carefully.

ETHUSD bullish analysisBullish analysis of ETHUSD.
Looking for wave ((5)) of iii north of 6k.
Let's go!

BTCUSD Elliott WaveHello friends
We are witnessing the formation of a complete Elliott wave pattern on the BTC USD chart.
These waves from 1 to 5 are quite clear and you can even count their sub-waves. Now wave 5 is complete and a downward wave has formed in the form of a zigzag.
At the moment our theory is a zigzag, because a 5-wave may also form in the form of a correction.
Waves 1 or A and 2 or B are fully formed and we are currently in wave 3 or C.
So the price of Bitcoin should fall to the $100,000 range, which is also a psychological support.
Good luck and be profitable.

GBPUSD Short Trade Plan – PRZ in Sight!Today I want to review a short setup on the GBPUSD ( FX:GBPUSD ) pair .
GBPUSD is currently near the Resistance zone($1.360-$1.351) and Support lines .
The question is, can GBPUSD break the Support lines!?
GBPUSD started to decline with a lot of momentum over the past week and this is a good sign for a break of the support lines .
According to Elliott Wave theory , GBPUSD appears to be completing microwave 4 , and given the bearish momentum , we can expect microwave 5 to break the support lines .
I expect GBPUSD to fall at least to the Potential Reversal Zone(PRZ) .
Stop Loss(SL): 1.3600 USD
Please respect each other's ideas and express them politely if you agree or disagree.
British Pound / U.S Dollar Analysis (GBPUSD), 4-hour time frame.
Be sure to follow the updated ideas.
Do not forget to put a Stop loss for your positions (For every position you want to open).
Please follow your strategy and updates; this is just my Idea, and I will gladly see your ideas in this post.
Please do not forget the ✅' like '✅ button 🙏😊 & Share it with your friends; thanks, and Trade safe.

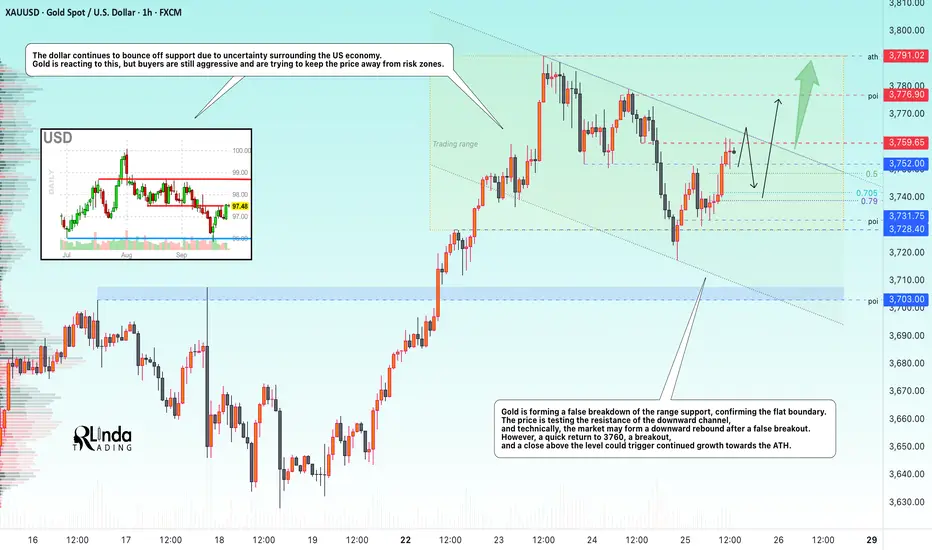
GOLD → Will the correction continue, or is it time for growth?FX:XAUUSD is inside a descending channel—corrections within a global bullish trend. The price is forming a retest of resistance, and the market's reaction to the 3760 zone will give further insight into price movement...
Gold is consolidating in the range of 3730-3790 in anticipation of US economic data and speeches by Fed officials. Pressure on the metal is intensifying due to revised expectations for rate cuts and a correction in the dollar...
Key factors: Markets have reduced expectations for easing to 43 bps by the end of the year after cautious comments from the Fed. The dollar index has reached a 9-day high, limiting gold's growth. Tensions between Russia and NATO are preventing gold from falling.
The market is in wait-and-see mode ahead of tomorrow's PCE data. Strong data today will strengthen the dollar and reinforce the correction in the metal, while escalating geopolitics will bring back demand for safe havens.
Resistance levels: 3760, 3776, 3791
Support levels: 3752, 3741, 3731
Technically, the market is testing downward resistance. Since the opening of the session, the price has already moved a lot and there may not be enough potential for an initial breakout. I expect a pullback to 3745-3740, and if the bulls return the price to 3760, the market will have a chance to break through resistance and continue growing towards the resistance level of the range.
Best regards, R. Linda!