XAGUSD, Elliott wave analysisOutlook for XGUUSD on the 3-day chart.
There have been no changes since the last update.
The price has reached the channel line, indicated by the green line.
It may be entering a corrective wave phase.
However, a breakout above the channel line would likely reinforce bullish momentum.
Elliott Wave

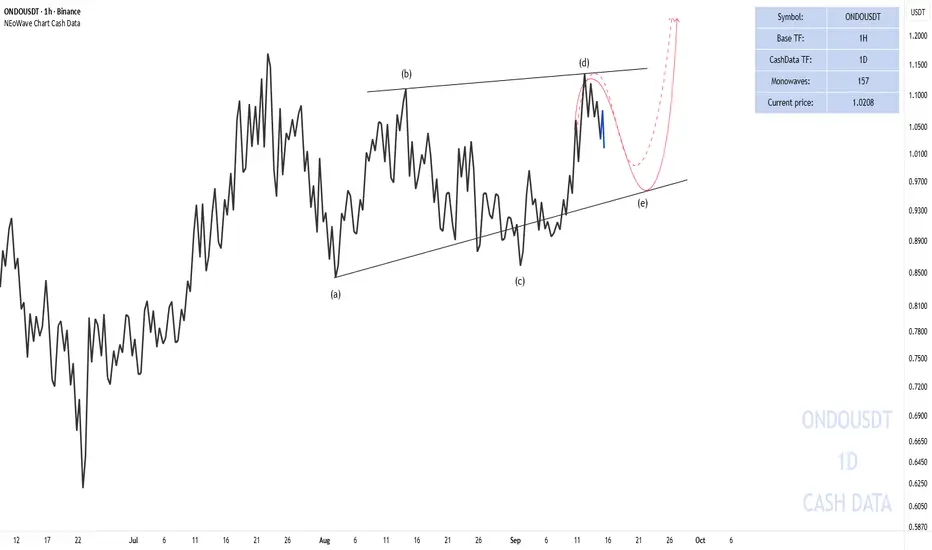
ONDO NEoWave AnalysisWith the price movement of wave-(d) exceeding our expectations, the contracting pattern is not observed in the formed structure, and thus the contracting structure is no longer valid.
It appears that a reverse triangle is forming, but the targets remain unchanged.
Good luck,
NEoWave Chart
ETH/USDTI think wave B is in the form of a completed triangle for wave C, so I will open a short position with this setup.

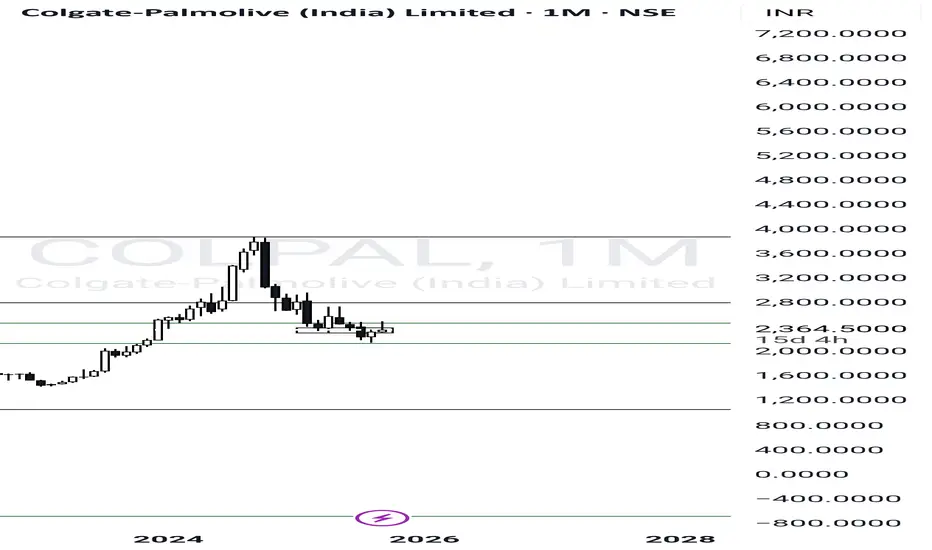
COLPAL - Poised for an upmoveColgate Palmolive is looking good for an upmove after months of correction. Good to add to the watchlist
PalantirPrice made it into the target box last Friday. If you recall, I placed this box a little under a month ago. No, price was not guaranteed to make it to this area. However, it is the STANDARD place for price to have went. Not to make it to this area would have been the exception, not the norm.
That being said, I do not think this move higher is done yet. Right now, we're seeing a reaction from the 0.618 retracement fib. I believe this is also due to price being within a micro-wave 4. If this is the case, we should get OMH with the possibility of two more if I am off by a degree. Either way, I believe we move slightly higher before completion.
The minor C wave, if price terminates within this box, should be targeting the $130's - $112 area. Time will tell, but right now, we should be focusing on the last move higher coming.

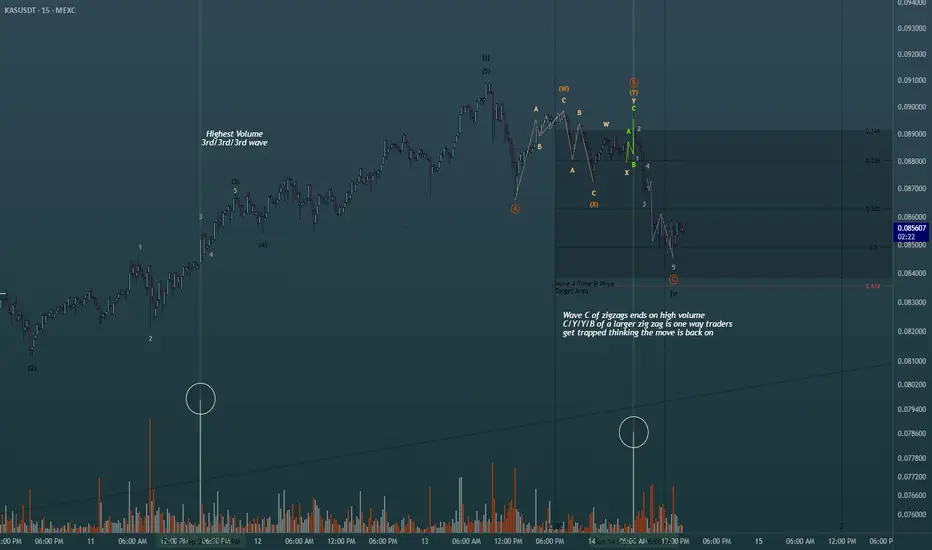
Using simple volume for added confluence in Elliott Wave Theory!Shown on the chart is 2 of the ways you can use the highest volume spikes on the chart to find out where you are in the wave count. Easiest way is to find the highest volume with the steepest slope of trend to label as your third wave. Same concept whether its bearish bars printing or bullish bars. The highest volume shown is actually part of the retracement, albeit in one of the actionary waves (moving with trend), alot of buying happened at the termination of the wave C of the zig zag shown in green. Perfect scenario to rake in buy orders from retail then dump on them to finish out the WXY pattern. This is just 2 of the many scenarios in which you can find help from the volume oscillator to give you a directional bias in Elliott Waves. Happy Trading
Gold Price Outlook – Bulls in Control👋Hello everyone, let’s take a look at OANDA:XAUUSD today!
Over the past week, gold has moved steadily upward, holding above the psychological 3,600 USD zone. At present, the bulls remain in control, keeping price action around 3,645 USD.
Gold continues to benefit from a weaker USD following recent economic data. Rising unemployment claims and expectations that the Fed will maintain a dovish stance have provided strong support for gold to stay above 3,600 USD.
From a technical perspective, the precious metal is extending its rally toward key Fibonacci expansion targets. The 2.618 extension is being tested, with potential to push higher toward the 3.618 level. This aligns with the Elliott Wave structure, where wave (3) is near completion, likely followed by a brief correction into wave (4), before a breakout into wave (5).
The next psychological targets are 3,700 and 3,800 in the medium term. The main trend remains bullish, with critical support resting at 3,550 – 3,600 USD. As long as gold holds above this zone, the strategy of buying on dips to capture wave (5) remains valid.
What do you think about gold’s outlook? Share your thoughts in the comments!
Good luck!

HBARUSDT → Correction before the rally...After strong growth from the 0.14 zone, BINANCE:HBARUSDT HBAR updated its maximum to 0.30 and entered a correction phase, testing the intermediate and strong support level of 0.2300. A false breakdown has formed, and price consolidation above the key zone could trigger another rally.
HBAR currently has two key levels: 0.243 and 0.2337. The bulls are trying to keep the correction at the upper support level. However, there is a huge pool of liquidity hidden behind 0.2337, which could be tested (before growth resumes) if 0.243 fails to hold the price.
Locally, the coin is breaking the structure of the downward correction (consolidation in a bull market) and is trying to consolidate above support (in the zone of interest). The end of the current correction phase may lead to a resumption of distribution.
Support levels: 0.2432, 0.2337
Resistance levels: 0.2547, 0.26, 0.2763
The formation of a bullish structure relative to 0.2432 will confirm the presence of an interested, large buyer. This could trigger strong growth. Otherwise, I will wait for a retest of 0.2337, from where I will look for an opportunity to open long positions with the aim of medium-term growth.
Best regards, R. Linda!

Gold Pullback Toward 3,630 as Uptrend Remains IntactHey Traders, in tomorrow's trading session we are monitoring XAUUSD (Gold) for a buying opportunity around the 3,630 zone. Gold is trading in an uptrend, with price currently correcting toward this key support/resistance level.
Structure: The broader bias remains bullish, but price is retracing after recent highs.
Key level in focus: 3,630 — a significant zone where buyers may look to rejoin the prevailing trend.
Fundamentals: A softer U.S. Dollar and steady demand for safe-haven assets continue to support the case for Gold strength on dips.
Trade safe,
Joe.

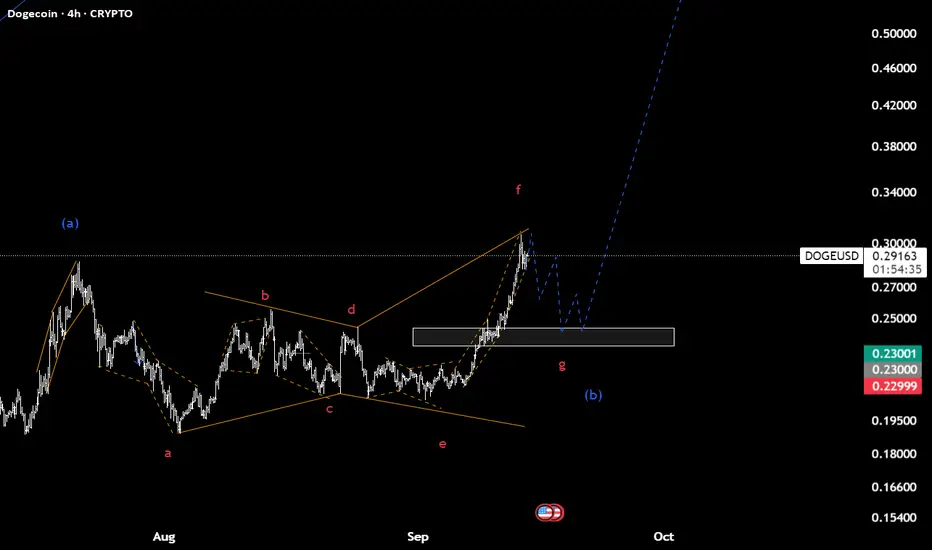
Doge(based on NEo wave)wave (b) is at the end and last chance to buy in low price.
I think a heavy bullish wave is coming and you can see targets on cycle analysis which I reply on that.
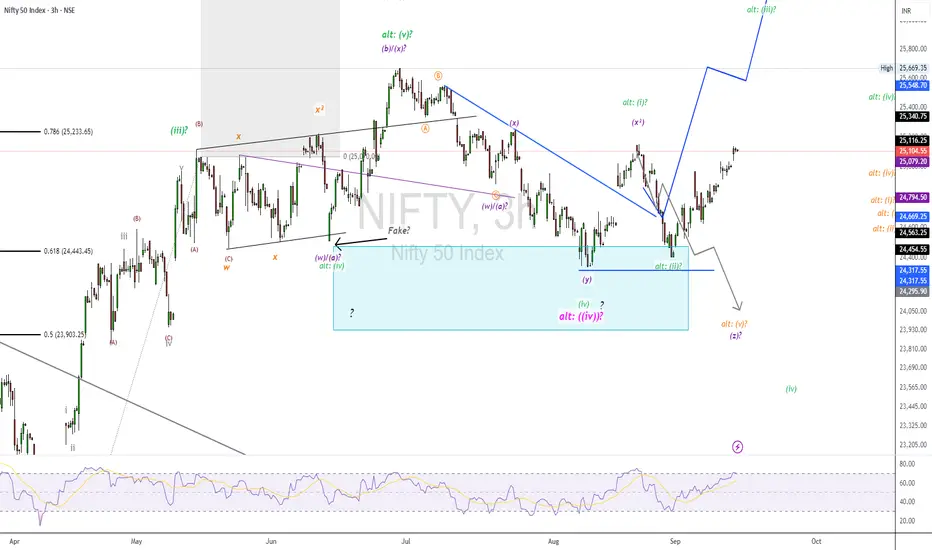
NIFTY50.....Boring times!Hello Traders,
nothing new to report! The structure of the waves are not clear and remain in contrast impulse vs correction!
We see overlapping structures at the waves, what makes it
difficult to interpret.
Chart analysis:
As labeled at the chart, we have the alternate view between a waves (i) and (ii), green as an impulsive move, or the corrective move within a waves a-b-c→z-wave! Note the similarity between the waves x and x².
A continuation of the advance comes only into play above 25378.35 on a closing basis.
Anything below this level, makes it more unlikely that a new impulse is underway.
'Cause of the non-event this week, that's it for today. Probably an update will be written if something important occurs!
Have a great week.....
Ruebennase
Please ask or comment as appropriate.
Trade on this analysis at your own risk.
ETHUSDT → Correction and hunt for liquidity ahead of growth BINANCE:ETHUSD is showing positive dynamics and breaking through the resistance conglomerate (consolidation boundary and downward correction line). The fundamental background is positive, and bulls are generally quite confident...
The cryptocurrency market, Bitcoin, and altcoins are awaiting a batch of positive news. Traders are waiting for interest rates to fall, which could attract additional capital to the cryptocurrency market, especially ETH.
The breakout of the correction resistance and consolidation resistance gives the market hope for growth. The global trend is bullish, and the fundamental background is positive. If the bulls hold their defense above 4488-4450, ETH may strengthen.
Resistance levels: 4661, 4783
Support levels: 4488, 4450
Technically, I expect a false breakdown of support (retest of the liquidity zone). If this maneuver ends with the price closing above 4488 and the formation of a confirming bullish pattern, then in this case, we can consider the continuation of growth.
Sincerely, R. Linda!

GOLD → Consolidation before continuing growth to 3700 FX:XAUUSD resumed its growth on Friday, approaching the $3,650 level, amid growing expectations of aggressive Fed rate cuts and geopolitical risks. The metal remains near record highs and is poised for a fourth consecutive week of gains.
Key drivers: Probability of a 25 bp rate cut on September 17 — 92%, chance of a 50 bp cut — 8%. Markets are expecting three cuts in 2024. US plans to impose new tariffs on India and China are supporting demand for safe havens.
Gold remains in a bullish trend. The weak US economy and geopolitics are pushing it to new highs, but profit-taking at current levels is possible.
There is no news today, so trading may be relatively calm.
Technically, if the price does not retest 3738 but begins to consolidate near 3657 and attempts a breakout, the chances of continued growth will increase.
Support levels: 3638, 3630
Resistance levels: 3649, 3657
I expect the market to reach the liquidity zone of 3638 before returning to retest the trigger. However, if MM deems this maneuver unnecessary and forms a trading range between 3657 and 3649, then closing above 3657 could lead to another bullish distribution.
Sincerely, R. Linda!

XAUUSD_15MGold Analysis
Short Time
Elliott Wave Analysis Style The market is forming the ABC correction wave and the path of completion of this wave is to the 3630 range. And to continue the path of the main wave, the rise or fall will be determined at the number 3630!
Ask us for gold market gold signals

Pfizer’s Next Big Shot: COVID Levels Back on the Table?Huge Crisis or Groundbreaking Discovery?
This scenario suggests that once the running flat correction is completed — which we are very close to — the price is set to explode by at least 300% in the coming years (see red box).
Why do I think so?
• The running correction is approaching its final target zone, meaning the price should soon stop, reverse, and start pumping.
• After the correction phase comes the impulse, and we are expecting Wave 3 — the most volatile and dynamic wave of all.
• Minimum target: $108
It’s only a matter of sooner or later.


AUDUSD – Wave Analysis OutlookAUDUSD continues to unfold within a broad corrective structure, and current price action leaves room for two key scenarios.
Primary View (Blue W–X–Y):
The recent swings suggest the pair is developing a W–X–Y corrective pattern in blue. If this count holds, price could extend higher toward the 0.6750 – 0.6800 region, which aligns with Fibonacci projections where the correction may eventually complete before the broader downtrend resumes.
Alternative View (Expanding Triangle in Wave X):
Another possibility is that wave X is evolving into an expanding triangle. In this case, price may continue to alternate in wider swings (A–B–C–D–E) before breaking out into the next leg. The triangle invalidation level sits at 0.6417—a break below this would negate the structure and open the door for further downside.
👉 For now, I’ll be watching for buy setups if price consolidates at current levels, targeting the higher Fibonacci zones (0.6750–0.6800).
⚠️ Disclaimer: This outlook is based on my personal wave analysis and shared for educational purposes only. It is not financial advice.

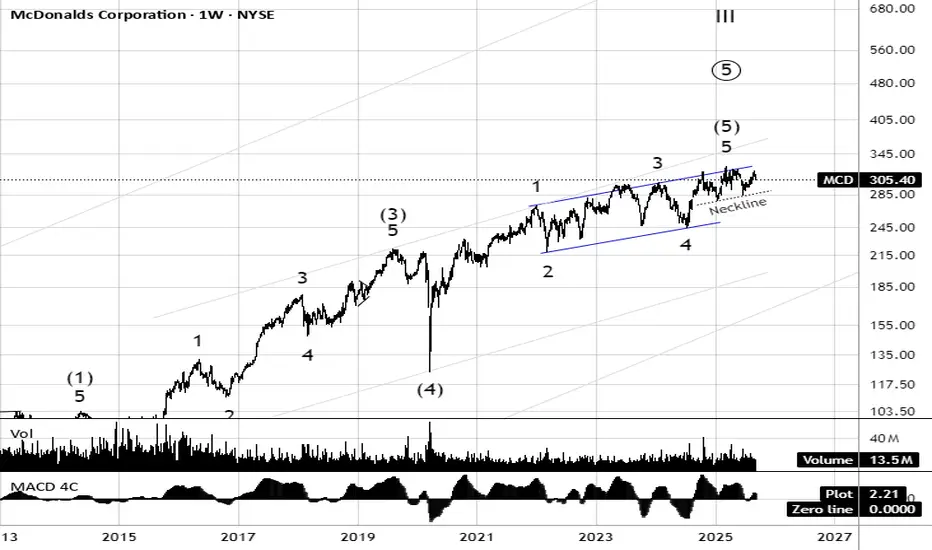
MCD produces ending diagonal to terminate 2020 advanceMcDonald’s (MCD) appears to be in the late stages of a long-term Elliott Wave advance, with the final 5th (5) wave nearing exhaustion inside a rising wedge pattern. Momentum divergences and the neckline support around $285 highlight growing risk of a breakdown. If the wedge fails, a corrective phase could unfold, targeting the 210–240 region where prior 4th wave support lies. Until then, upside is capped near $330–340, making the risk-reward skewed toward caution at current levels.
Upmove for Bitcoin is almost finishedHi traders,
Last week Bitcoin continued the corrective upmove exactly as I've said in my previous outlook.
Now we could see the corrective upmove continue to the orange B area. And after that it could go down again.
Let's see what the market does and react.
Trade idea: This is not the right time to trade Bitcoin.
If you want to learn more about trading FVG's with wave analysis, please make sure to follow me.
This shared post is only my point of view on what could be the next move in this pair based on my analysis.
Don't be emotional, just trade your plan!
Eduwave

Correction down for goldHi traders,
Last week gold went exactly as I've said in my previous outlook. After a small correction down it went up again. Then it started a bigger correction down (orange wave 4).
Next week we could see some more downside to finish the correction, but after that this pair could go up again.
Let's see what price does and react.
Trade idea: Wait for the correction down to finish and the next impulsive wave up. After a small correction down on a lower timeframe and a change in orderflow to bullish you could trade longs again.
If you want to learn more about trading FVG's & liquidity sweeps with wave analysis, please make sure to follow me.
This shared post is only my point of view on what could be the next move in this pair based on my technical analysis.
Don't be emotional, just trade your plan!
Eduwave

SPX500USD could go higherHi traders,
Last week SPX500USD played out exactly as predicted in my previous outlook. Right at the open it started the upmove and it continued the whole week making a new ATH.
Next week we could see this pair going up some more.
Let's see what the market does and react.
Trade idea: Wait for a small pullback and a change in orderflow to bullish on a lower timeframe to trade longs.
If you want to learn more about trading FVG's & liquidity sweeps with Wave analysis, then please make sure to follow me.
This shared post is only my point of view on what could be the next move in this pair based on my technical analysis.
Don't be emotional, just trade your plan!
Eduwave

EU is slowly going upHi traders,
Last week EU went up a little and then corrected down.
After that it went up again. This pair is very slow going up to finish (red) wave 5. It looks like it forms a Diagonal or wave 4 (red) becomes a Triangle.
So next week we could see price slowly going higher to the bearish Weekly FVG above.
Let's see what the market does and react.
Trade idea: Wait for the finish of a correction down and a change in orderflow to bullish on a lower time frame to trade longs.
If you want to learn more about trading with FVG's, liquidity sweeps and Wave analysis, then make sure to follow me.
This shared post is only my point of view on what could be the next move in this pair based on my technical analysis.
Don't be emotional, just trade your plan!
Eduwave

USD/CAD - Forecast 13/9🕰 Weekly
Price has been holding inside a swing range with support around 1.36 – 1.37 and resistance higher near 1.46. Structure hints at a bigger bullish leg if buyers step in.
📅 Daily
Market is pressing against a descending trendline and sitting in a parallel channel. Demand is building around 1.37 – 1.38, while upside targets point toward 1.41 – 1.42 if broken.
⏱ 8H
Price recently swept liquidity below (BSL) and is now coiling under resistance. If we hold 1.37 support, the path opens for a push into 1.40 – 1.41.
🎯 Outlook
Bullish Case: Hold above 1.37 → breakout toward 1.40 – 1.42.
Bearish Case: Lose 1.37 → deeper correction back toward 1.35 demand.
⚖️ Bias : Short-term consolidation → mid-term bullish toward 1.40+.
Thanks traders and like and follow if you agree
