(Alchemy) Gold Punches More All-Time HighsGold continues its march higher.
There appears to be a triangle formation from April 2025 to July 2025 labeled A-B-C-D-E.
We know from our Elliott wave studies that triangles appear at certain places within the larger wave count. Triangles, in most situations, are the 2nd to last wave of the sequence.
In the case for gold, this implies the rally is the final wave of a larger bullish sequence.
There are a cluster of wave relationships appearing near $3,680 . This might provide the end to a wave 3. Once those 5-waves count off to the upside, the risk of another bearish or sideways pattern increases.
Elliott Wave

Buy opportunity - ADA weekly update Sep 3 - 9thCardano is currently still in a corrective phase, forming Primary Wave 2. Within this structure, ADA is building Wave Y of a Double Three formation, before eventually transitioning into an impulsive Primary Wave 3. These targets are supported by liquidity clusters highlighted on the heatmap: significant liquidity can be seen both at the upper boundary of the Fibonacci retracement zone and at the lower boundary. Once these clusters are cleared, I expect the path toward Wave 3 to open up.
The order book reveals heavy concentrations of orders around the high of Primary Wave 1, though I believe this is not sufficient momentum on its own to launch the next impulsive phase. Derivative data is mostly stable, with slightly below-average readings but a modest increase in open interest, reflecting the potential buildup for an upward move.
The completion of Wave Y could extend into late September or early October, particularly as seasonality has historically shown Ethereum (the leader among altcoins) tends to underperform in September. On the other hand, one could argue that capital may rotate into other altcoins during this period, potentially sparking moves outside ETH.
For now, I prefer to remain on the sidelines until clearer signals emerge.

Zoom out - DOT weekly analysis Sep 3 - 9thAfter a period of very active trading, where I made profits but ultimately lost much more, I have decided to return to swing trading, as you can likely tell from the timeframe of this analysis. Accordingly, my analyses will now be structured with a broader outlook.
Polkadot is currently in an Intermediate 1–2 setup, which itself forms part of Primary Wave 3. My primary expectation is for an impulsive move toward the $5 level. However, this may prove challenging given seasonality effects, as September has historically tended to produce losses rather than gains.
From the order book perspective, we see several clusters of orders positioned above the current price, which is initially bullish. The liquidity heatmap, however, shows significant liquidity both above and below us, raising the possibility that the current move upward could merely be a liquidity grab before another downward leg.
Derivative data does not currently suggest an over-leveraged market or excessive greed or fear. Funding rates are holding steady at normal levels, and open interest is stagnant to slightly rising.
In summary, I remain long on DOT and expect an impulsive rally to follow soon.

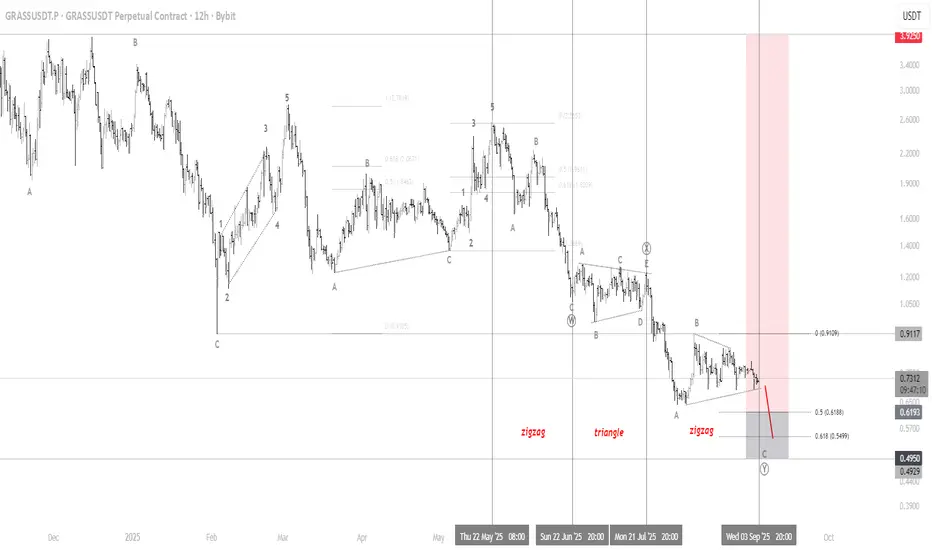
GRASSUSDTfollowing the wave correction
double zigzag of zigzag / triangle / zigzag
set up to entry @ fib retracement of 0.5 / 618
waiting to tap the posible level
thank you!!!
EURUSD BULLISH MOVE Market touched the demand zone and bounced up toward the supply zone.
This shows a clear reaction of buyers stepping in at demand and sellers waiting at supply. Watching how price behaves at these levels helps in identifying potential reversals or continuations.

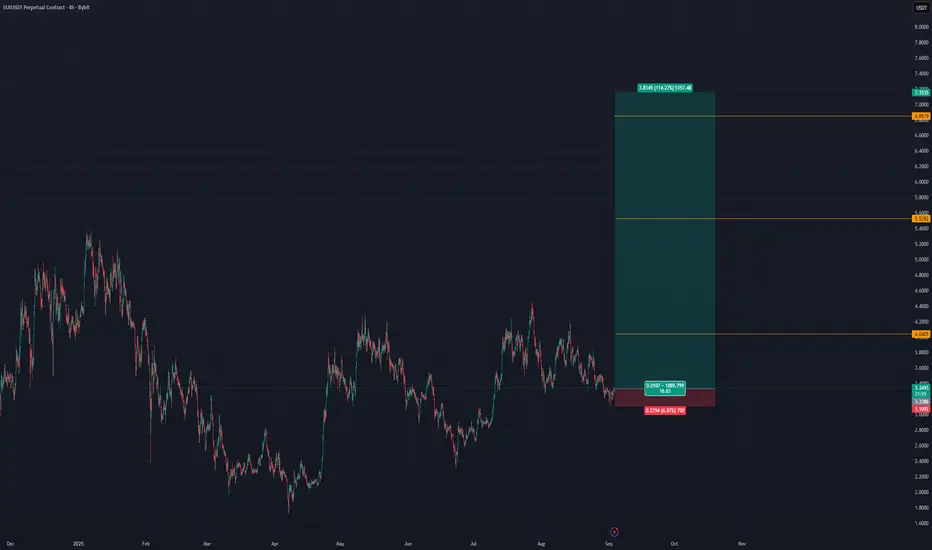
SUI Trading IdeeTrade Setup (Long Scenario)
Pair: SUI/USDT (Perpetual Contract)
Timeframe: 4H
Entry
Long entry around 3.34 USDT (after confirmation from the green demand zone).
Stop-Loss
Below box bottom: 2.9507 USDT
Risk: ≈ 6.87%
Targets
TP1: 4.0457 USDT
TP2: 5.5227 USDT
TP3: 6.8536 USDT
Risk/Reward
Potential upside: up to +114%
R:R ratio: very favorable (approx. 15:1 at TP3).
Notes
The red box shows previous supply/short zone (already tested).
The green box indicates current demand/accumulation zone (long setup).
Trend shift expected after retest and breakout from local resistance.
Best approach: scale out at each TP (partial profits at TP1, TP2, and final runner at TP3).
GOLD → Consolidation in the ATH zone. Risk zone...FX:XAUUSD hit a new all-time high of around $3,550 as investors worldwide rushed to safe-haven assets. As prices rise, the risk of profit-taking increases, especially with news coming up...
The key driver is the crisis in the bond market: long-term government bond yields are rising sharply in the UK and Japan. This is boosting demand for gold as a safe haven. We should also not forget about expectations of Fed easing: weak employment data could increase bets on a rate cut in September.
However, strong US employment data (starting with JOLTS today) could support the USD and limit gold's growth.
Correction: Record levels could trigger profit-taking, especially given that the price has come a long way since the last pullback, rising nearly 6% (7 days of growth).
Key factor: US labor market data (JOLTS today, NFP on Friday). Weak figures will strengthen gold, strong ones may cause a correction.
Resistance levels: 3546, 3550, 3575
Support levels: 3526, 3508, 3500
Technically, a retest of resistance at 3342-2246 could lead to a breakout and further growth. However, since the price has stopped updating its highs locally, I do not rule out the possibility of a retest of support at 3529-3526 before further growth. However, a weak reaction to support could lead to the formation of a pre-breakdown base, and a breakdown of support could trigger a decline to 3500.
Best regards, R. Linda!

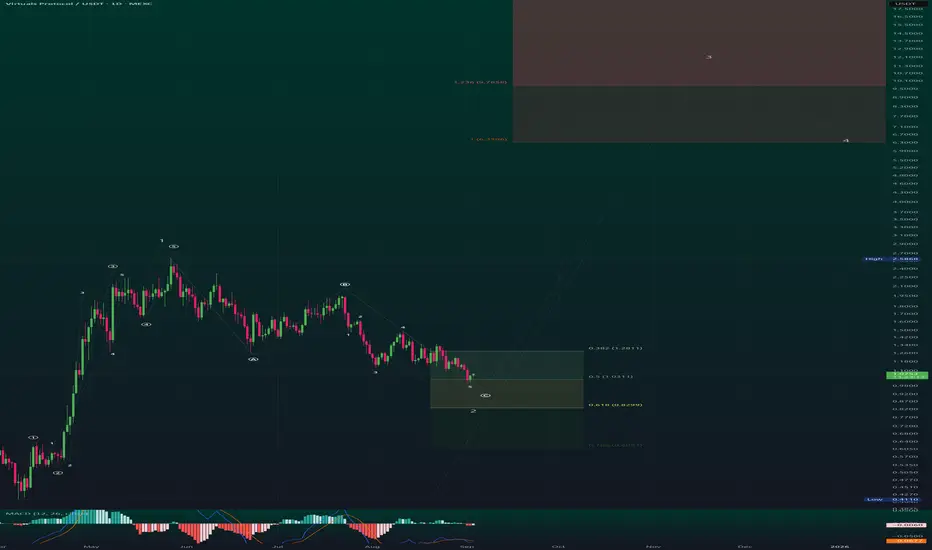
VIRTUAL/USDT — Elliott Wave + Fibonacci Roadmap (1D)
# Virtuals Protocol / USDT (MEXC) — Daily
## Bullish divergence at Wave ⑤ of C into the 0.5–0.786 pocket → building a 1–2 base for upside (targets 6.33 / 9.79 / 19.80)
**Timeframe:** 1D | **Exchange:** MEXC
### Summary
* Daily **A–B–C** correction looks **complete/near-complete**: sub-wave **C** subdivides into **5 down** with price making a **lower low** while momentum makes a **higher low** → **bullish divergence** between **③ and ⑤** at the bottom.
* Price is testing the **retracement box**: **0.5 ≈ 1.0311**, **0.618 ≈ 0.8299**, **0.786 ≈ 0.6093**.
* Base case: this area finalizes **Wave 2** → next is **impulsive Wave 3** up if lows hold.
* **Macro extensions from the chart:** **1.000 = 6.3306**, **1.236 = 9.7859**, **1.618 = 19.8044**.
* **Cycle invalidation:** take out the labeled **Low 0.4110** → 1–2 thesis off.
### Why I’m bullish here
1. **Structure:** Clear **5-down into C** with the **⑤ tag at the low** inside your yellow box → textbook terminal action for a corrective wave.
2. **Momentum:** MACD/oscillator prints **higher low** while price makes a marginal **lower low** from sub-wave **③ → ⑤** → **bullish divergence** right at support.
3. **Location:** Reversal attempt begins **inside the 0.5–0.786 retrace band** (≈ **1.0311 → 0.6093**), the classic **Wave-2** completion zone.
### Trade Plan (scenarios)
**A) Aggressive long (DCA in the pocket)**
* **Zone:** Accumulate across **0.618–0.786 (0.8299–0.6093)** if retested/swept.
* **Risk:** Hard **invalidation below 0.4110** (structural low on the chart).
* **Management:** First relief target back into **0.5–0.382** (**1.0311 → 1.2811**) to pay yourself, then let runners ride.
**B) Conservative confirmation**
* Wait for a **clean 5-up from the low and a shallow 3-down** that holds **above 0.618 (0.8299)**. If it prints, that’s your **1–2** trigger for **Wave 3**.
### Targets
* Step-ups: **1.000 = 6.3306** → **1.236 = 9.7859** → **1.618 = 19.8044** (macro objectives once a daily uptrend is confirmed).
* Near-term reaction levels on the way: **0.382 = 1.2811**, **0.5 = 1.0311**.
### Invalidation & risk
* **Lose 0.4110** with acceptance → **cycle invalid**; stand aside and reassess.
* **Risk per trade ≤ 1–2%**. Place the stop first, size second. If volatility widens, reduce size — don’t expand risk.
---
**Disclosure**
Educational analysis only; **not financial advice**. Crypto is highly volatile. **Risk per trade ≤1–2%**.
Kossan. Where is its demand / base / stop? 16 / August/ 22Kossan previous major demand / base / stop was created on 29/ Dec / 2014 weekly bar as shown on chart.

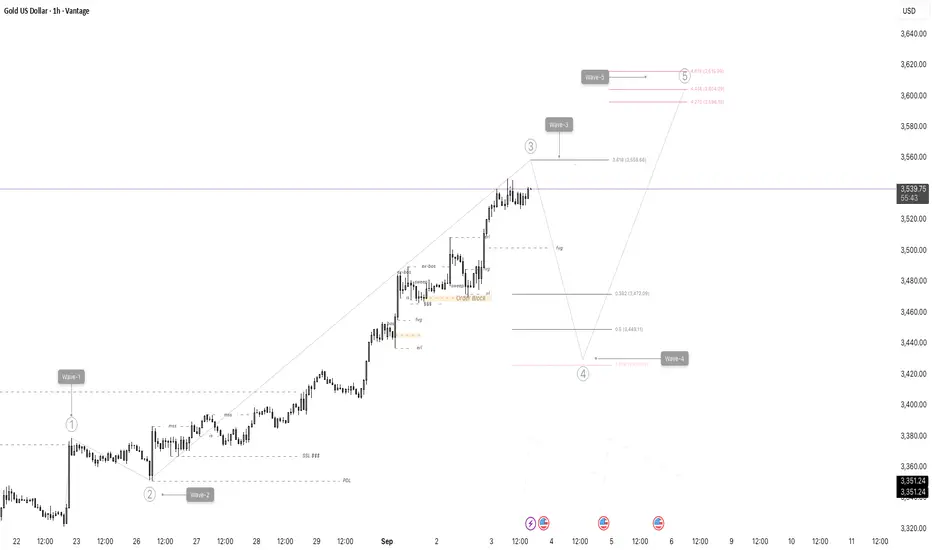
Trading Plan for Gold USD Using Elliott Wave and Fibonacci This trading plan combines Elliott Wave analysis with Fibonacci retracement and extension levels, focusing on key psychological points to guide entry, exit, and risk management decisions for the Gold/USD 1-hour chart.
Fibonacci Levels & Psychological Zones:
Wave 3 is approaching a Fibonacci extension zone near 3,558 - 3,616 (from 3.618 to 4.618 levels). This acts as a key resistance and potential Wave 3 target.
The retracement for Wave 4 correction is expected to land within the important Fibonacci retracement zones:
- 38.2% (~3,472)
- 50% (~3,449)
- 61.8% (~3,426)
These Fibonacci levels serve as psychological support zones where Wave 4 could end and Wave 5 might begin.
GBPNZD → Retest 2.276 before resuming the bullish trend FX:GBPNZD is testing a key support level as part of a correction after breaking through consolidation resistance. The trend is bullish, and liquidity capture could resume the upward movement.
GBPNZD is testing a strong support level within the uptrend during the correction phase. Against the backdrop of the long-term decline of the NZD, the currency pair has every chance of continuing to grow.
On the daily timeframe, we have a fairly strong upward structure, with the previously broken consolidation resistance and the 0.5f area playing a key role. This tandem hides a liquidity area that could become a driver for the market. A false breakdown of 2.276 could trigger a resumption of growth.
Support levels: 2.276, 2.2682
Resistance levels: 2.2983, 2.3215
The bullish trend may support the main trend. The current correction is a healthy movement within an uptrend that may continue after a pullback and consolidation.
Best regards, R. Linda!

Nikkei 225 Short: Going for Wave 3 of 3In this video, I go through the Elliott Waves for Nikkei 225 and study the sub-wave 2 of 3 as an irregular correction and why that supports a strong wave 3 down.

USDJPY Short: End of Triple Combination and ABC CorrectionOver in this video, I explained my previous mistake where I thought that we have completed a double combination but turns out to be a triple combination.
I talked about how the end of Wave Z was very near to the red trendline and that the move down yesterday was actually a wave 1 down and the 3-wave move up is actually an A-B-C that almost fulfill the A=C measurement (missing by 1 pip).
This idea is a positional play which I recommend doing slightly bigger size (anchor position + extra size) such that the anchor position will not be closed out until the very big picture is done but we can scalp the "extra size" along the way.
However, please take note to manage your risk well. The stop for this idea is 148.96 but if this is breached, I will look for another reversal signal and short and proceed with this idea because I do believe in the big picture set up.
Thank you and Good Luck!

ETHEREUM WILL MAKE NEW ALL TIME HIGHS AND THEN !!! DOOMSDAY !!ETH looks primed for new ATH now that late longs have been wiped off. There is considerable fear in the market but not fear enough ! ETH is about to explode with rest of the ALTS ! make you money while you can and then run for the hills my dudes. This will be epic !
Disclaimer: Not financial advice.

Palantir UpdatePLTR made a new local low today but swiftly recovered after. I could be one degree off, and price could have intentions of making another move below the (b) wave $149.37. At this time, I still believe the minor A wave is in fact complete, however, we still don't have confirmation. If price can move above $164.18, I will call that the confirmation needed to verify we are in fact within wave B.
We still have positive divergence in the micro charts. This suggests pressure should push us higher to the target box. That is of course assuming this will maintain a standard target. It is a B wave though if my count is correct. This should give you a heads up that the pattern will quite possibly become very complex.
Unless price moves below $142.35, my primary analysis points to the target box above.

Boom or bust - LINK weekly update Sep 2 - 8thChainlink is currently trading at critical levels, especially with regard to anticipated price targets. At present, the market appears to be completing a deep Minor Wave 2, which would place us just before the start of a dynamic upward move — a Wave 3 across multiple cycle degrees. However, it is important not to trade the future but to assess and respond to what is happening right now. Fetch.ai, for example, failed to hold its structure and broke lower, resulting in a corrective formation. Given the correlations with other altcoins that are also correcting, we must approach the current setup with the highest level of caution. A break below the red-dashed line marking the low of Wave 1 would invalidate the bullish count, turning the structure corrective and resetting us into Intermediate Wave 2 instead. For now, only 1H timeframe indicators are signaling a potential breakout, which is not strong enough evidence to confirm a sustainable move.
At the highlighted Fibonacci extension level, however, a large cluster of orders is sitting, which could act as a buy wall and provide the foundation for a potential breakout. The liquidity heatmap remains relatively empty, with little liquidity both above and below, keeping the picture neutral.
Derivative data shows funding rates in the normal positive range, while open interest has stagnated with a slight downward bias — a subtle short signal in itself.
In summary, I will closely monitor the current situation and consider positioning on the long side if conditions confirm.

A good buy opportunity - SOL weekly update Sep 2 - 8thSolana is currently forming a 1–2 setup at the Minute degree, which marks the beginning of Minor Wave 3, itself part of Intermediate Wave 3. Once this correction concludes, the probability is high that SOL will advance strongly toward the $250 level. From a technical perspective, the current structure leaves little room for credible alternatives. However, it is possible that the Nano Wave b could extend further upward, as illustrated by the dashed arrows.
Looking at liquidity, the order book below current levels appears relatively thin, with only small clusters around $190 and $180. While there are more orders at $180, giving that level stronger attraction potential, the liquidation heatmap shows virtually no liquidity there. For this reason, I do not expect a drop that deep.
Derivative data currently reflects bearish sentiment, with funding rates declining and open interest stagnating or falling.
Overall, I remain short positioned, targeting the 1.0 extension level of Wave c at $190, which is also where my take-profit is set. Until then, the plan is to stay patient and wait for the setup to play out.

EURGBP Steps Into A New Intraday Five-Wave Bullish ImpulseEURGBP has been moving in line with expectations over the past couple of weeks. After completing a projected higher-degree abc correction in wave B, it now appears that EURGBP has entered a new intraday five-wave bullish impulse, which could drive the price back toward the July highs.
Yesterday, we identified a lower-degree abc pullback in wave (ii). Since then, the pair has been trading nicely higher within wave (iii) of “iii.” This suggests further upside potential, though traders should remain cautious of a possible subwave (iv) pullback before the move continues.

EURUSD | TRADING PLAN | DAY 28🔵 Demand Zone (Buyers’ Area):
1.1623 – 1.1580
Price has completed an ABC corrective structure and is now entering the demand zone.
Expectation: Buyers to step in and push the price higher.
🔴 Supply Zones (Targets):
1. 1.1658 – 1.1688 → First supply zone, ideal for partial profit-taking.
2. 1.1705 – 1.1720 → Major supply zone, where strong sellers may re-enter.
📌 Trade Idea:
Look for bullish confirmation (reversal candle / liquidity sweep) inside the demand zone.
Entry: 1.1625 – 1.1600 (within demand zone).
Stop Loss: Below 1.1573 (protected low).
Take Profit 1: 1.1658
Take Profit 2: 1.1688 – 1.1720
⚖️ Risk–Reward Ratio (RRR):
Approx. 1:3 to 1:4 depending on entry execution.
---
✅ This plan is valid as long as price holds above 1.1573.
📌 Discipline with SL & partial profits is key.

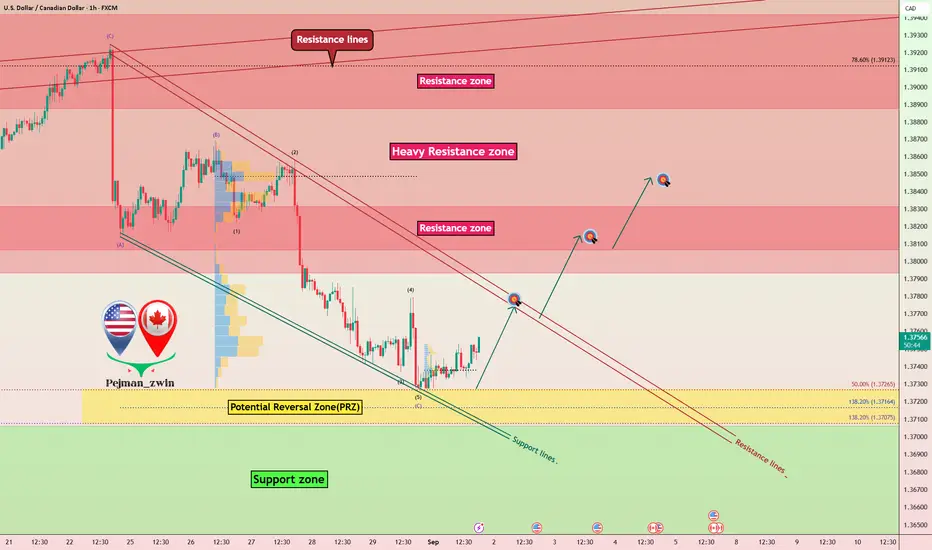
USDCAD Long Setup: From PRZ to Resistance LinesToday, I want to review the USDCAD ( OANDA:USDCAD ) long position with you.
USDCAD has reacted well to Support lines and the Potential Reversal Zone(PRZ)(1.373 CAD-1.370 CAD) .
From the perspective of Elliott wave theory , it seems that USDCAD has completed the microwave 5 of the main wave C .
I expect USDCAD to rise to the Resistance lines in the short term.
Second Target: 1.3817 CAD
Stop Loss(SL): 1.3698 CAD
Please respect each other's ideas and express them politely if you agree or disagree.
U.S. Dollar/Canadian Dollar Analyze (USDCAD), 1-hour time frame.
Be sure to follow the updated ideas.
Do not forget to put a Stop loss for your positions (For every position you want to open).
Please follow your strategy and updates; this is just my Idea, and I will gladly see your ideas in this post.
Please do not forget the ✅' like '✅ button 🙏😊 & Share it with your friends; thanks, and Trade safe.
GOLD → False breakout at 3500. What next? 3400 or 3600?FX:XAUUSD updates its ATH on the spot market to 3508.5 and forms a false breakout, provoking liquidation and profit-taking. The imbalance in the market is changing, and a deeper correction is possible...
Gold updated its historical maximum above $3500, but faced a correction amid a short-term strengthening of the dollar. The market's attention is focused on the US ISM Manufacturing PMI data, which may determine further dynamics.
Key drivers: The probability of a rate cut in September is estimated at 90%, which supports gold. Pressure on the USD continues due to concerns about the independence of the Fed (pressure from Trump) and geopolitics. The escalation of the Russia-Ukraine conflict (new strikes by the Armed Forces of Ukraine on Russian territory) is increasing demand for defensive assets.
Ahead of the ISM Manufacturing PMI: Forecast — growth to 49 (but remains in the contraction zone). If the data turns out to be weaker, it will strengthen dollar sales and push gold to new records.
Resistance levels: 3485, 3500
Support levels: 3467.6, 3441, 3423
Technically, gold may enter a longer consolidation or correction. If the bears keep the price below 3490-3485, then in the short term, we can expect a decline to the specified support zones. I do not rule out the possibility of a retest of 3500-3505, but at the moment I do not see the potential for the market to continue growing (in the short term!).
Best regards, R. Linda!

Gold Dips to 3,440:Dollar Weakness Sets Stage for the Next SurgeHey Traders, in today's trading session we are monitoring XAUUSD for a buying opportunity around the 3,440 zone. Gold is trading in an uptrend, with price currently correcting toward this key support/resistance level.
Structure: The broader bias remains bullish, but price is pulling back after recent highs.
Key level in focus: 3,440 — an important area where buyers may look to step in and resume the trend.
Fundamentals: The U.S. Dollar Index (DXY) is approaching 98.400 resistance while maintaining a bearish tone. A weaker dollar continues to provide support for Gold, reinforcing the bullish context.
Trade safe,
Joe.

WLFIUSDT → Liquidation of hamsters before the rally to 0.3300BINANCE:WLFIUSDT.P is Trump's project. This relatively new coin is demonstrating aggressive and manipulative trading, but there are key areas on the chart that can be used as a guide...
We all know about the manipulative games of Trump's projects ;) and this can be used in trading... The WLFI coin has growth potential, but we need to wait for confirmation. Technically, this is a rather aggressive and manipulative game. A sharp drop and liquidation of all “hamsters” to the 0.25 - 0.20 zone. However, the price has stopped updating lows, volatility is decreasing (consolidation). If the price returns to the range, there will be potential for growth. At the moment, the price is not allowed to fall, consolidation is forming, with resistance at the 0.2521 trigger. The market is testing this trigger... At the same time, Bitcoin is strengthening and may support altcoins...
Resistance levels: 0.2521
Support levels: 0.2250, 0.2042
Technically, if the local structure does not break down and the price continues to storm 0.2520 - 0.255, this could lead to a return of the price to the trading range, which would open up the possibility of growth to 0.33.
The structure will break if the price breaks through the support level of 0.225 - 0.22.
Best regards, R. Linda!
