Ethereum Elliott Wave Analysis: The Bull Trap Before Wave C!As mentioned in my previous two analyses, Ethereum rejected the $4,740 high and dropped to the $4,050 support zone, where it bounced exactly as projected.
From an Elliott Wave perspective, ETH has already completed a 5-wave impulsive structure and is now inside a corrective ABC phase. At the moment, price action is developing within wave B. Historically, wave B has the tendency to break above the top of wave ⑤, creating a bull trap and sweeping liquidity before the real wave C sell-off begins.
📉 What does this mean for traders?
Wave C is usually sharp, aggressive, and offers great risk-to-reward opportunities on the short side. But instead of rushing into shorts, the smart play is to wait for confirmation.
🎯 Trading Strategy:
1. Allow wave B to complete – watch for a liquidity grab above the $4,840–$4,800 zone.
2. Look for a CHoCH (Change of Character) / market structure break on lower timeframes (4H / 1H) as your entry trigger.
3. Enter short after confirmation, targeting the $4,100 → $3,800 zones first, with potential extension lower depending on momentum of wave C.
4. Place invalidation above the recent swing high to keep risk controlled.
⚡ This is a high-probability short setup forming, but patience and timing are crucial — don’t get trapped in wave B’s fake breakout.
👉 Follow for updates as we track the confirmation of wave C and refine the short targets!
Elliott Wave

fartcoin updateprice has reacted nicely from fib levels i mentioned earlier in my update it rose around 22% but still be very cautious
it may go down as of now the move towards upside is still 3 wave move that can easily retrace back if btc dom moves higher

XAUUSD – Watching 3,310 as Price Pulls BackHey Traders, in today's trading session we are monitoring XAUUSD for a buying opportunity around 3,310 zone, Gold (XAUUSD) has been moving lower after its recent swing high, with price now correcting toward the 3,310 area.
Structure: The broader bias has been bullish overall, but recent price action shows a corrective move.
Key level in focus: 3,310 — previously acted as support/resistance.
Next move: Holding above this zone could maintain the medium-term bullish bias, while a clear break below may open the way for deeper retracement.
Monitoring how price behaves around 3,310 to understand whether buyers will step in or if weakness continues.
Trade safe, Joe.

EURUSD Testing 1.16650 in Descending Channel as DXY Holds 98.100Hey Traders, in today's trading session we are monitoring EURUSD for a selling opportunity around 1.16650 zone, EURUSD continues to trade inside a descending channel, with price correcting upward toward 1.16650, a key resistance zone aligned with channel structure.
At the same time, the U.S. Dollar Index (DXY) remains in an uptrend and is approaching 98.100 support. With recent inflation readings running high, markets may expect a more hawkish Federal Reserve, which could support further USD strength.
Monitoring how EURUSD reacts near 1.16650 in relation to DXY’s price behavior to gauge whether bearish momentum will resume or consolidation will continue.
Trade safe, Joe.

ETH - 4H Elliott Wave Analysis - 22.08.25Greetings ^^
We did get our rally from the support area that we had on the chart.
We assume that high of the 14th of August formed the top of the white Wave 3 and that we are currently in a correction displayed as yellow ABC which would form the white Wave 4.
The support area of this Wave 4 is between the 0.236 FIB at 4059 USD and the 0.5 FIB at 3370 USD. The Wave A is in and today's rally is the B Wave which we thermalized in yesterdays analysis and did expect it to be strong. We assume this ABC is an expanding flat which means the B Wave overshoots which it did. It touched the 1.05 FIB at 4833 USD which is a common target but it also is right below the ATH. Further targets for the B Wave would be the 1.236 FIB at 4985 USD and the 1.382 FIB at 5105 USD.
Next we would look for a Wave C to the downside.
The targets for this C Wave are the 0.618 FIB at 4375 USD the 1 to 1 FIB at 4106 USD, the 1.236 FIB at 3947 USD, the 1.382 FIB at 3853 USD and the 1.618 FIB at 3705 USD. A lot of targets, the most common is the 0.618 and the 1.618 FIB. The 1.618 FIB would also be in confluence with the 0.382 FIB of the Wave 4 support area which is the optimal target for a Wave 4.
Alternatively you can count the recent low as blue Wave 4 instead yellow A Wave and the move up today could potentially be the blue Wave 5 which would than finished white Wave 3. We do think the count mentioned above is more likely as the yellow A touched the 0.236 FIB of the white Wave 4 support area which is a common target for an A Wave and additionally the structure of today's rally look more corrective on the smaller timeframes. Overall it does not make a big difference for the moment except that in the blue Wave 5 we could go a bit higher compared to the overshooting B Wave.
Thanks for reading.
NO FINANCIAL ADVICE.

ETHUSD goes up today but...ETHUSD went up due to Powell's speech this morning, but i would go with the bigger picture, the weekly chart showed A-B-C correction up is done, also the strong movement failed to break previous top, so i could be determined as correction or consolidation.

DOW JONES INDEX completed its 5 WAVES UP, what's next?Powell's speech this morning boosted the market up and creating a new high.
BUT.. It also completed the last impluse wave, wave 5.
Next movement, whether to be a correction or a massive trend reversal shoud be DOWN.
So i am SHORTING now.. A-B-C correction is going to happen anytime soon!
My expectation is 1-2 weeks ahead is correction time.
LET'S GO!

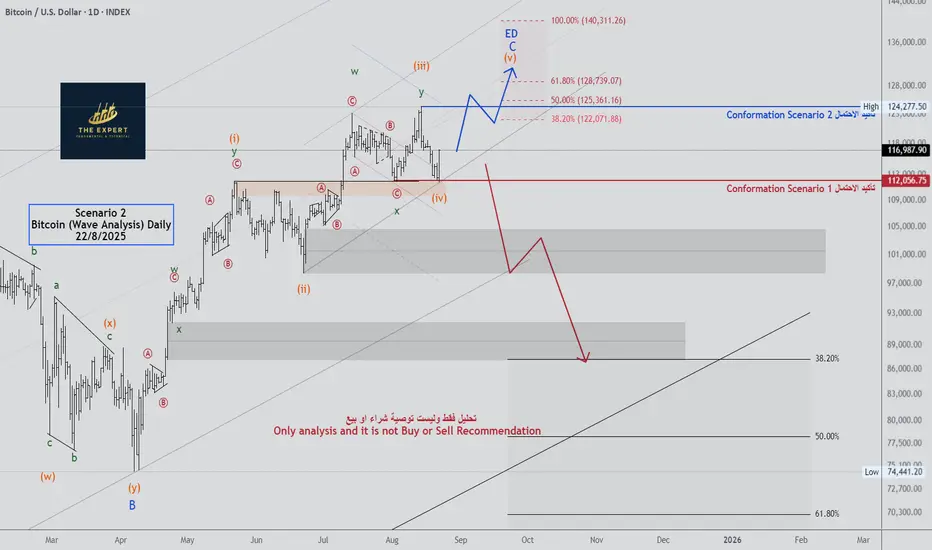
Bitcoin (Wave Analysis) Daily - Update 22/8/2025Bitcoin (Wave Analysis) Daily - Update 22/8/2025
See the chart
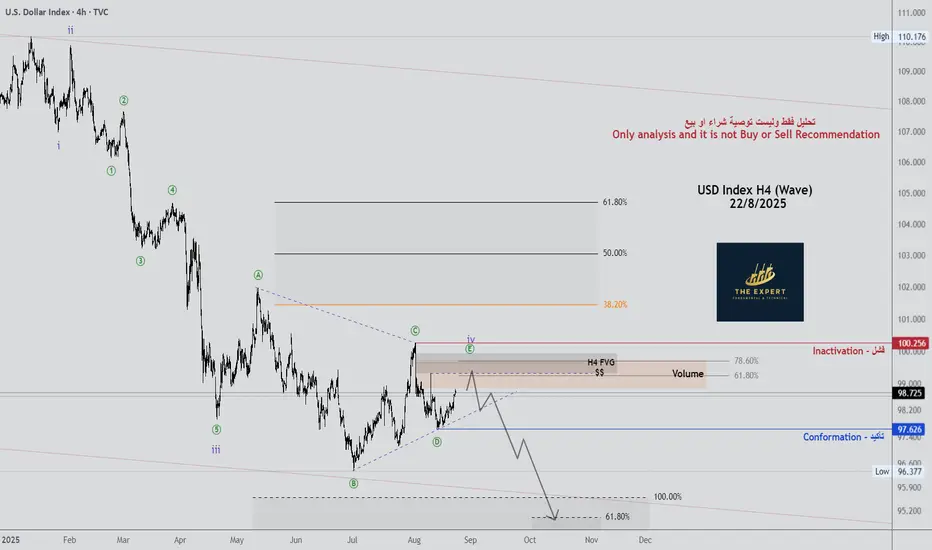
USD Index H4 (Wave) - Update 22/8/2025 (Scenario 2)USD Index H4 (Wave) - Update 22/8/2025 (Scenario 2)
See the chart

GBPUSD: Elliott Wave and H&S Pattern Is Pointing Higher Cable made a strong rebound from the 1.3135 support, suggesting the market could be bottoming, possibly completing an ABC, zigzag pattern. So, with the current break above the channel resistance line in an impulsive fashion into wave A/1, we should watch for more upside, at least in three waves, up to 1.37 area or higher.
At the moment we can see some retracement from 1.36 resistance, ideally its wave B/2 that can retrace the price back to 1.34 support area before a continuation higher within wave C or 3.
H&S pattern is also something we have to consider here; the bullish path.
GH

ATH coming for LINK?!LINK has been in existence since the 2017 cycle and is also part of the OG cryptos. I expect to see a new ATH as LINK rises in dominance especially during the 'utility' alt coin run with stable coins and oracles being a key narrative for Chainlink.
LINK.D is currently at c. 0.45% of the total crypto market. I expect this to surge to 1.5-2% of the crypto market when LINK is to top out in its cycle. Moonshots would be anything above 2%.
Key Targets for Take Profits:
1. $67-80
2. $110-128
3. $195-210 (Moonshot)

DOGE to make a new ATH?!This is what we call 'crypto heritage'. Doge being one of the OG cryptos from 2013 is poised to make a new ATH this cycle. Doge is not just a meme coin, but a coin that also has utility.
Based on current trajectory, DOGE targets for potential Take Profits for the final wave 5:
Target 1: $0.90-$1.35
Target 2: $1.50-$2
Target 3: $2.80-$3.3 (moonshot)
Keep an eye out on X Payments and ELON to see DOGE fly higher.

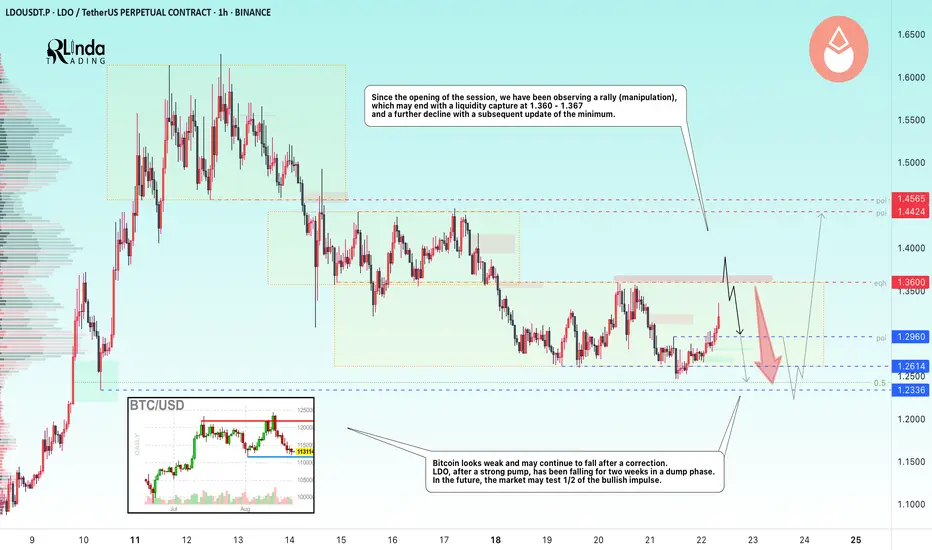
LDOUSDT → Hunting for liquidity ahead of a declineBINANCE:LDOUSDT.P , having failed to reach the zone of interest 1.250 - 1.233, has entered a phase of local rally or manipulation before a possible decline aimed at consolidating potential before long-term growth.
Bitcoin looks weak and, after a correction, may continue to fall to the coveted target of 112 - 110K. After a strong pump, LDO has been falling for two weeks in a dump phase. In the long term, the market may test 1/2 of the bullish momentum and the strong support level of 1.179 before resuming the pump to 1.62 - 1.97.
Since the opening of the session, we have been observing manipulation, the goal of which is most likely the liquidity zone of 1.36 - 1.36. The situation may end with a liquidity grab, a false breakout, and a further decline with a subsequent update of the low.
Resistance levels: 1.36, 1.37, 1.44
Support levels: 1.296, 1.2614, 1.2336
Technically, the price is still consolidating and intrarange trading is likely to continue. A false breakout of resistance could trigger a decline, in which case 1.26 - 1.23 could be considered a target, while a false break of 1.17 - 1.23 could trigger a global rise.
Best regards, R. Linda!
USDJPY Short: Stop above 148.82As depicted in the chart, I believed that we have completed a double combination with the last up wave as a 5-waves WXYXZ structure. The stop loss for this is above the Z wave high (>148.82).
Good luck!

AUDUSD Tests 0.64400 as DXY Strengthens on Fed BetsHey Traders, in today's trading session we are monitoring AUDUSD for a selling opportunity around 0.64400 zone, AUDUSD is correcting higher within its broader downtrend, with price approaching the 0.64400 resistance area. This zone aligns with prior supply and could be pivotal in determining whether bearish momentum resumes or a deeper retracement unfolds.
The U.S. Dollar Index (DXY) recently broke above the 98.700 key resistance, reinforcing its bullish bias. With U.S. inflation still elevated, markets are focused on potential hawkish commentary from the Federal Reserve at the Jackson Hole symposium — a factor that could further strengthen the dollar and weigh on AUDUSD.
Price action around 0.64400 will be critical in assessing whether sellers reassert control or the correction continues.
