fishing for the 3rd $ASST elliot waveAll recent up gaps have been filled. I like this setup when fishing for the bottom of an elliot correction wave, especially the 2nd wave. I am using the initial unusual volume candle around $0.90 as the bottom of a possible 3rd wave. But given the bounce after closing the final up gap, the 3rd wave could be in motion now. Not financial advice. Trade to be de-risked below $1.09. Trade invalidated and vacated below $0.90.
Elliott Wave

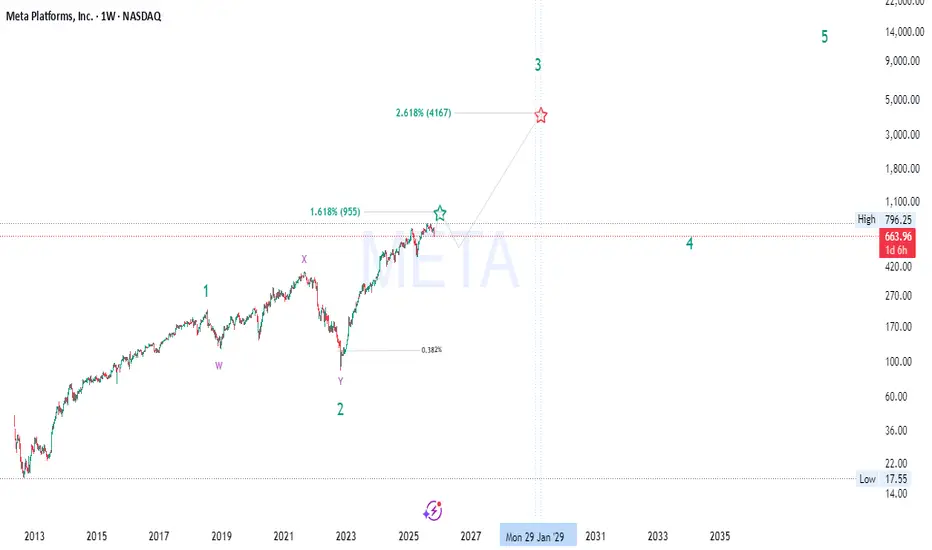
META’s Hidden Fibonacci Path to 4000+ — Don’t Miss Wave 3🚀 META Long-Term Elliott Wave + Smart Money Macro Outlook
🌊 Elliott Wave Structure (662→955→4000+)
META appears to be progressing through a major impulsive 5-wave supercycle on the weekly timeframe:
Wave 1: The initial breakout from accumulation (2015–2021), fueled by growth in advertising dominance and metaverse expansion narratives.
Wave 2: Deep corrective W–X–Y structure into the 2022 low around $90 — a classic multi-year liquidity sweep and re-accumulation phase.
Wave 3 (in progress): This is typically the strongest and most extended wave , with Fibonacci projections aligning near the 2.618 extension ≈ $4,160 , targeting 2028–2029 based on current momentum.
Wave 4: Expected to form a macro re-distribution or range between ~$900–$1,000 before the final parabolic Wave 5, likely extending toward $10K+ .
💡 Wave Confluence:
1.618 Fib extension of Wave 1 → Wave 3 aligns around $955 , acting as the first major resistance (and your current high zone).
2.618 Fib extension → next macro target $4,160 , confirming bullish impulsive momentum.
🧠 Smart Money Concepts (SMC)
The 2022–2023 bottom represents a “Displacement + Re-accumulation” phase , with institutions absorbing liquidity beneath previous demand zones.
Current price action (mid-2025) shows a premium range reaction , where smart money is likely taking partial profits before the next accumulation leg.
Expect a retracement into the 0.382–0.5 Fib zone ($420–$500) to rebalance inefficiencies before continuation toward macro Wave 3 targets.
Key Reaccumulation Zone: $420–$500 — watch for BOS (Break of Structure) confirmation and liquidity sweeps below equal lows.
🔍 Fibonacci Alignment
0.382 retrace marks ideal Wave 4 re-entry.
1.618 & 2.618 extensions align perfectly with the Wave 3 and 5 confluences — textbook impulsive expansion.
Each extension zone has been confirmed with prior liquidity sweeps and displacement candles, increasing Fibonacci reliability 📈.
📊 Market Structure & Price Action
META maintains a strong bullish market structure of Higher Highs (HH) and Higher Lows (HL) since 2023.
The recent 9% correction (-$69) is likely a short-term liquidity grab — not structural weakness.
As long as price holds above $420 , macro bullish market structure remains intact.
Volume profile shows heavy accumulation between $300–$450 , suggesting smart money is still positioned long-term bullish.
💰 Fundamental Confluence
META’s fundamentals are catching up with technicals:
Massive AI CapEx and ad recovery boosting EPS growth 📊
Metaverse burn rate shrinking , improving profitability
Share buybacks providing a floor for price corrections
Macro environment supports tech leadership rotation , and META remains a key beneficiary of the AI + social data synergy cycle 🔄
🔮 Market Cycle View
We’re entering the “Expansion Phase” of the broader innovation cycle.
2018–2022 = Accumulation/Disbelief
2023–2025 = Early Markup / Smart Money Entry
2025–2029 = Public Participation Phase (Wave 3) 💥
Post-2029 = Euphoria / Distribution (Wave 5) 😱
⚙️ Key Levels to Watch
Support Zones: $420 – $500 (Wave 4 re-entry)
Resistance Levels: $955 → $4,160 (Wave 3 targets)
Invalidation: Sustained break below $300 on weekly close
📈 Summary
META remains one of the strongest macro bullish charts in big tech — with perfect alignment across Elliott Wave, SMC, Fibonacci , and fundamental cycle theory .
We’re currently witnessing the mid-phase of Wave 3 , with institutional repositioning before the next vertical leg. Patience and precision around the reaccumulation zone ($420–$500) could provide the golden setup before the next expansion wave 🚀🌕
#META #ElliottWave #SmartMoneyConcepts #Fibonacci #Wave3 #BullMarket #AIStocks #TechnicalAnalysis #TradingView
NIFTY50.....Two lower low's to come?Hello Traders,
the NIFTY50 is in corrective setup.
The week's high so far was @ 26104. Look, how perfect this high hits the middle line of the Order-blog and rebounded that day! It declined to 25718, what was the 0.382 Fibo of the advance, and start a second try to make higher high's, but failed!
As a result of this failure, the price declined once more to 25877. This decline is not over yet!
I expect to fill the long shadows and the upper shadow of the candles from Oct. 17.+24. to filled with volume. If so to come, the market is probably strong enough to change direction. But is he?
For now, there is a „three-down” structure that is to count as a w-x-y move. But in wave 4, this is really not the structure I wait for. More interesting would be an a-b-c to complete wave 4 and a long shadow at the last 1–3 candles. This would mark an „absorption” of Smart-Money-Traders (i.e. Institutional investors)! After, market is ready to advance.
Well friends, we will see if so to come!
That's it for today!
Have a great week.....
Ruebennase
Please ask or comment as appropriate.
Trade on this analysis at your own risk.

NVIDIA At New HighsNvidia is making more upside this week, now trading above the 200 level on optimism that the US and China could reach a tariff deal. From an Elliott Wave perspective, the stock still appears to be in wave five, with an extended higher-degree black wave three now approaching its first resistance around the 38.2% projection. If risk-on sentiment continues, the price may even retest the upper side of the Elliott Wave channel near the 230 area. This suggests that Nvidia could be entering an important zone where the higher-degree black wave three might complete, followed later by a deeper fourth-wave retracement before more upside resumes. So, I would stay patient and watch for a possible dip toward the 164–185 area once wave four begins.
Highlights:
Trend: Ongoing uptrend; wave five still in progress
Potential: Reaching 230 resistance before wave four pullback
Support: 164–185 zone
Invalidation: Below 164
Note: Watch for signs of exhaustion near 230; next deep could offer new opportunity

Starbucks (SBUX) — Fibonacci Targets Ahead $340 → $1600☕ Starbucks (SBUX) — Riding the Wave 3 Expansion to New Highs 🚀
Starbucks (SBUX) — Wave 3 Expansion in Progress ☕ | Fibonacci Targets $340+ Before Wave 4 Correction 🚀
“Smart Money Brewing — Wave 3 Still in Play!” ☕📈
⚙️ Elliott Wave | 🧠 Smart Money Concept | 📊 Fundamentals | ⏳ Long-Term Cycle
🌍 Macro & Fundamental Outlook
Starbucks continues to dominate the global coffee market with unmatched brand power, digital innovation, and steady margin recovery.
While short-term volatility and inflation pressures exist, the company’s fundamentals remain strong — supported by global expansion , loyalty growth , and stable cash flows 🌱.
This aligns perfectly with the ongoing Wave 3 impulsive phase of the long-term Elliott Wave structure — a stage often marked by powerful institutional momentum and broad investor participation.
🌀 Elliott Wave Context
We’re currently in the macro Wave 3 of a multi-decade supercycle:
Wave (1): 1993–2007 — the foundation and expansion era ☝️
Wave (2): 2008 crisis correction 💧
Wave (3): Began in 2009 and still in progress 🚀
🔹 Internal subwaves suggest SBUX is in the late stages of Wave 3 , targeting the 2.618 Fibonacci extension (~$340–$350) before a macro correction (Wave 4).
🔹 Once Wave 3 completes, a broad Wave 4 retracement could revisit liquidity zones around $70–$85 , before Wave 5 propels the next long-term bull cycle.
📈 Price Action & Smart Money Confluence
Market Structure: Price is still forming higher highs and higher lows — confirming macro bullish continuation.
Smart Money Accumulation: Institutions appear to be reloading within the $80–$90 demand block , anticipating the next internal breakout.
Liquidity Targets: Above $110–$126 , a liquidity pocket and Fair Value Gap (FVG) remain open — a likely magnet for upcoming impulsive moves.
Premium–Discount Range: Current price sits in a discount zone relative to the internal wave, favoring long entries for continuation setups.
📊 Fibonacci Levels & Targets
Wave 3 Fibonacci Extensions:
1.618 → $210
2.0 → $270
2.618 → $340–$350 🟢 (Wave 3 target zone)
Projected Wave 4 Retracement:
0.382 → $130
0.5 → $90
0.618 → $70 (macro re-entry zone)
Wave 5 Supercycle Projection (2040–2045):
3.618 → $1,600–$1,700 💎
⏱️ Timeframe Outlook
Wave 3 Continuation: 2025–2029
Wave 4 Correction: 2029–2033
Wave 5 Expansion: 2033–2045
Wave 3 is historically the strongest and fastest phase in Elliott Wave structure — the “smart money phase” ⚡
🔔 Key Highlights
✅ Still within the impulsive Wave 3
✅ Institutional demand between $80–$90
✅ Structural target: $126 → $210 → $340
✅ Supercycle potential beyond $1,000 in Wave 5
✅ Long-term accumulation opportunity now
📢 Summary
Starbucks (SBUX) is in the heart of its macro Wave 3 expansion.
Strong fundamentals, healthy market structure, and Smart Money positioning align with Elliott Wave and Fibonacci confluence for a powerful bullish continuation. As accumulation deepens around $80–$90, the next leg toward $300+ could unfold before the next major cycle shift. ☕🚀
#SBUX #Starbucks #ElliottWave #SmartMoneyConcepts #WaveTheory #LongTermInvesting #StockMarket #GrowthStocks #Fibonacci #TechnicalAnalysis #MarketCycles #Bullish

GOLD → Price stuck in range after Fed speech FX:XAUUSD continues to battle for the $4,000 zone. The fundamental backdrop has a hint of unpredictability following the Fed's statement. Technically, the range of 3,915-4,015 is developing
Key factors: US shutdown (4th week): Weighs on the economy and the dollar, supporting gold as a safe haven. However, the Fed toughened its tone yesterday: It cut rates by 25 basis points, but Powell ruled out guarantees for a cut in December. Trump and Xi meeting: Agreements reached on soybeans and rare earths, reducing demand for defensive assets.
Gold balances between shutdown risks and monetary policy tightening. Growth is only possible if macro statistics deteriorate or geopolitics escalate.
Resistance levels: 4015 - 4050
Support levels: 3980 - 3960 - 3915
Gold may continue its correction from the 4015 - 4050 zone to 3950 - 3900 if the bulls are unable to keep the price within the upper range. However, if the market continues to buy the metal (there are no fundamental reasons for this yet) and the price closes above 4015, there may be a chance for growth to 4050 - 4085.
Best regards, R. Linda!

Wrap-up of Oct 29, 2025Wrap-up :
Nifty has completed its Wave C of internal Wave 2 @26097 i.e. 100% retracement of Simple Zig Zag (abc) Pattern.
What I’m Watching for Oct 30, 2025 🔍
I’ll be watching for the market to break 25987 which is 38% retracement of Wave C and sustain below atleast 15 min. for a target of 25863-25832.
Disclaimer: Sharing my personal market view — only for educational purpose not financial advice.

BCHUSDT → Consolidation ahead of news. Target 600?BINANCE:BCHUSDT.P is consolidating above key resistance. Consolidation is forming ahead of news. Are the bulls in play?
Bitcoin is consolidating, trading above key support at 111650. News ahead, a positive outcome could support the market, including altcoins...
As for BCHUSDT, the coin is breaking through the strong resistance zone of 549.15 as part of a bullish trend and is forming consolidation in the range of 549-570. A liquidity pool has formed below 549. There is a high probability of a long squeeze before growth.
Resistance levels: 570, 600, 612
Support levels: 549.15, 533, 511.25
The market is bullish, which is clearly visible on the D1 timeframe. After a strong rally, the coin is entering a consolidation phase, which is forming above the previously broken resistance. A retest of support could trigger growth in the direction of the trend.
Best regards, R. Linda!

Writing about Canadian National RailwaySome one asked me to write why I like CNI, also I don't like the other idea I wrote about the company, I felt like I could do a lot better. I am in the mood to write tonight and feel like this is a great time for me to explain why I like CNI. First and foremost, I like undervalued companies on a technical and fundamental level CNI is significantly undervalued at the time of this writing. As you can see by the technical analysis we are sitting at an area of support characterized by the trendline, and to reinforce the technical analysis I have measured a move using the Fibonacci retracement tool.
Talking about the fundamentals, I have calculated both the discounted cash flow, and the dividend discount models of intrinsic value. According to my calculations the price of the stock right now at $93 is undervalued based on the future revenues the company will be expected to generate. The dividend discount model also suggests undervaluation based on the expected dividend payments over the next 5 years. I always calculate a minimum of 5 years into the future. According to my calculations it is reasonable to assume the intrinsic value for CNI to be somewhere near the $115 mark. This leaves me a substantial margin of safety to buy shares at these levels.
Some more reasons I like the company goes beyond the actual price of the stock. One reason I like the company is because it is a very capital intensive business model with a wide economic moat. The massive investment for building tracks, bridges and tunnels creates an almost impossible barrier for new competitors to overcome. These high costs mean there are very few major railroads, often leaving each with a monopoly or duopoly in certain regions, which gives them pricing power.
When I was building my portfolio at first, I didn't really care about the environmental impact companies had on our planet, but eventually as I learned more it started to become important to me to invest in companies I think were good for the planet. Railroads are significantly more fuel-efficient than trucking, especially when hauling heavy goods long distances. This efficiency leads to lower greenhouse gas emissions, which benefits society as a whole.
The company is the largest rail network in Canada and the only North American railway connecting the Atlantic, Pacific, and Gulf Coasts, giving it a dominant position on the continent. Finally, Canadian National has consistently increased its dividend for 20 consecutive years and currently yields nearly 2.7%. Its relatively low payout ratio of 48% suggests its track record of payout increases will likely continue. I think CNI is a great company and I have been using the stock as a defensive/safe haven type of position in my portfolio.

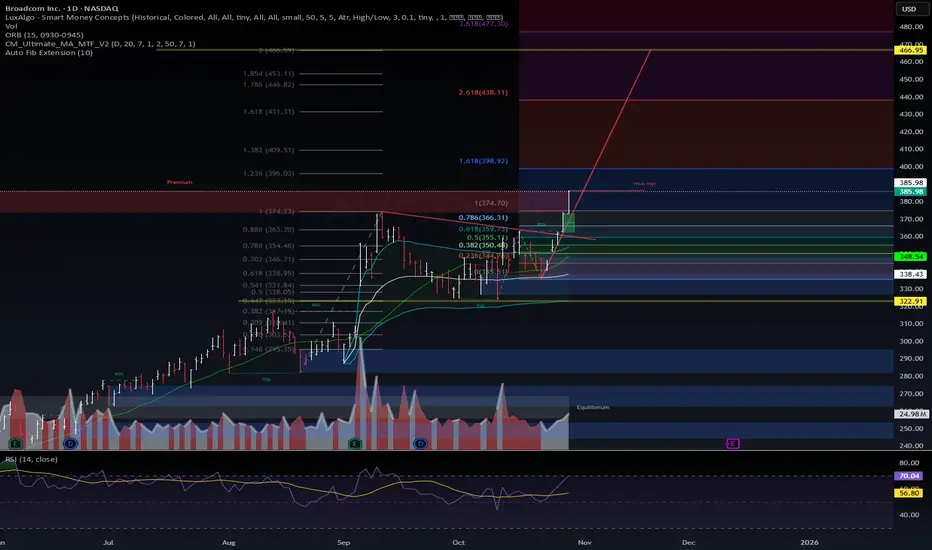
$AVGO | The Chip Vampire Awakes — Liquidity Reversal Complete🩸 NASDAQ:AVGO | The Chip Vampire Awakes — Liquidity Reversal Complete ⚡
Broadcom just reclaimed its premium zone and triggered a macro-level BOS — this is how AI liquidity resurrects after months of compression.
🧠 VolanX DSS Signal Matrix:
✅ BOS confirmed above $360 — smart money continuation detected.
🧩 Reversal block absorbed → liquidity reclaimed.
📊 RSI retesting 70 — energy curve resembles pre-expansion phase.
🩸 1.236–1.618 extension targets $396 → $431 → $466.
🎃 Macro Edge:
AI CapEx rotation isn’t slowing — it’s accelerating quietly.
Fiscal liquidity, semiconductor subsidies, and sovereign AI infrastructure are converging.
This isn’t just a stock; it’s the bloodline of the machine economy.
💡 VolanX Projection Path:
$396 → structural validation zone
$431 → institutional expansion
$466 → Vampiric Fibonacci extension target
📈 Probability Matrix (VolanX DSS):
Bull 70% | Range 20% | Pullback 10%
LRG guard confirms expansion mode.
🕯️ Liquidity never dies; it just changes its vessel — and right now, it’s flowing through silicon.
#AVGO #VolanXDSS #WaverVanir #AITrading #VampiricSetup #Liquidity #SmartMoneyConcepts #HalloweenSpecial #MarketStructure #MacroEdge #Semiconductors #TechStocks
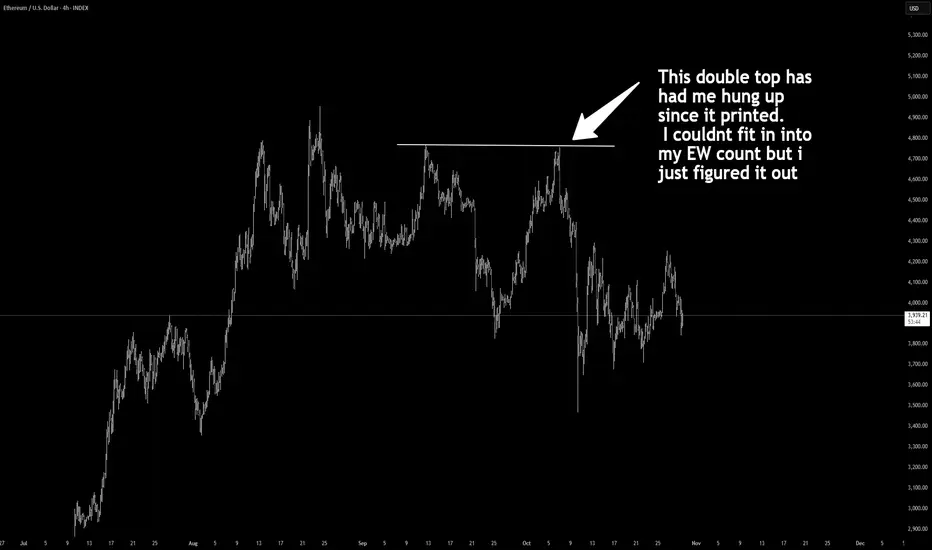
ETH Elliot Wave counts in notes. Everybody is wrong.Hear me out.
I’ve been thinking the price action would take that $3450 giant wick low low on ETH. I originally thought we were in an ABC correction and that we were going to go lower — but I couldn’t quite rectify this double top.
Triangles always get my attention because we know they only form in B waves, D waves, or 4th waves — which makes them a dead giveaway of a corrective pattern. but Barrier triangle really get my attention because they print as a cipher for a liquidity sweep for later. ITS SO OBVIOUS! Triangles ARE the cipher of Elliott Waves; they reveal where we are in the broader structure.
But here’s what changed my view: I no longer think we’re in a simple ABC. Looking at it again, I believe we actually formed a W–X–Y–X–Z, which is literally a barrier triangle.
If that’s the case, then I think we go up and take it — that double top. Whether that move takes us to a new all-time high, I’m not sure. But given how massively corrective this entire structure has been, I think it’s very possible.
read nots for details
New Impulse Wave Started, wave 3 run up? It looks like we are entering sub wave 1 of Wave 3 of the current impulsive wave.
Watch all of the usual fib extension
0.786 ~ $4025
1.00 ~ $4045
1.272 ~ $4071
1.618 ~ $4103
Good luck to all !

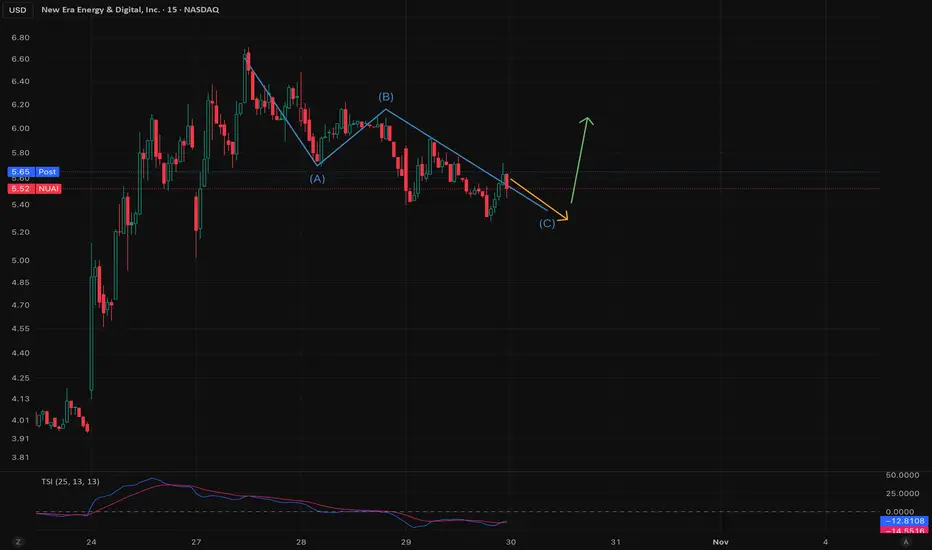
NUAI - Last leg of Wave C leftAs you know, NUAI is still in a corrective cycle. It's finishing up the last leg of wave C. After that comes an impulse wave to the upside.
In the chart, you can see the A, B, C. Wave C is always 5 subwaves down. The 5th subwave has not come in yet. Let's see what happens in the next few days.
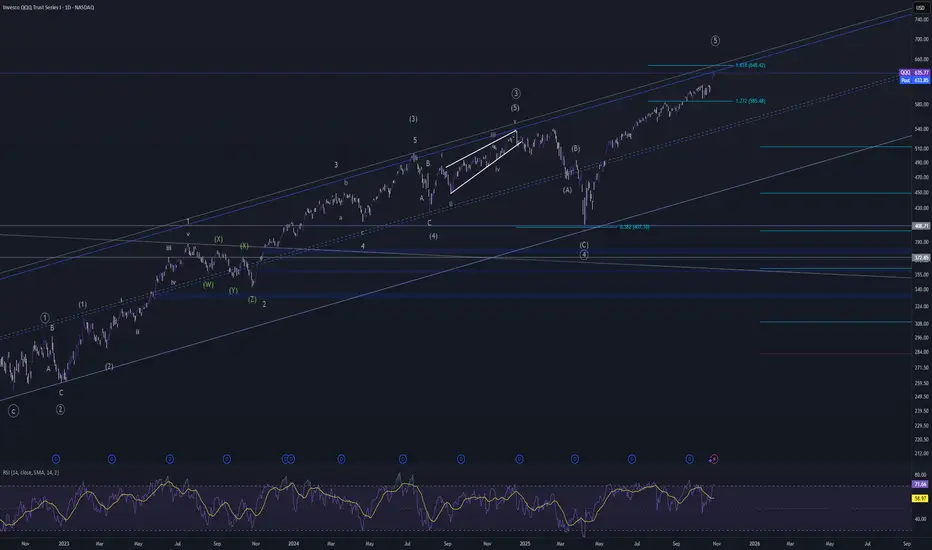
QQQ finally topping out?Getting near the top of the channel since 2022. The 161.8% extension of the drop down to April is right above today's high as well. Market is overbought with bearish divergence on the daily, weekly, and monthly. Maybe 1 more high???
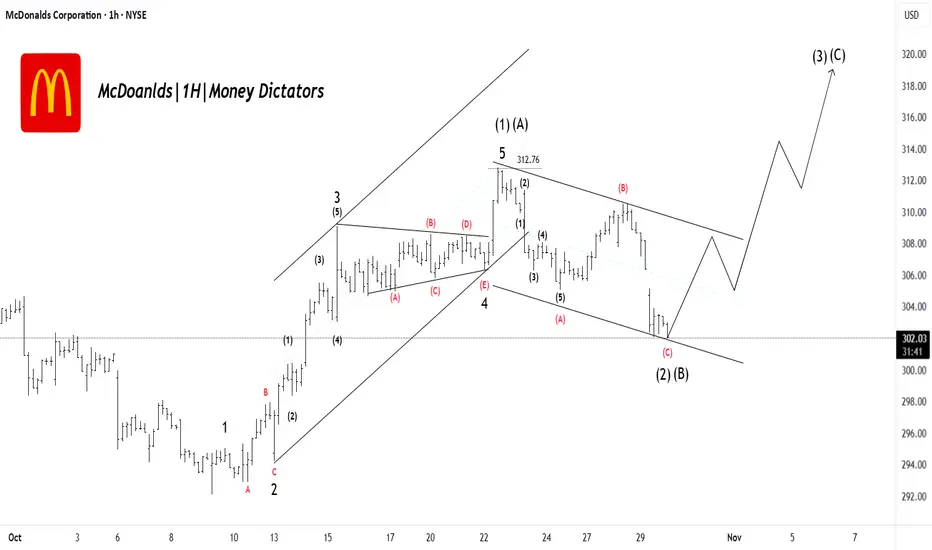
MCD Bulls Loading: Major Wave (3) Move ComingMcDonald’s has completed a clean 5-wave push to the upside, finishing Wave (1)/(A) near the recent high. After that, price entered a corrective channel forming an A-B-C pullback, which now looks close to completing as Wave (2)/(B). The drop is losing momentum near support, suggesting sellers are running out of strength. Once this correction finishes, the chart expects a sharp bullish move into Wave (3)/(C), targeting higher levels above recent highs. In simple terms: correction almost done → strong upside continuation likely.
Stay tuned!
@Money_Dictators
Thank you :)
GBP/USD Correction Almost Done: Bulls LoadingGBP/USD has already completed a big corrective structure from the previous high and is now moving inside a complex W-X-Y pattern. The current drop is forming the final C-wave of Wave Y, which suggests the bearish move is close to finishing. Price is likely to dip slightly lower near the support zone before finding buyers again. Once this final leg completes, the chart expects a strong bullish reversal to the upside. In simple terms, one more small drop to finish the correction, then GBP/USD should bounce and start a new uptrend.
Stay tuned!
@Money_Dictators
Thank you :)

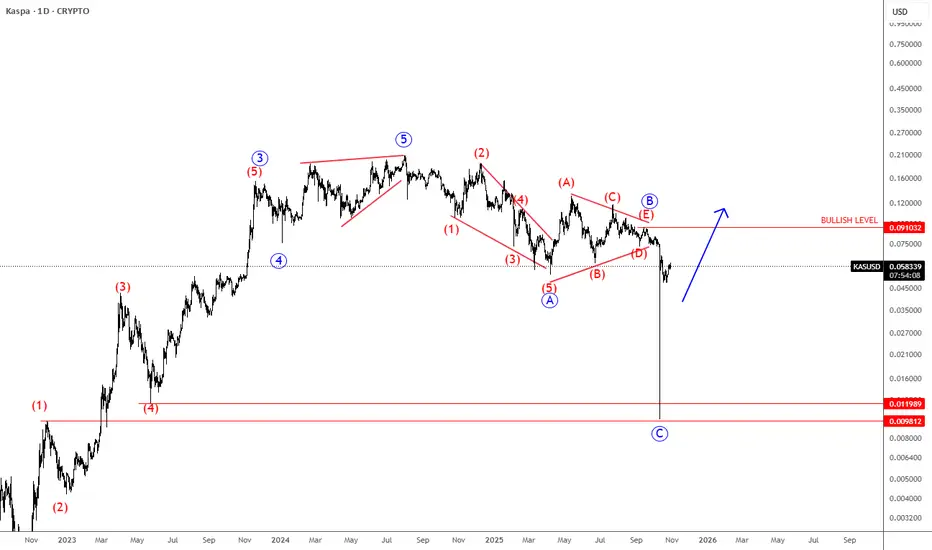
Kaspa Completes A Correction After A Huge SpikeKaspa Completes A Correction After A Huge Spike that can be supportive, as we see a corrective structure within the uptrend by Elliott wave theory.
Kaspa is a proof-of-work (PoW) cryptocurrency that uses the novel GHOSTDAG protocol (a block-DAG consensus rather than a single linear chain) to allow many blocks to be produced more rapidly and co-exist. It was launched without an ICO / pre-mine (fair launch) and positions itself as more scalable than many PoW chains. Because of this, it has attracted interest as a “next-gen PoW” or “fast chain” alternative.
Kaspa’s sell-off appears of a combination of leveraged long liquidations intensifying a move down, weak macro/altcoin sentiment and structural risks (adoption/supply concentration). Despite a massive price drop, sparking fear and pessimism across the market, such deep pullbacks often create opportunity rather than signal failure. Despite the volatility, Kaspa’s fundamentals remain solid. Its innovative GHOSTDAG technology, fair launch, and strong network activity continue to set it apart. When fear dominates and sentiment turns overly negative, it can actually be a supportive setup for long-term investors looking to accumulate quality projects at discounted levels.
From Elliott wave perspective, KASUSD(Kaspa) spiked down out of a wave B triangle pattern into wave C, so it’s a higher degree ABC correction. It still looks promising for the future, and we may still see some rally in the current bullish cycle. Bullish confirmation is above 0.091 area.
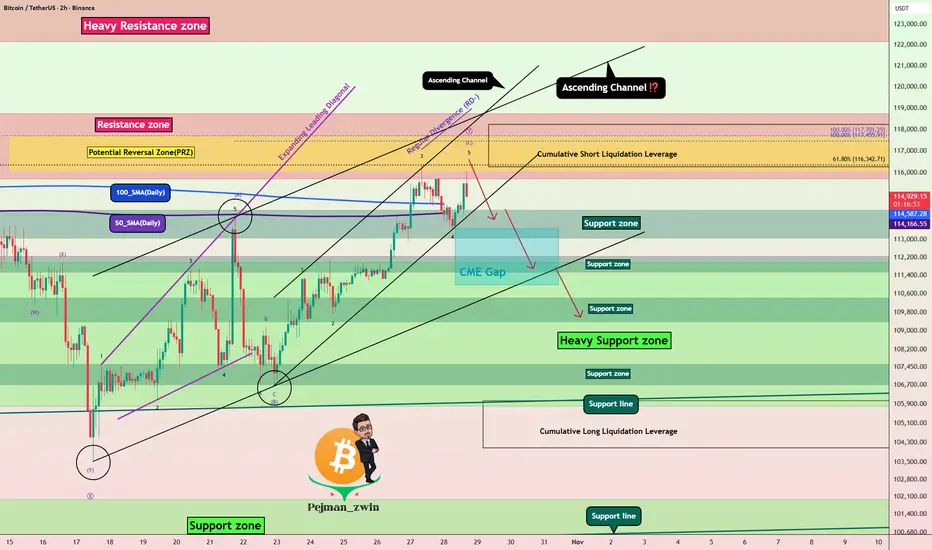
Bitcoin Hits PRZ – Time for a Correction?As I expected yesterday , Bitcoin ( BINANCE:BTCUSDT ) did drop down to the Support zone($114,300-$113,000) at the lower line of the ascending channel and then started rising again today. Both Long and Short positions basically hit their Targets .
At the moment, Bitcoin is moving near a Resistance zone($118,740-$115,740) , the Potential Reversal Zone(PRZ) , and Cumulative Short Liquidation Leverage($118,224-$116,281) .
From an Elliott Wave perspective , it seems like Bitcoin is completing the microwave 4 of the microwave C of the main wave Y . There's a noticeable Negative Regular Divergence(RD-) between the last two peaks, which suggests some weakening momentum .
I expect that Bitcoin won't break through the Resistance zone($118,740-$115,740) easily and may fall back at least to the Support zone($114,300-$113,000) . If it drops below the 100_SMA(Daily) and 50_SMA(Daily) , we could see a deeper decline and possibly the CME Gap($113,495-$110,990) being filled.
Note: Another point to mention is that although the SPX500( TVC:SPX ) has been hitting new all-time highs as the new week began, BTC has shown a bit less correlation with it in the last day. So if the S&P 500 undergoes a correction, Bitcoin might actually see a sharper pullback, which is something to watch out for as a potential negative factor for Bitcoin.
Note: Also, keep in mind that tomorrow, some important U.S. economic indices will be released, which could also influence the market. So definitely factor that into your considerations.
Note: In general, the crypto market in the past couple of weeks has been heavily influenced by news around U.S.-China tariffs. Any headline can cause Bitcoin and other tokens to swing up or down, so keep an eye on those geopolitical headlines.
Cumulative Long Liquidation Leverage: $106,033-$104,090
Please respect each other's ideas and express them politely if you agree or disagree.
Bitcoin Analysis (BTCUSDT), 2-hour time frame.
Be sure to follow the updated ideas.
Do not forget to put a Stop loss for your positions (For every position you want to open).
Please follow your strategy and updates; this is just my Idea, and I will gladly see your ideas in this post.
Please do not forget the ✅' like '✅ button 🙏😊 & Share it with your friends; thanks, and Trade safe.
XAU/USD – Triangle Breakdown Potential Toward 3,900 ZoneGold (XAU/USD) has been in a strong uptrend for the past few months, recently reaching new highs above US $4,300 before showing signs of slowing down. In your chart, the price has formed a triangle pattern (labelled A–B–C–D) after a sharp drop from the peak. This pattern usually means the market is taking a pause and preparing for the next move — either a breakout up or down. Based on the structure, momentum, and recent price behavior, the pattern looks more likely to break downward, which could send the price toward the support zone around US $3,900–3,950 (the blue area on your chart).
From a technical view, this makes sense because:
The strong rally lost strength after the sharp fall from the top.
The triangle is getting tighter, meaning volatility is compressing before a breakout.
Indicators like the RSI and Awesome Oscillator (AO) are showing bearish divergence, signaling weaker buying pressure.
If price breaks below US $4,100–4,050, it would confirm a bearish breakout and likely trigger a move to the support area marked in blue.
From a fundamental view, gold recently rallied due to expectations of Federal Reserve rate cuts, high inflation, and strong central bank demand. But in late October 2025, the market is cooling because the U.S. dollar has strengthened slightly and Treasury yields have bounced, causing short-term selling pressure on gold. Many traders are also taking profits after such a strong run.
Putting both sides together, the technical chart and the current fundamentals support a short-term bearish correction — a pullback that could test the US $3,900 zone before the next big move. However, if the price fails to break below the triangle and instead closes above US $4,180–4,250, it would cancel the bearish setup and signal a possible continuation of the uptrend toward new highs above US $4,350–4,400.
In short:
Bias: Short-term bearish correction
Breakdown trigger: Below US $4,050–4,100
Target zone: Around US $3,900
Invalidation: Above US $4,250

Gold Bullish Butterfly Forming – Reversal Ahead?As I expected in the previous idea , Gold started declining from the Resistance zone($4,192 – $4,137) and has now reached the Support zone($4,004 – $3,895) — full target achieved .
At the moment, Gold is moving within that Support zone($4,004 – $3,895) and Potential Reversal Zone(PRZ) .
Looking at the 1-hour time frame , we can spot a Bullish Butterfly Harmonic Pattern forming, which is likely to complete right in that PRZ .
I expect that in the coming hours, once Gold enters the PRZ , it could rise at least up to around $4,057(First Target) .
Second Target: $4,132
Stop Loss(SL): $3,889(Worst)
Please respect each other's ideas and express them politely if you agree or disagree.
Gold Analyze (XAUUSD), 1-hour time frame.
Be sure to follow the updated ideas.
Do not forget to put a Stop loss for your positions (For every position you want to open).
Please follow your strategy; this is just my idea, and I will gladly see your ideas in this post.
Please do not forget the ✅ ' like ' ✅ button 🙏😊 & Share it with your friends; thanks, and Trade safe.

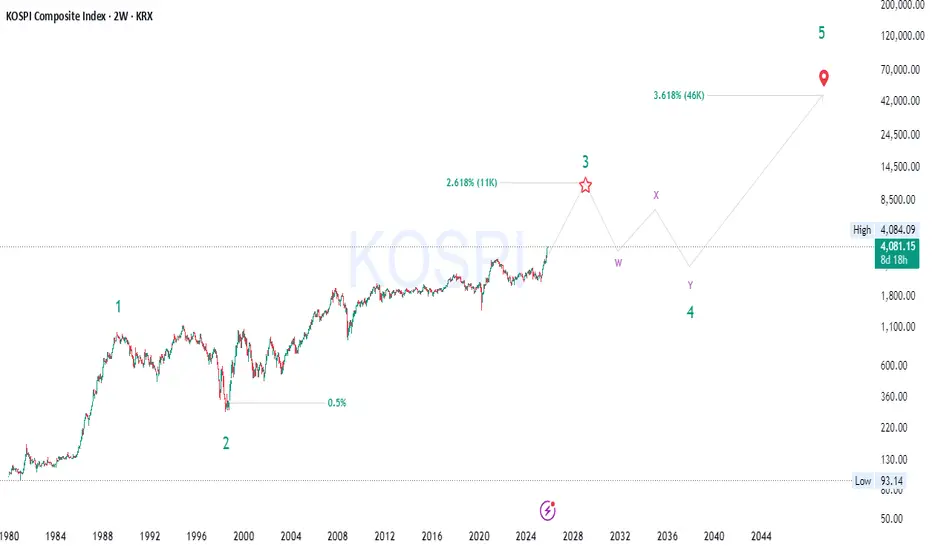
KOPSI 4K → 11K → 46K | The Wave Map Nobody’s Talking About🚀 KOSPI | Supercycle Loading… 🌊💥
⚡️ Data → Discipline → Destiny → KOSPI’s Next Chapter 📊
The KOSPI isn’t done yet — it’s just getting started.
We’re mid-flight in a macro Wave (3) aiming for that 2.618 Fib zone (~11K) before a clean reset into Wave 4 , then liftoff to the 3.618 extension (~46K) 😳
💎 Smart Money Accumulation:
Big players have been quietly loading — liquidity grabs, higher lows, and BOS after BOS 👀
This isn’t noise… it’s reaccumulation before expansion .
📈 Price Action + Market Structure:
Every dip is defended, demand zones respected, and momentum building — textbook continuation setup ⚡️
🌍 Fundamentals Align:
Tech strength, export growth, and AI expansion — the macro story finally matches the wave count 📊
🌀 The Supercycle Is Alive.
Those who see it early… ride it legendary.
#KOSPI #ElliottWave #SmartMoney #Fibonacci #MacroCycle #MarketStructure #TradingView
GBPUSD BullishAfter exiting a correction, the first impulse (Wave 1) appears. I expect a retracement of at least 50% of the Fibonacci.