BTC Elliot Cycle - SellI think Bitcoin’s supercycle has ended and its impulsive wave has completed all 5 waves. It should now complete the corrective wave 2 from the higher-degree wave before continuing its upward movement again.”
Elliott Wave

$FLOKI Prediction correct Yesterday I provided a CHART UPDATE for $FLOKI. It is currently REACHING TARGETS.

#Banknifty Directions and Levels for December 5: the higher time-frame structure is still showing a solid bullish bias. So if today’s market turns green, we can expect a minimum of the channel top (short-term target). On the other hand, if the market breaks the current swing bottom, we can expect 100% to 127% extension targets for a minor correction. If we call that structurally a flag pattern, AB=CD pattern, or a C wave, then the implications would align accordingly.
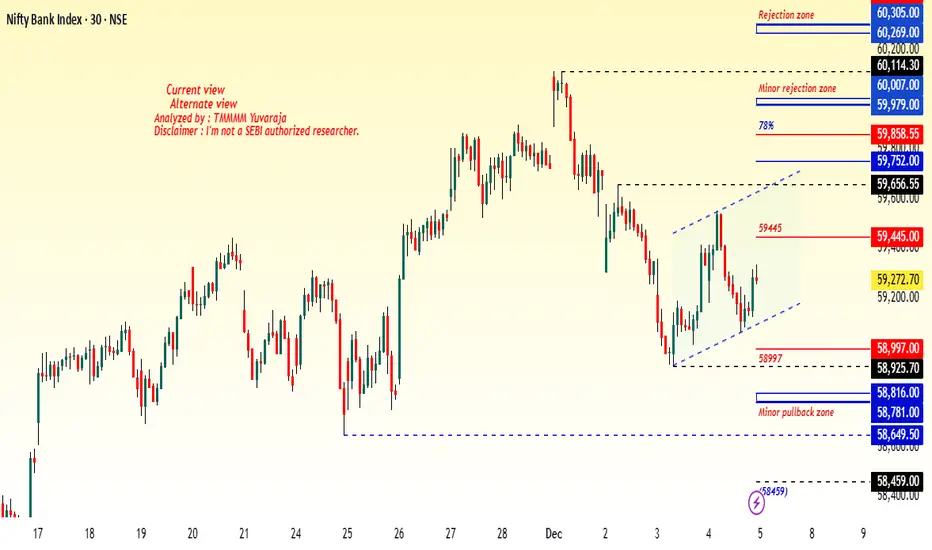
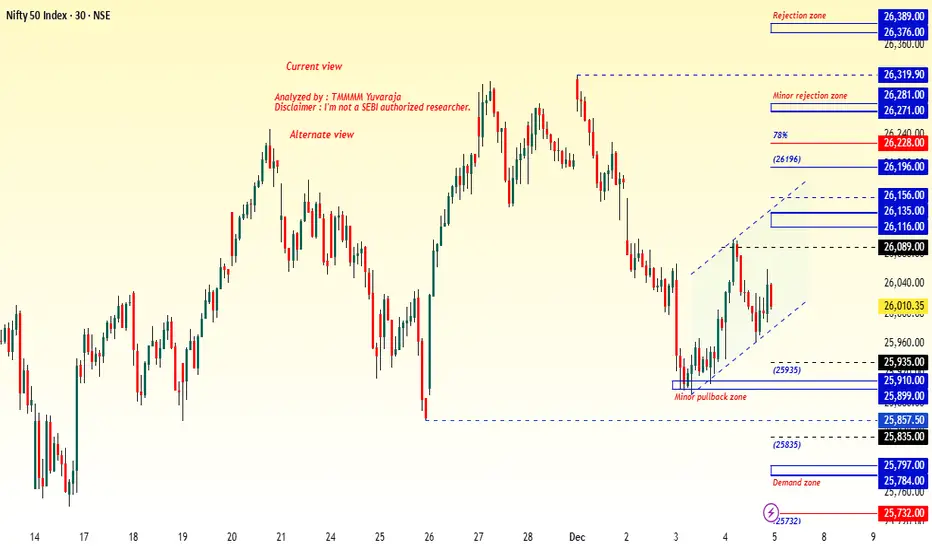
#Nifty Directions and Levels for December 5:Good morning, friends! 🌞
Market Directions and Levels for December 5:
There were no changes in the global or our local market. The Dow Jones indicates a moderately bullish sentiment, while our Indian market indicates a moderately bearish sentiment. However, today the GIFT Nifty indicates a neutral opening.
What to Expect Today?
Today we have a RBI monetary policy announcement. It’s a volatile day, and movement will depend on the event. In my charts, the higher time-frame structure is still showing a solid bullish bias. So if today’s market turns green, we can expect a minimum of the channel top (short-term target). On the other hand, if the market breaks the current swing bottom, we can expect 100% to 127% extension targets for a minor correction. If we call that structurally a flag pattern, AB=CD pattern, or a C wave, then the implications would align accordingly.
this chain feels really good.monad feels like solana when it first launched in 2020. back then nobody really believe nor cared about solana, it was something people hated for awhile, until they didn't.
i believe monad sits in a similar place right now.
monad at 3 cents, was the equivalence of buying solana under 30 cents back in 2020.
---
the tech stack on this project is just phenomenal. instant finality, allows for instant transactions. no pending confirmation blocks, just click, send, and it's there 1 second later. to date, no other chain has felt this smooth to me, which is why monad is currently my favorite project in all of crypto.
---
some technical stuff;
from the coinbase ico, monad came up in a clean 5 wave move,
afterwhich it corrected down via a simple zig-zag.
from the november low, we came up in 5 waves again,
and came down in a clean double zigzag.
---
monad appears to be in a bullish nest here (1-2, 1-2), and i believe it is poised to make a turbo run back to the all time highs, and likely beyond.
---
i cannot predict how high this project will go, so i won't even try, but i will give a mid term prediction of about 0.16.
---
🎯 = 0.16


ASTS - Long here for a bounce upto 90ASTS has strong bounce here from the value area and point of control (intermediatory)
Started a position here, will add more above 57-58
- it's above POC
- above May low anchored VWAP
- completed the correction ABC wave
- bouncing above the trend line
Target 1 - 72
Target 2 - 80
Target 3 - 90
Stop loss - 50

Silver is not done yetthis one seems easy on the eye, i dont really trade silver but target seems obvious

did bitcoin make an inorganic low?good afternoon,
an inorganic low is reffered to as a "truncated 5th" in elliott wave theory. one of the original people who mentioned the term was ralph nelson elliott, when he wrote "the wave principle"
an inoragnic low, by definition is a 5th wave which fails to sweep the wave 3 area. in an uptrend, this can happen due to loss of momentum, but in a downtrend, this could happen due to a major sign of strength.
through out my years in this market, i have personally observed and studied the psychology behind the truncated 5th and how the crowd mentality behaves around it.
often times, there's a sharp reversal and people expect the low to get swept, orders at the lows; but price never returns down there, and their orders don't get filled - which leads to panic buying on the way up, creating extensions in the waves which follow.
---
truncated 5ths in a downtrend are very bullish.
---
i postulate btc sweeps the all time highs, without sweeping the recent 80k low.
---
🎯 = 151k

GOLD → Retest of consolidation support on uptrend FX:XAUUSD is trading in a sideways range around $4,200, awaiting new labor market data to determine the Fed's policy trajectory after December's rate cut.
Weak US data (a 32K decline in ADP employment and a slight increase in ISM services to 52.6) did not change market expectations. The probability of a 25 bp Fed rate cut on December 11 is around 90%. Attention has shifted to the trajectory of policy easing in early 2026. Key factors will be data on unemployment claims and sentiment on Wall Street.
The fundamental background is relatively positive, and the dollar has entered a correction phase due to expectations of lower rates, which may support the gold price...
Resistance levels: 4238, 4262
Support levels: 4185, 4175
Gold is testing the support levels of the key trading range. If the bulls keep the price above 4185 and form a bullish reversal pattern, then in the short and medium term, we can expect growth to intermediate highs.
Best regards, R. Linda!

RIVN Finishing up a leading diagonal for the past yearLooks like RIVN just topped out a leading diagonal from the past year, hitting that upper trendline for the top of the 5th wave. The 5th wave has a 3-3-3-3-3 ending diagonal structure as well. Lets tank back down to $10-$12!

ETHEREUM → The emergence of a positive driver?BINANCE:ETHUSDT is soaring amid a news rally and testing resistance at 3230. The daily increase was almost 20%. If growth is expected, then after a slight correction...
Fundamental background: the market reacted to rumors of the replacement of the Fed chairman with Kevin Hassett, who is more “dovish” and loyal to cryptocurrencies. The market broke the local structure and updated the interim maximum from 3070 to 3230. A false breakout of resistance is forming relative to the key resistance level, and the market is entering a correction/stagnation phase.
Bitcoin, the main driver of the cryptocurrency market, faced strong resistance at 95K. The global market trend is downward, and a change in trend will require time and more confirmation...
There is a struggle for resistance in the market, and several scenarios are possible: consolidation and a breakout of resistance, or growth after correction...
Resistance levels: 3230, 3370
Support levels: 3172 (local), 3057
High probability: a false breakout of 3230 will trigger a correction to 3050 (before the news). If the bulls keep the price above 3050, growth may continue as part of the change in the fundamental background.
BUT! If buyers keep the price without correction, then the focus will be on 3230. Consolidation above this level could trigger growth to 3370 - 3620.
Best regards, R. Linda!

Bitcoin Pumps +10% — Bull Trap or Trend Reversal?Bitcoin( BINANCE:BTCUSDT ) has experienced over a +10% increase in the past two days, which came as a surprise to many analysts considering the previous bearish momentum. In other words, Bitcoin is on something of a roller coaster lately😂.
The question now is whether Bitcoin has started a new bullish trend or if it’s likely to see another decline.
Let’s dive into the 4-hour chart of Bitcoin. Currently, Bitcoin is approaching a resistance zone($94,850-$93,000), a Cumulative Short Liquidation Leverage($94,710-$94,063), and the monthly pivot point. This cluster of resistances, combined with the recent upward momentum, might make it challenging for Bitcoin to break through.
It’s also worth noting that the trading volume during this recent rally hasn’t been particularly high, so Bitcoin could still surprise us. This recent behavior shows that Bitcoin can move sharply both up and down, so it’s crucial to maintain proper risk management.
From an Elliott Wave perspective, considering Bitcoin’s recent decline, I initially expected that Bitcoin might at least test the low of its main wave 3 again. However, the recent rebound suggests that the main wave 5 may be truncated, and the corrective waves could still push Bitcoin lower, potentially even below $75,000.
From a classical technical analysis perspective, Bitcoin might be forming a bearish flag pattern, with the ascending channel acting as the flag’s pole.
In addition, the USDT.D%( CRYPTOCAP:USDT.D ) is still on an upward trend, which indicates that the cryptocurrency market might still face downward pressure.
Moreover, geopolitical tensions, such as those between the U.S. and Venezuela, could also act as a trigger for further Bitcoin declines if they escalate.
Lastly, the S&P 500 index( SP:SPX ), despite its recent bullish trend, doesn’t show the same positive correlation with Bitcoin. In fact, a decline in the S&P 500 could amplify Bitcoin’s downward movement.
Considering all these factors, I expect Bitcoin to continue its bearish trend and potentially test the heavy support zone. If these support levels break, we could see even more significant declines in the crypto market.
Based on the above explanation, I expect Bitcoin to have at least a correction to the targets I specified on the chart, and then depending on the momentum, we can expect a continuation of the decline or a resurgence.
Note: In general, with the opening of the US markets, financial market movements have become more intense these days than before, and it is better to be prepared for any scenario at that time.
What do you think? Do you believe Bitcoin will dip below $75,000, or will it bounce back?
Cumulative Short Liquidation Leverage: $98,591-$96,688
Cumulative Long Liquidation Leverage: $91,860-$90,960
Stop Loss(SL): $96,200
Points may shift as the market evolves
💡 Please respect each other's opinions and express agreement or disagreement politely.
📌Bitcoin Analysis (BTCUSDT), 4-hour time frame.
🛑 Always set a Stop Loss(SL) for every position you open.
✅ This is just my idea; I’d love to see your thoughts too!
🔥 If you find it helpful, please BOOST this post and share it with your friends.

Wheat — moving downWe’re starting to move down.
The first target is the 15,200–15,400 range.
The main one is 14,300. We could even drop lower, but it’s too early to say for sure.
---
Please subscribe and leave a comment.
You’ll get new information faster than anyone else.
Together, we’ll grow and become wealthier.
---

ETHUSD Bull Trap? - Final Breakdown Setup Is Almost Locked InETH is still stuck inside a clear falling channel, and the entire pattern is behaving like a corrective downtrend. The recent bounce from 2620 looks sharp, but it’s still just a counter-trend move. Nothing here screams trend reversal yet.
Wave 3 ending at 2620 , and now the price is rising for a Wave 4 retracement. Wave 4 usually moves back toward the mid-channel and tests previous breakdown zones.
The red box around 3200–3300 is the key trap zone. This is where sellers can return because Wave 4 must not enter Wave 1 territory, which sits higher. As long as ETH stays under that invalidation level, the bearish structure remains fully intact.
The move looks like a classic (a)-(b)-(c) correction inside Wave 4. Once this corrective bounce completes, the chart suggests ETH will resume the downward path. The channel alignment and wave symmetry both support a final Wave 5 drop.
If the bearish count plays out, ETH could slide toward 2400 – 2300 in Wave 5 before a major bottom forms. That’s the zone where sellers exhaust and buyers take control again. Until ETH breaks the invalidation level with strength, downside remains the more probable outcome.
Stay Tuned!
@Money_Dictators

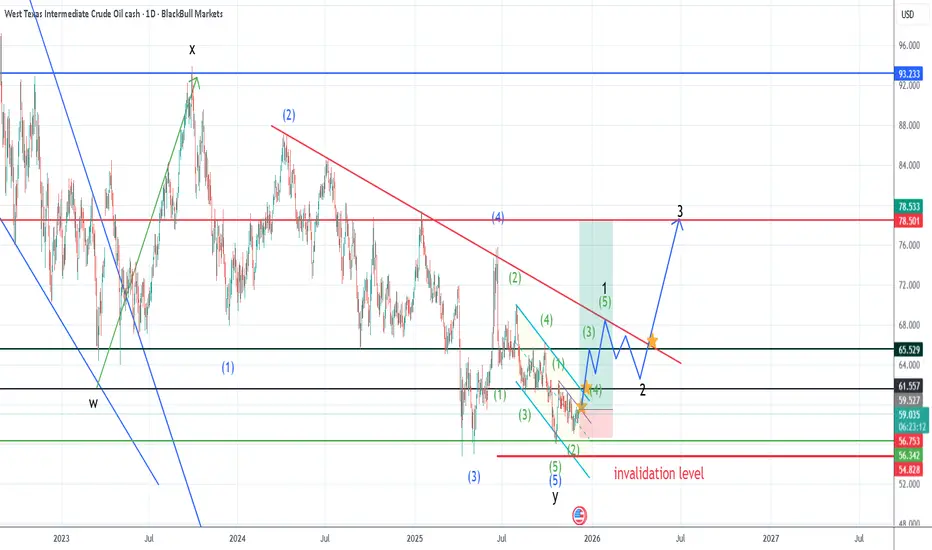
Next UP OIL, i think its time to change direction nowwe are gonna be buying oil again very soon, i dont think it will go much high as it used to be while Trump is in charge but we are likely to see good profit on this,
targets are 65-69 for short term 78 for mid-long term and after that we will see how is everything shaping up.
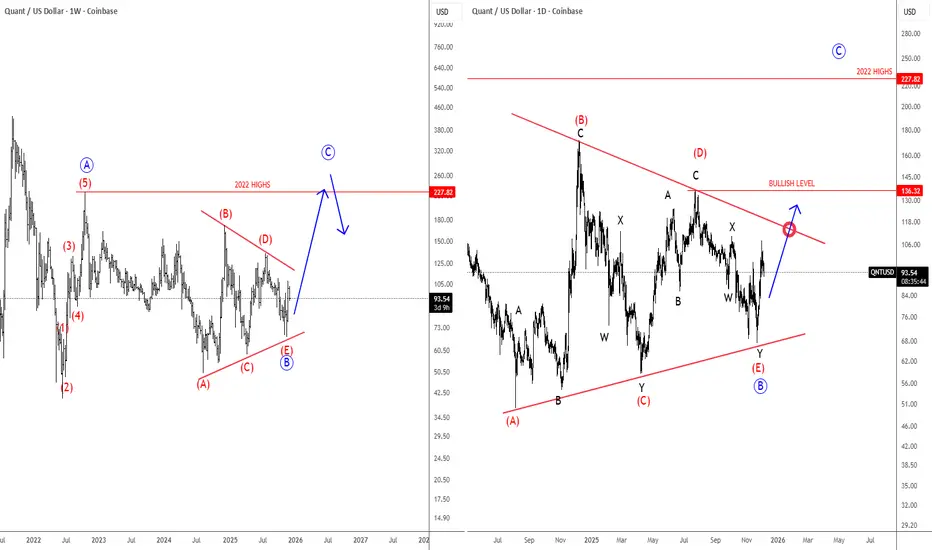
Quant Is Finishing A Bullish Triangle FormationQuant Network is a blockchain interoperability project that lets different blockchains communicate with each other. Its operating system, Overledger, allows developers and businesses to build apps that can run across multiple blockchains at the same time.
The token QNT is used to access and pay for Overledger services.
Quant with ticker QNTUSD is still holding up well above the lower triangle line, so bulls are still here. On the weekly basis, we can now see it finishing a bullish triangle pattern in wave B before we may see another rally for wave C. On a daily chart, it may actually have a completed complex W-X-Y decline within final wave (E) of B, but bullish confirmation for wave C is only above the upper triangle line and 136 level.
$FLOKI 1H CHART UPDATE 📌 If there is a further rejection from the resistance above in CRYPTOCAP:FLOKI , some price decline can be expected ✅
📌 Be careful about those ranges 🔥

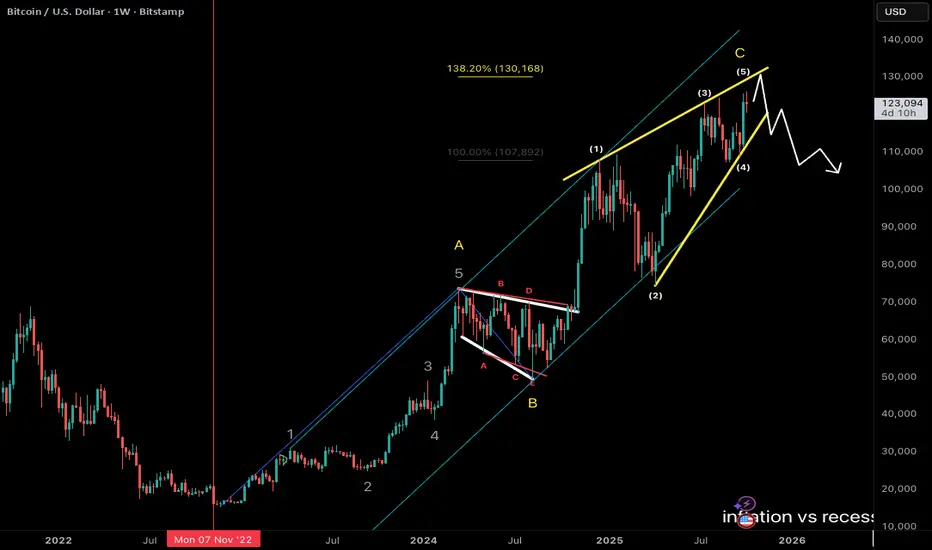
bitcoin ending diagonalbitcoin price going up in a parallel channel
wave A = 12345 and wave C making ending diagonal pattern
C = 138% of A
wave C projection, yellow ending diagonal upper line near 130k
so 130k area is big resistance zone
it has been three years for debasement trade gold and bitcoin are going up
feels like crowd panic on debt
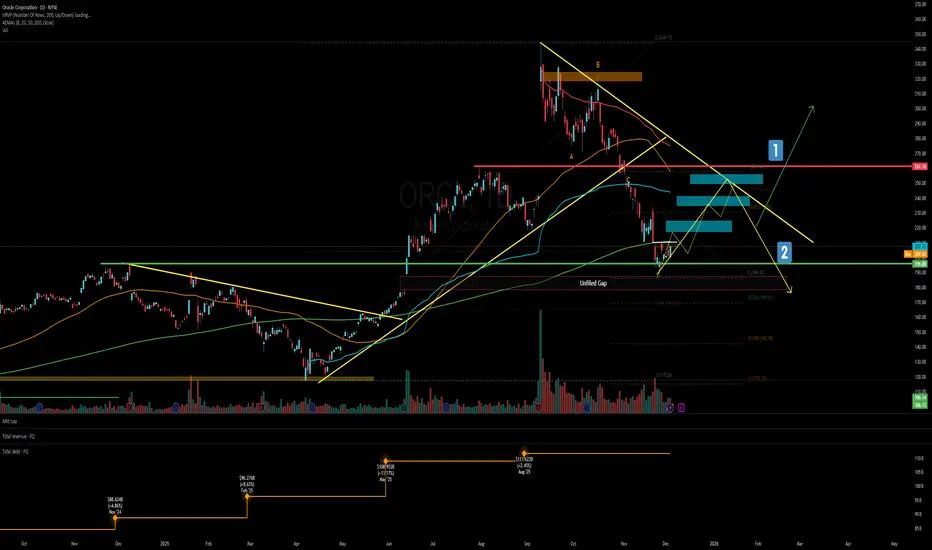
ORCL - Up Or DownORCL's debt clock ticking and CDS are expensive.
Anyways, it's little bit oversold here. We can see a little bounce here.
Earnings next week can ramp this up a little. Prefer to play via shares rather than options.
Long anywhere here.
Target 1 - 223
Target 2 - 240
Target 3 - 252
Stop loss - 200, can be 180 but it's too wide.
BTCUSD how long until correction ends ?after 5th wave ends correction starts and now there are multiple scenarios here, best course of action is the wait out until correction ends, it might be just starting.i will look for a buy when the opportunity presents itself.

US100 = NASDAQ INDEX big short coming soon ?i think we are at the very end of a very long impulsive wave, we might even be finished it not certain but one thing is certain, we will see a big short in the coming months after another small impulse wave or some range to target wave 5 maybe. gonna be on the watch on this one, my last year target already reached so, add to watch list, might give us very good entry for another long term buy.

EURUSD is moved pretty much expected so far next is uploadingEURUSD one of the pairs that moves pretty much spot on with the pips or very close to it. my expectations another correction wave is coming before next impulse,
long term target 1.2350
mid term target 1.1264
short term target 1.1750-1.1850
