$BTCUSD: Monthly Wave 9 incomingIn the last cycle, we see a clear 5-wave pattern. This cycle, after 5 waves, CRYPTOCAP:BTC retraced to nearly 32.8% retracement. However, the cycle didn't end. A new wave made a new high. According to the Elliot Wave theory, impulse waves move in 5's, while corrective waves move in 3's. So if an impulse wave does not end in 5 waves, then it'll have at least 9 waves.
We have completed 7 waves. We are currently in Wave 8. I expect Wave 9 to make a new ATH.
Elliott Wave

BTC getting scooped up by government and ETFsSeems to be a pullback now, but it still works how it works, and people keep buying it. I think this will be an extended triangle correction, followed by more of the same...

Bit Coin Short Term bearishThis chart presents an Elliott Wave analysis of Bitcoin (BTC/USD) on a 4-hour timeframe, shared by Wave Count Pro. The pattern shows a complex corrective structure unfolding within a well-defined channel, with key turning points labeled as A, B, C, D, and a projected E.
Currently, price action is approaching a critical decision zone around $117,211.36. The analysis suggests two potential scenarios:
Bullish Breakout: If the price breaks above the $117,211.36 resistance, it could trigger a strong bullish move toward the upper trendline, targeting around $140,218.55 (labeled as point E).
Bearish Rejection: A failure to break above this level could lead to a pullback toward the lower boundary of the channel, possibly completing a wave (e) before a potential rally.
Key Levels:
Buy Above: $117,211.36
Sell Below: $113,966.84
WaveCount Pro
Gautam Khanna

Ethereum Following Neo WaveEthereum master plan decoded with Targets just follow my Green lines :-)
Ethereum is following neo waves, and these targets are now Arrived basis on the neo wave theory

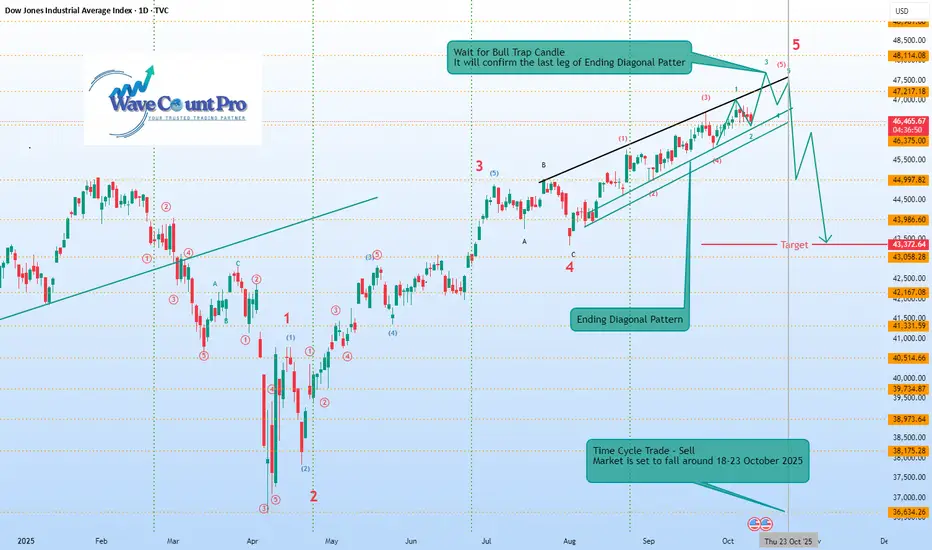
US30 all set to fall 5% starting 18-23rd OctHere’s a summary of the chart you provided:
Index: Dow Jones Industrial Average (DJIA), Daily timeframe (2025).
Pattern: Ending Diagonal Pattern forming in Wave 5.
Wave Count:
Major impulse structure labeled 1–5, with sub-waves marked inside the Ending Diagonal.
Current move is in the final 5th wave, nearing completion.
Key Message:
A Bull Trap Candle is expected — it will confirm the final leg of the Ending Diagonal.
After that, a sharp correction (sell-off) is anticipated.
Target Zone: Around 43,372–43,058.
Time Cycle Note:
A Time Cycle Trade (Sell) is suggested.
Market is projected to fall between October 18–23, 2025.
In short, the chart forecasts the completion of an Ending Diagonal near 47,200–47,500 levels, followed by a significant downside move toward the 43,000 zone starting late October 2025.
Eth New Targets - Triangle Breadown📉 Technical Patterns & Indicators
1. Head and Shoulders Pattern
Left Shoulder, Head, and Right Shoulder are clearly marked.
Breakdown from the neckline suggests a bearish reversal, with a drop of ~6.49% (-295.99) post-breakdown.
2. Triangle Formation
A symmetrical triangle labeled with a, b, c, d, e waves.
The recent price movement has broken below this triangle, indicating a bearish breakout.
3. Elliott Wave Labels
Waves labeled A, B, C, D, E, F, G.
The chart is currently in the E-wave to F-wave transition.
Projection points:
F Wave target: ~$4,218
E Wave target: ~$4,084.51
G Wave target: ~$3,897.08
4. Trendlines
Blue and black descending trendlines suggest downward pressure.
Ethereum remains below these resistance lines, reinforcing a bearish outlook.

Ethereum Daily Chart (Sell on Rise)Wave Count (Green Labels 1–5):
A 5-wave impulsive move appears to have completed, marking a bullish cycle peak.
Complex Correction (W-X-Y-X-Z pattern):
The correction after the 5th wave is labeled as a Complex Correction, composed of:
Wave W – Zigzag
Wave X
Wave Y – Flat (3-3-5)
Wave X – Smaller bounce
Wave Z – Currently unfolding with a Diametric Pattern (7-wave structure)
📉 Current Market Structure
Ethereum is in a corrective phase, currently moving through the Z wave of the complex correction.
The correction appears to be forming another Diametric Pattern, potentially indicating one final drop before resuming upward.
🛒 Key Buying Zones Highlighted
Upper Buying Zone (~$4,400 to $4,600)
If ETH breaks bullish earlier than expected.
Lower Buying Zone (~$3,600 to $3,800)
More likely based on the projection shown.
Where the final leg (Z) is expected to complete.
📈 Projected Path
Price is expected to dip into the lower buying zone as the Diametric pattern completes.
Following that, a strong bullish reversal is anticipated, likely leading to a new impulsive wave up.
📝 Patterns Used
Zigzag
Flat (3-3-5)
Diametric Pattern – A 7-legged corrective structure, less common, indicating prolonged correction.

BitCoin Ready for Bull run 28% upside expected🔍 Analysis Summary:
Current Price: ~$106,927
Pattern: Contracting triangle (ABCDE), nearing completion of wave (e).
Buying Zone: Around $104,000, marked as a potential entry area.
✅ Trading Plan:
Wave (e) could mark the end of the triangle, implying an impulsive breakout upward.
Target for the breakout:
$134,831 (approx. +29% move from the current region)
Further Target (long-term):
Potential move toward $146,000+, labeled as wave G??? (still speculative).
🧠 Insights:
Price action has followed a well-defined corrective structure (labeled A-G and a-e).
The chart shows multiple confluences of support near the buying zone (purple curve and horizontal level).
This setup suggests a low-risk, high-reward opportunity if price reverses near wave (e).

Eth Ready for All time High :-)🔍 Analysis Summary:
Current Price: ~$3,824
Pattern: Complex Elliott Wave correction (W-X-Y-X-Z) has likely completed.
Key Observation: A potential bear trap just occurred (false breakdown), signaling a reversal.
Wave Count: The chart suggests that Wave 2 has completed, and Wave 3 up is starting.
✅ Trading Plan:
Buy Above: $3,925
Stop Loss: $3,378
Target 1: $5,230
Target 2: $6,306
🧠 Insights:
Buying Zone was identified in the earlier phase near April.
Bear Traps are used to suggest failed breakdowns, which trap sellers and fuel upside moves.
Expected Move: Strong impulsive rally if price breaks above the resistance zone.

Gold Near 4,280 as US–China Tensions Fuel Flight to Safety!Hey Traders,
In today’s session, we’re monitoring XAUUSD for a buying opportunity around the 4,280 zone. Gold remains in a strong uptrend, with price currently correcting toward a key structural support area where buyers may look to re-enter.
From a fundamental standpoint, rising US–China geopolitical tensions have pushed investors toward safe-haven assets. Market sentiment is tilting defensive, and Gold — already hovering near all-time highs — continues to reflect that global risk aversion.
A sustained bid above 4,280 could reinforce bullish momentum and potentially open the path toward new highs if uncertainty persists.
Key level: 4,280 (support / trend confluence)
Bias: Bullish while above this level
Trade safe,
Joe.

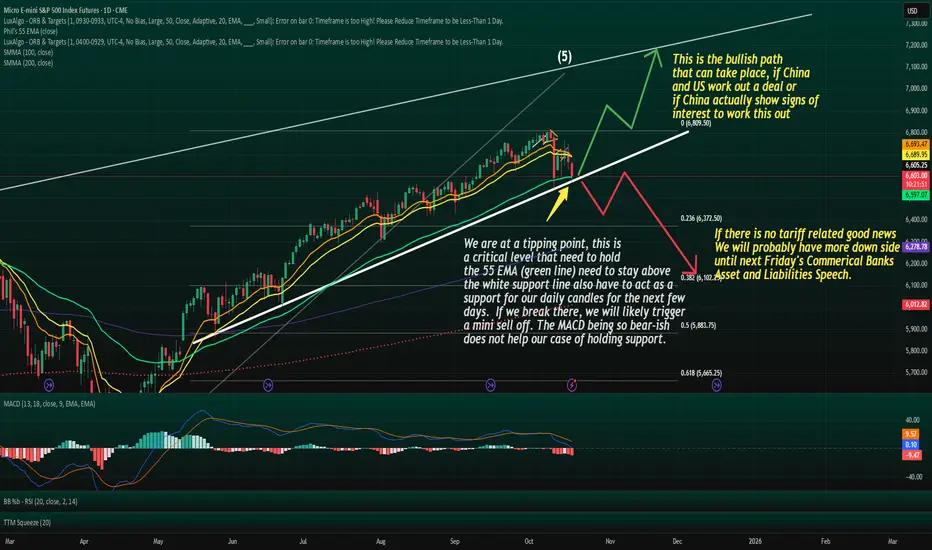
We are at a tipping point that can potentally trigger a bear run
The 55 EMA is widely watched by institutions and swing traders as a medium-term trend gauge.
When price tests this line after a strong run or selloff:
Holding above often leads to trend continuation or strong bounce as seen in the path on my chart.
Losing it convincingly tends to signal a deeper correction or even a trend reversal.
Right now, ES is coiling around the 55EMA, which is the kind of tension point where volatility can explode.
Lower Trend Line = Structural Support
The fact that the EMA test with the lower trend line can adds weight to the downward movement.
When a support trend line and EMA level line up, it becomes a confluence zone meaning breakouts or breakdowns from here are often decisive.
A breakdown of this confluence could open the door to:
A larger corrective Wave A or C leg down.
Possibly a multi-month correction into year end if macro news doesn’t provide support.
Fundamental Catalyst Is Lurking
Tariff or trade-deal headlines can be the kind of fundamental catalyst that aligns perfectly with this technical pressure point.
That alignment is classic in Elliott Wave:
The technicals create the setup.
The news provides the spark.
The breakout or breakdown is fast and aggressive.
⚠️ This is why these zones are dangerous for complacent positioning both bulls and bears can get steamrolled when the move starts.
Two Clear Scenarios
Bullish: candle hold above 55 EMA + trend line then bounce toward upper channel, possibly Wave B or new Wave 3
Bearish: clean daily close below support with 55 EMA dropping below can trigger a multi week(s) correction, potential acceleration downward if no positive news
Bull case → initial target near upper trendline / Fib extension levels.
Bear case → retest of previous swing lows or even 0.618 retrace of the entire rally.
Risk Management Matters Most Here
This is the kind of zone where:
Stops should be clearly defined — not “mental.”
Position size should respect that a big move can be triggered fast.
Targets should be realistic, because reactions off the 55 EMA can be sharp.
“When technicals and fundamentals line up, the market doesn’t tiptoe, it sprints.”
ETH will print another explosive impulseETH, as long as we don't invalidate the impulse, will revisit higher prices (if we'll have a bullish Q4 as expected).
Looking for a reaction at the FVG which has many confluences

GOLD → Positive backdrop. Consolidation before growth?FX:XAUUSD is consolidating after a shake-down in the Asian and Pacific sessions. The price hit a new low of 4278, but bulls are aggressively buying up two liquidations (manipulation?). The metal is preparing for its ninth consecutive week in positive territory, with an 8% increase over the week.
Key drivers: Fed members confirmed their readiness to cut rates in October and pointed to risks for the labor market. The situation with the trade war between China and the US is still tense.
However, negotiations between the presidents of three countries on the conflict in Eastern Europe have raised hopes for de-escalation, which has temporarily reduced demand for defensive assets. The shutdown continues, which supports the price of gold.
The correction in gold is a temporary pause, and any decline will be used for purchases.
Technically, the focus is on the global trading range of 4280-4380, with consolidation within 4350-4330. A breakout of the accumulation zone could trigger a move in the direction of the breakout
Resistance levels: 4350, 4380
Support levels: 4320, 4300, 4280
Technically, before rising, the price may test the liquidity zone located below the specified support zones. However, it is also worth watching the 4350 trigger—a breakout of resistance and a close above this level could trigger continued growth within the current bullish trend.
Best regards, R. Linda!

link spot planssimilar to many altcoins ex like LTC who are in the last stages of their triangle completion I just love trading these patterns on HTF
supports and tps are mention in the chart

Bitcoin. Oh mine! On Par with Gold by 2027? 17/Oct/25BTCUSD probably completed its cycle 7 (purple) high and now trending multi year low until till near 2027 which is cycle 8 (purple ) low. Based on EW pattern BTC could form a long-term flat pattern which price could go down to 3000 +/- by the time Gold which could be at around 3000?

GBPCAD → The hunt for liquidity ahead of growthFX:GBPCAD , after breaking through the resistance of the ascending triangle consolidation pattern and updating its high to 1.8915, is forming a correction to retest the zone of interest before continuing its growth
The British pound is forming an uptrend, which supports the price of the currency pair.
The currency pair is forming a breakout of resistance. After updating the maximum, the price is rolling back to retest the previously broken consolidation border. Liquidity capture relative to 1.8825 - 1.8807 could lead to a shift in the imbalance towards buyers and provoke continued growth.
Resistance levels: 1.8915
Support levels: 1.8825, 1.8808
If, during the retest of support, the bulls keep the price above this zone, then the chances of a reversal and growth will be high. 1.8915 - 1.900 can be considered as a potential target.
Best regards, R. Linda!

5 waves have completed, lets see which Fib floor we land onThe 5 wave pattern with the leading first wave have played now, now we get to play ABC corrective. I think 94k is in play.
Please do not over leverage in this environment

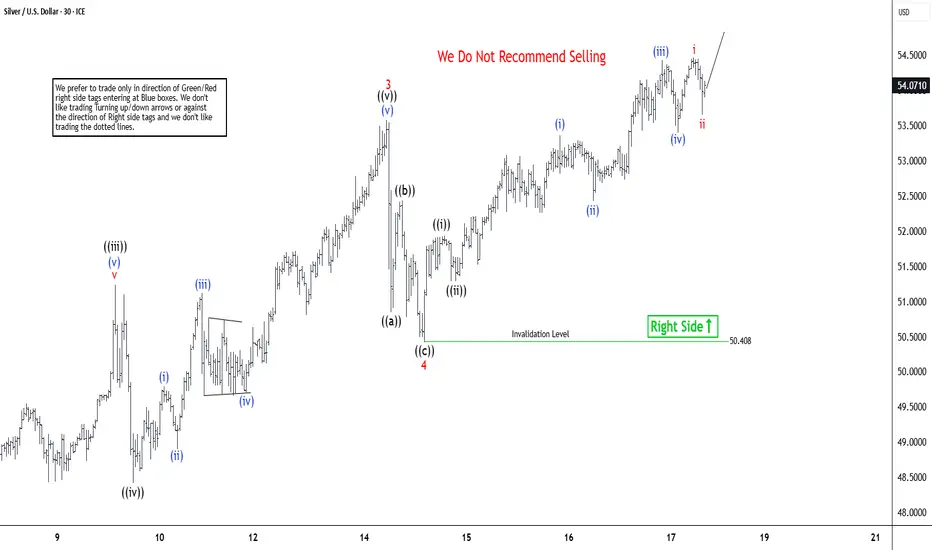
Bullish on Silver: Why Upside Potential Looks PromisingAccording to short-term Elliott Wave analysis, Silver (XAGUSD) has been in a strong impulsive rally since July 31. The metal initially surged to $38.73 in wave (1), pulled back to $36.94 ended wave (2), and then resumed its upward momentum in wave (3) higher. Whereas wave 1 of (3) ended at $39.06 high, wave 2 pullback ended at $38.06 low. Then a rally to $53.57 high ended wave 3. A subsequent corrective phase, wave 4, formed a zigzag pattern with a final low at $50.42, completing the wave 4.
Silver then launched into wave 5, characterized by a five-wave internal structure. From the wave 4 low, the metal advanced in waves ((i)) to $51.93 and ((ii)) to $51.28 low, with minor sub-waves in waves (i) ended at $53.36 high and (ii) ended at $52.42 low. Up from there, wave (iii) ended at $54.42 high and wave (iv) at $53.40 low. Now as long as Silver stays above $50.40, dips are likely to attract buyers, potentially in a 3, 7, or 11-swing sequence, supporting further upside. This outlook suggests the bullish trend remains intact, with potential for additional gains as the impulsive structure unfolds.
Bitcoin at Heavy Supports – Time to Go Long?As I expected in my previous idea , Bitcoin ( BINANCE:BTCUSDT ) completed both its bullish and bearish moves and hit its Long and Short targets .
Bitcoin can still see some upside as long as it holds this Heavy Support zone($111,980-$105,820) . However, given the recent momentum and the wick down to around $102K a few days ago, any further rally depends on breaking the Resistance zone($118,750-$115,730) and touching around $117,220 , which is the high of that significant bearish candle .
Currently, Bitcoin is sitting in a Heavy Support zone($111,980-$105,820) near the 200_SMA(Daily) and a Cumulative Long Liquidation($108,415-$107,156) . It's basically hovering between key weekly support lines, so this is a pretty strong supports .
In terms of Elliott Wave theory , it looks like Bitcoin is still completing its wave 4 . This wave 4 might have formed a Double Three Correction(WXY) , and now we can expect a potential upward move .
I expect that in the next few hours, Bitcoin may start a short-term bullish move up to around $115,000 or to the Cumulative Short Liquidation Leverage($114,973-$113,435) .
Note: Overall, it's better to look for Long positions right now, considering Bitcoin's position. But if it breaks the 200_SMA(Daily) and the Heavy Support zone($111,980-$105,820), we could see a broader crypto market drop.
Note: Around the $108,000 level, we have huge buy orders stacked up, which might act as a significant support zone.
Please respect each other's ideas and express them politely if you agree or disagree.
Bitcoin Analysis (BTCUSDT), 4-hour time frame.
Be sure to follow the updated ideas.
Do not forget to put a Stop loss for your positions (For every position you want to open).
Please follow your strategy and updates; this is just my Idea, and I will gladly see your ideas in this post.
Please do not forget the ✅' like '✅ button 🙏😊 & Share it with your friends; thanks, and Trade safe.

S&P500 | Mild CrashRisk assets looking to sell off as the stock market tops out around $6,800.
Current price action is only pulling back to test sellers again and we should see a continuation in selling until mid November and hopefully to see a Christmas rally to end the year off.
Since price action awfully looks similar to '24 - '25 Fractal we could say the SPX will look to top next year February/March also considering we're on correction 4 in the Elliott Wave Theory.
Would like to see the S&P bottom out around April - July months of next year at $5,600 if we can continue the bullish parallel trend.

ETH: News May Determine the Tipping Point Before Technical BreakMarket Structure Outlook
If you zoom out to a 4-hour time frame, the current structure resembles a corrective Wave 4 within a larger 1-2-3-4-5 impulsive wave.
Based on the recent price behavior, it looks like we are forming Wave E within that corrective Wave 4.
This is one of the most unpredictable parts of an Elliott Wave structure. To make things trickier, ongoing geopolitical tensions could easily push the market in either direction, amplifying volatility.
From a structural standpoint:
We may be in an incomplete Wave E that is trending downward. If any positive or neutral news (e.g., tariff or rate-related) comes out before the pattern finishes, it could push the price upward, breaking through the upper resistance and potentially initiating Wave 5.
Alternatively, what appears to be Wave E could actually be the first subwave (1) of a larger Wave 3 or Wave 5, which would confirm a new impulsive leg starting soon.
Keep in mind, this is a theoretical framework based on Fibonacci levels, trendline support/resistance, and typical wave structure behavior.
It is not a prediction, but a scenario map that allows for:
Bullish breakout (green path) if market sentiment improves or news provides a catalyst.
Continuation to the downside (red path) if no significant positive catalyst appears.
Use this framework as a conditional roadmap — adjust your positioning and risk accordingly, based on how price reacts to these key levels and structure boundaries.

Crude Oil Approaches End of Elliott Wave PatternAbove, is the video review for Crude Oil.
Taking a look at the longer perspective, a multi-year ending diagonal pattern is nearing its end.
The weekly chart for TVC:USOIL suggests the decline is wave 5 of a 5-wave diagonal. The 61% Fibonacci retracement level sits near $49. We're anticipating a bullish reversal between current prices and $49 to carry up to new all-time highs over the coming years.
Looking at a clusters of wave relationships and market geometry, I'd like to see Crude Oil reach the yellow box and punch new lows, but it doesn't have to.
If prices fall further, then the 61% Fib level at $49 may provide support.

US–China Tensions Put Pressure on AUDJPY Near 98.600!!Hey Traders,
In today’s session, we’re closely watching AUDJPY as price approaches the 98.600 zone, aligning with a key resistance level within the broader downtrend. After a short-term corrective move higher, the pair now faces an area that has historically acted as a turning point for sellers.
From a fundamental perspective, global sentiment appears to be tilting toward risk aversion once again.
Ongoing US–China tensions have reignited geopolitical uncertainty, with markets increasingly pricing in the possibility of further escalation. In such an environment, high-beta currencies like the AUD tend to underperform, while safe-haven flows favor the JPY.
If risk sentiment deteriorates further, AUDJPY could see renewed downside momentum from this resistance region.
Key zone: 98.600 — confluence of structure resistance and trend alignment.
Bias: Bearish while below this level.
Trade safe,
Joe.
