More downside for BitcoinHi traders,
Last week Bitcoin made correction up (bearish) and went down.
This could be a bigger (red) wave 4 correction down as I've said in my outlook.
So now we could see more downside to the lower Weekly FVG.
Let's see what the market does and react.
Trade idea: Wait for a correction up on a smaller timeframe to trade shorts.
This shared post is only my point of view on what could be the next move in this pair based on my technical analysis.
But I react and trade on what I see in the chart, not what I've predicted or expect.
Don't be emotional, just trade your plan!
Eduwave
Elliott Wave

Gold keeps on risingHi traders,
Last week gold went up, up, up and after that a downmove. The corrections on gold are very small.
So it could go up again now from the bullish Daily FVG.
Or next week we see a correction up and another downmove for the finish of a bigger correction.
Let's see what price does and react.
Trade idea: Wait for a small correction down on a lower timeframe and a change in orderflow to bullish to trade longs.
This shared post is only my point of view on what could be the next move in this pair based on my technical analysis.
But I react and trade on what I see in the chart, not what I've predicted or expect.
Don't be emotional, just trade your plan!
Eduwave

This could be a big Triangle on SPX500USDHi traders,
Last week we saw a correction up and more downside for SPX500USD just as I've said in my outlook.
On Friday it went up again so the corrective pattern could be a Triangle.
In that case next week we could see another correction down and after that up again.
Let's see what the market does and react.
Trade idea: Wait for the finish of this bigger correction. Trading inside a Triangle is a sure way to lose.
This shared post is only my point of view on what could be the next move in this pair based on my technical analysis.
But I react and trade on what I see in the chart, not what I've predicted or expect.
Don't be emotional, just trade your plan!
Eduwave

EU could go up nowHi traders,
Last week EU made a correction down and started the upmove as I've said in my outlook.
So next week we could see more upside from the bullish Daily FVG's after the finish of the correction down.
Let's see what the market does and react.
Trade idea: Wait for price come into the bullish Daily FVG and reverse. After an impulse wave up and a correction down, look for a change in orderflow to bullish on a lower time frame to trade longs.
This shared post is only my point of view on what could be the next move in this pair based on my technical analysis.
But I react and trade on what I see in the chart, not what I've predicted or expect.
Don't be emotional, just trade your plan!
Eduwave

ADA 5% DROP AHEAD!Theres a chance we get one more push up to test the supply zone ahead before moving down but if not and we move lower from here, it's a 5% drop to the nearest support level.
Just sit back and enjoy the ride.
Calculate Your Risk/Reward so you don't lose more than 1% of your account per trade.
Every day the charts provide new information. You have to adjust or get REKT.
Love it or hate it, hit that thumbs up and share your thoughts below!
This is not financial advice. This is for educational purposes only.

Bitcoin elliott wave count wave 4 of 3 in play?This count is based on my assumptions so anything can happen not a trading or financial advice just for educational purposes only kindly do your own ta thanks trade with care good luck.
Bitcoin - This 2017 trendline predicts a huge crash below 60k!This long-term trendline 2017 - 2021 - 2025 worked perfectly on Bitcoin this year, because we saw 4 major rejections every time the price touched the trendline! Many people said that I must do analysis on the LOG scale only and that this trendline is not valid. Well, the opposite is truth - both linear and LOG trendlines are valid. What does it mean, and is this the end for Bitcoin and altcoins? From the technical point of views - yes, this is over. Bitcoin must climb back above 121k to invalidate this scenario, and I don't see it happening anytime soon.
Uptober turned into a Deathtober for crypto. There was a good reason why all altcoins crashed by 60% to 95% in 1h, and clearly it was a big coordinated manipulation by market makers. If you want to know more about the manipulation (which is extremely interesting, you muse see), please look at my previous post:
If the whales can drop all altcoins by 60% to 95% in a single hour, without any reasonable news, then you can be sure that Bitcoin can drop slightly by 50% to around 60k in 2026! And stop saying that the market dropped because of the tarrifs, that's the biggest nonsense. And this is a very light pullback. I recommend selling all altcoins and taking profits while the prices are still extremely high. I think 2026 will be a red year for the crypto market.
Write a comment with your altcoin + hit the like button, and I will make an analysis for you in response. Trading is not hard if you have a good coach! This is not a trade setup, as there is no stop-loss or profit target. I share my trades privately. Thank you, and I wish you successful trades!

$BTCUSD: Monthly Wave 9 incomingIn the last cycle, we see a clear 5-wave pattern. This cycle, after 5 waves, CRYPTOCAP:BTC retraced to nearly 32.8% retracement. However, the cycle didn't end. A new wave made a new high. According to the Elliot Wave theory, impulse waves move in 5's, while corrective waves move in 3's. So if an impulse wave does not end in 5 waves, then it'll have at least 9 waves.
We have completed 7 waves. We are currently in Wave 8. I expect Wave 9 to make a new ATH.

BTC getting scooped up by government and ETFsSeems to be a pullback now, but it still works how it works, and people keep buying it. I think this will be an extended triangle correction, followed by more of the same...

Bit Coin Short Term bearishThis chart presents an Elliott Wave analysis of Bitcoin (BTC/USD) on a 4-hour timeframe, shared by Wave Count Pro. The pattern shows a complex corrective structure unfolding within a well-defined channel, with key turning points labeled as A, B, C, D, and a projected E.
Currently, price action is approaching a critical decision zone around $117,211.36. The analysis suggests two potential scenarios:
Bullish Breakout: If the price breaks above the $117,211.36 resistance, it could trigger a strong bullish move toward the upper trendline, targeting around $140,218.55 (labeled as point E).
Bearish Rejection: A failure to break above this level could lead to a pullback toward the lower boundary of the channel, possibly completing a wave (e) before a potential rally.
Key Levels:
Buy Above: $117,211.36
Sell Below: $113,966.84
WaveCount Pro
Gautam Khanna

Ethereum Following Neo WaveEthereum master plan decoded with Targets just follow my Green lines :-)
Ethereum is following neo waves, and these targets are now Arrived basis on the neo wave theory

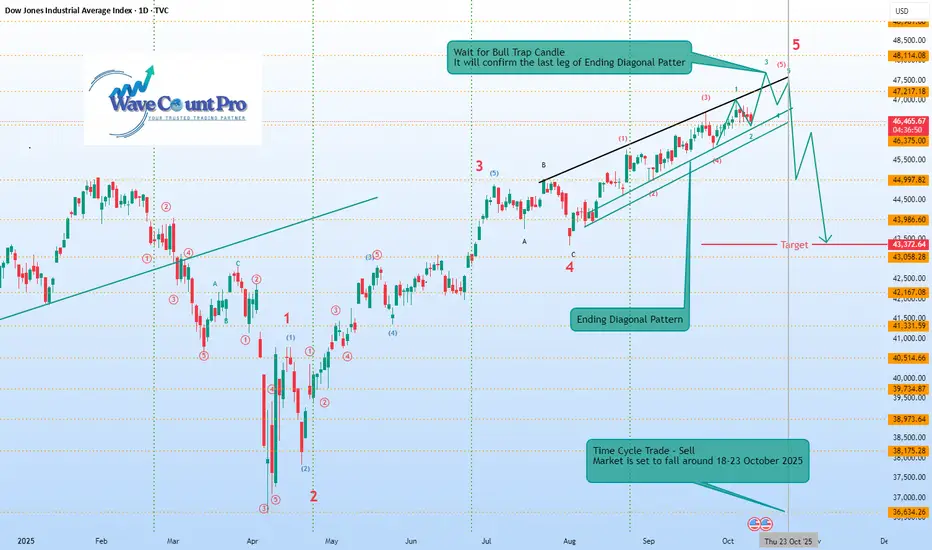
US30 all set to fall 5% starting 18-23rd OctHere’s a summary of the chart you provided:
Index: Dow Jones Industrial Average (DJIA), Daily timeframe (2025).
Pattern: Ending Diagonal Pattern forming in Wave 5.
Wave Count:
Major impulse structure labeled 1–5, with sub-waves marked inside the Ending Diagonal.
Current move is in the final 5th wave, nearing completion.
Key Message:
A Bull Trap Candle is expected — it will confirm the final leg of the Ending Diagonal.
After that, a sharp correction (sell-off) is anticipated.
Target Zone: Around 43,372–43,058.
Time Cycle Note:
A Time Cycle Trade (Sell) is suggested.
Market is projected to fall between October 18–23, 2025.
In short, the chart forecasts the completion of an Ending Diagonal near 47,200–47,500 levels, followed by a significant downside move toward the 43,000 zone starting late October 2025.
Eth New Targets - Triangle Breadown📉 Technical Patterns & Indicators
1. Head and Shoulders Pattern
Left Shoulder, Head, and Right Shoulder are clearly marked.
Breakdown from the neckline suggests a bearish reversal, with a drop of ~6.49% (-295.99) post-breakdown.
2. Triangle Formation
A symmetrical triangle labeled with a, b, c, d, e waves.
The recent price movement has broken below this triangle, indicating a bearish breakout.
3. Elliott Wave Labels
Waves labeled A, B, C, D, E, F, G.
The chart is currently in the E-wave to F-wave transition.
Projection points:
F Wave target: ~$4,218
E Wave target: ~$4,084.51
G Wave target: ~$3,897.08
4. Trendlines
Blue and black descending trendlines suggest downward pressure.
Ethereum remains below these resistance lines, reinforcing a bearish outlook.

Ethereum Daily Chart (Sell on Rise)Wave Count (Green Labels 1–5):
A 5-wave impulsive move appears to have completed, marking a bullish cycle peak.
Complex Correction (W-X-Y-X-Z pattern):
The correction after the 5th wave is labeled as a Complex Correction, composed of:
Wave W – Zigzag
Wave X
Wave Y – Flat (3-3-5)
Wave X – Smaller bounce
Wave Z – Currently unfolding with a Diametric Pattern (7-wave structure)
📉 Current Market Structure
Ethereum is in a corrective phase, currently moving through the Z wave of the complex correction.
The correction appears to be forming another Diametric Pattern, potentially indicating one final drop before resuming upward.
🛒 Key Buying Zones Highlighted
Upper Buying Zone (~$4,400 to $4,600)
If ETH breaks bullish earlier than expected.
Lower Buying Zone (~$3,600 to $3,800)
More likely based on the projection shown.
Where the final leg (Z) is expected to complete.
📈 Projected Path
Price is expected to dip into the lower buying zone as the Diametric pattern completes.
Following that, a strong bullish reversal is anticipated, likely leading to a new impulsive wave up.
📝 Patterns Used
Zigzag
Flat (3-3-5)
Diametric Pattern – A 7-legged corrective structure, less common, indicating prolonged correction.

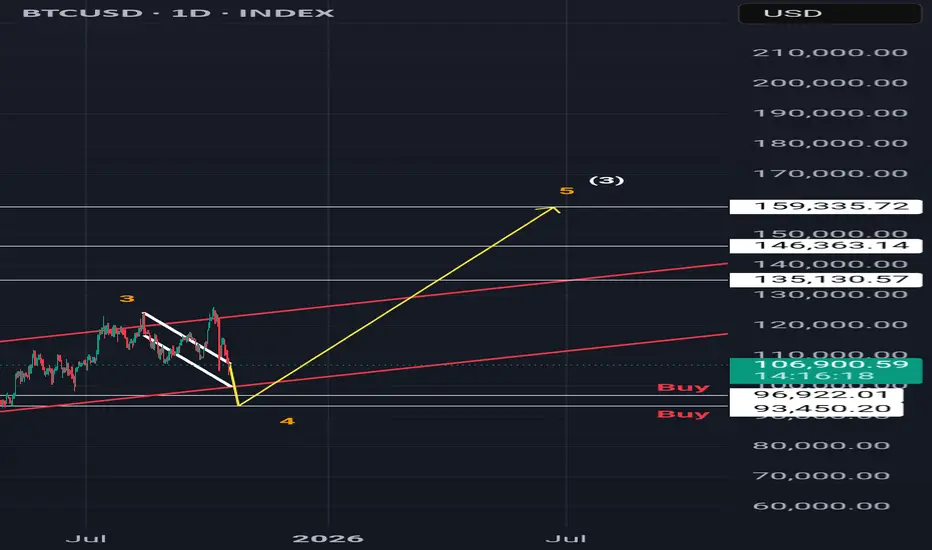
BitCoin Ready for Bull run 28% upside expected🔍 Analysis Summary:
Current Price: ~$106,927
Pattern: Contracting triangle (ABCDE), nearing completion of wave (e).
Buying Zone: Around $104,000, marked as a potential entry area.
✅ Trading Plan:
Wave (e) could mark the end of the triangle, implying an impulsive breakout upward.
Target for the breakout:
$134,831 (approx. +29% move from the current region)
Further Target (long-term):
Potential move toward $146,000+, labeled as wave G??? (still speculative).
🧠 Insights:
Price action has followed a well-defined corrective structure (labeled A-G and a-e).
The chart shows multiple confluences of support near the buying zone (purple curve and horizontal level).
This setup suggests a low-risk, high-reward opportunity if price reverses near wave (e).

Eth Ready for All time High :-)🔍 Analysis Summary:
Current Price: ~$3,824
Pattern: Complex Elliott Wave correction (W-X-Y-X-Z) has likely completed.
Key Observation: A potential bear trap just occurred (false breakdown), signaling a reversal.
Wave Count: The chart suggests that Wave 2 has completed, and Wave 3 up is starting.
✅ Trading Plan:
Buy Above: $3,925
Stop Loss: $3,378
Target 1: $5,230
Target 2: $6,306
🧠 Insights:
Buying Zone was identified in the earlier phase near April.
Bear Traps are used to suggest failed breakdowns, which trap sellers and fuel upside moves.
Expected Move: Strong impulsive rally if price breaks above the resistance zone.

Gold Near 4,280 as US–China Tensions Fuel Flight to Safety!Hey Traders,
In today’s session, we’re monitoring XAUUSD for a buying opportunity around the 4,280 zone. Gold remains in a strong uptrend, with price currently correcting toward a key structural support area where buyers may look to re-enter.
From a fundamental standpoint, rising US–China geopolitical tensions have pushed investors toward safe-haven assets. Market sentiment is tilting defensive, and Gold — already hovering near all-time highs — continues to reflect that global risk aversion.
A sustained bid above 4,280 could reinforce bullish momentum and potentially open the path toward new highs if uncertainty persists.
Key level: 4,280 (support / trend confluence)
Bias: Bullish while above this level
Trade safe,
Joe.

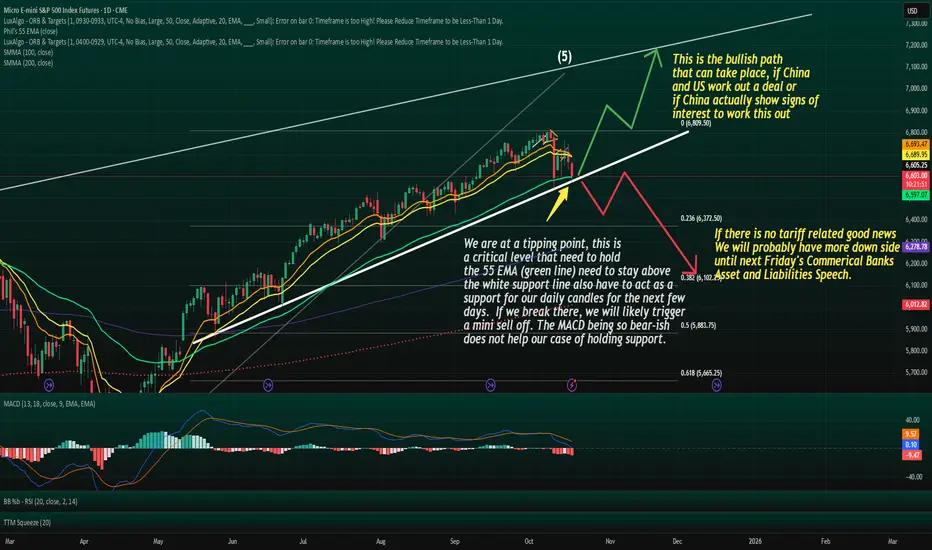
We are at a tipping point that can potentally trigger a bear run
The 55 EMA is widely watched by institutions and swing traders as a medium-term trend gauge.
When price tests this line after a strong run or selloff:
Holding above often leads to trend continuation or strong bounce as seen in the path on my chart.
Losing it convincingly tends to signal a deeper correction or even a trend reversal.
Right now, ES is coiling around the 55EMA, which is the kind of tension point where volatility can explode.
Lower Trend Line = Structural Support
The fact that the EMA test with the lower trend line can adds weight to the downward movement.
When a support trend line and EMA level line up, it becomes a confluence zone meaning breakouts or breakdowns from here are often decisive.
A breakdown of this confluence could open the door to:
A larger corrective Wave A or C leg down.
Possibly a multi-month correction into year end if macro news doesn’t provide support.
Fundamental Catalyst Is Lurking
Tariff or trade-deal headlines can be the kind of fundamental catalyst that aligns perfectly with this technical pressure point.
That alignment is classic in Elliott Wave:
The technicals create the setup.
The news provides the spark.
The breakout or breakdown is fast and aggressive.
⚠️ This is why these zones are dangerous for complacent positioning both bulls and bears can get steamrolled when the move starts.
Two Clear Scenarios
Bullish: candle hold above 55 EMA + trend line then bounce toward upper channel, possibly Wave B or new Wave 3
Bearish: clean daily close below support with 55 EMA dropping below can trigger a multi week(s) correction, potential acceleration downward if no positive news
Bull case → initial target near upper trendline / Fib extension levels.
Bear case → retest of previous swing lows or even 0.618 retrace of the entire rally.
Risk Management Matters Most Here
This is the kind of zone where:
Stops should be clearly defined — not “mental.”
Position size should respect that a big move can be triggered fast.
Targets should be realistic, because reactions off the 55 EMA can be sharp.
“When technicals and fundamentals line up, the market doesn’t tiptoe, it sprints.”
ETH will print another explosive impulseETH, as long as we don't invalidate the impulse, will revisit higher prices (if we'll have a bullish Q4 as expected).
Looking for a reaction at the FVG which has many confluences

GOLD → Positive backdrop. Consolidation before growth?FX:XAUUSD is consolidating after a shake-down in the Asian and Pacific sessions. The price hit a new low of 4278, but bulls are aggressively buying up two liquidations (manipulation?). The metal is preparing for its ninth consecutive week in positive territory, with an 8% increase over the week.
Key drivers: Fed members confirmed their readiness to cut rates in October and pointed to risks for the labor market. The situation with the trade war between China and the US is still tense.
However, negotiations between the presidents of three countries on the conflict in Eastern Europe have raised hopes for de-escalation, which has temporarily reduced demand for defensive assets. The shutdown continues, which supports the price of gold.
The correction in gold is a temporary pause, and any decline will be used for purchases.
Technically, the focus is on the global trading range of 4280-4380, with consolidation within 4350-4330. A breakout of the accumulation zone could trigger a move in the direction of the breakout
Resistance levels: 4350, 4380
Support levels: 4320, 4300, 4280
Technically, before rising, the price may test the liquidity zone located below the specified support zones. However, it is also worth watching the 4350 trigger—a breakout of resistance and a close above this level could trigger continued growth within the current bullish trend.
Best regards, R. Linda!

link spot planssimilar to many altcoins ex like LTC who are in the last stages of their triangle completion I just love trading these patterns on HTF
supports and tps are mention in the chart

Bitcoin. Oh mine! On Par with Gold by 2027? 17/Oct/25BTCUSD probably completed its cycle 7 (purple) high and now trending multi year low until till near 2027 which is cycle 8 (purple ) low. Based on EW pattern BTC could form a long-term flat pattern which price could go down to 3000 +/- by the time Gold which could be at around 3000?

GBPCAD → The hunt for liquidity ahead of growthFX:GBPCAD , after breaking through the resistance of the ascending triangle consolidation pattern and updating its high to 1.8915, is forming a correction to retest the zone of interest before continuing its growth
The British pound is forming an uptrend, which supports the price of the currency pair.
The currency pair is forming a breakout of resistance. After updating the maximum, the price is rolling back to retest the previously broken consolidation border. Liquidity capture relative to 1.8825 - 1.8807 could lead to a shift in the imbalance towards buyers and provoke continued growth.
Resistance levels: 1.8915
Support levels: 1.8825, 1.8808
If, during the retest of support, the bulls keep the price above this zone, then the chances of a reversal and growth will be high. 1.8915 - 1.900 can be considered as a potential target.
Best regards, R. Linda!
