Hellena | Oil (4H): LONG to the area of the maximum of wave “1”.Colleagues, I believe it is necessary to update the forecast slightly. Overall, it remains unchanged, with an upward movement expected.
At the moment, I believe that the higher-order wave “B” has formed, and now in wave ‘C’ I see a five-wave movement “12345”.
I expect wave “3” to begin its movement soon, and I consider the first target to be the maximum area of wave “1” at 60.576.
Manage your capital correctly and competently! Only enter trades based on reliable patterns!
Elliotwaveanalysis

Google: Pause?Over the past two weeks, Google's stock has been taking a breather, moving mostly sideways. Our primary scenario suggests that price will soon gather fresh upward momentum and swing into the red Target Zone between $377.44 and $418.64, where it should complete the overarching upward cycle of the beige wave I. Once this occurs, a new downward impulse is expected to begin, making the red zone suitable for entering short positions; a stop 1% above the upper boundary of the zone can provide protection.

GBPUSD | Prices Continue Uptrend✅ Short-Term Price Direction (H4):
After a sharp decline from its peak, the H4 movement indicates a strong short-term uptrend from the recent low around 1.2100 - 1.2200. The price has created a series of clear Higher Highs (HH) and Higher Lows (HL).
The price is currently consolidating below Short-Term Resistance around 1.3100 - 1.3200, which is also the Low Volume Node (LVN) on the Daily Volume Profile. This indicates potential uncertainty after the rapid rise.
This consolidation is occurring within the newly formed High Volume Node (HVN) area on the H4 (around 1.2900 - 1.3000), which serves as strong Short-Term Support.
Short-Term Bias: Bullish (Upward), as the HH and HL structures on the H4 are still intact.
✅ H4 Key Levels:
- Short-Term Resistance (Consolidation Top): Around 1.3100 - 1.3200.
- Short-Term Support (HVN/HL): Range 1.2900 - 1.3000 (Important).
- H4 Value Area Low: Around 1.2700.
✅ Potential Scenarios
- Strong Bullish Scenario: Price successfully breaks through and maintains above the Short-Term Resistance at 1.3200, paving the way for a test of the Daily POC at 1.3400 - 1.3500.
- Correction/Reversal Scenario: A break and close below the Short-Term H4 Support (1.2900) will invalidate the H4 bullish bias and could lead to further declines to test the H4 Value Area Low at 1.2700 and the Daily Key Support.

ETH: Upward!Ethereum has managed to rise towards the $3,100 level in recent hours. We still assign a 40% probability that, as part of blue wave alt.(b), ETH will move above resistance at $3,656 before selling off into our green Target Zone between $2,228 and $1,789. In our primary scenario, we also expect ETH to reach this zone—potentially without first exceeding the $3,656 level. In either case, once ETH enters the Target Zone, we anticipate a corrective rally, which should top out within the red Target Zone ($5,805 – $7,326) at the high of magenta wave (B).

XRP: Likely to Move Lower Ripple’s XRP is expected to retrace further into the green Target Zone ranging from $1.03 to $0.38 as part of a blue downward impulse, which would complete the higher-level turquoise wave B. Afterward, wave C should drive price sharply higher, ultimately setting a new high for the larger wave (Y) above the resistance at $4.09. However, if bulls manage to push the altcoin above the $3.19 resistance and the $4.09 level in the near term—a scenario we estimate has a 30% probability—it would suggest that the turquoise alt.B wave has already been completed, and our Target Zone would no longer be reached.

BTC.D 4H – Market Structure OutlookHi fellow traders,
On the 4H BTC Dominance chart, I am applying Elliott Wave principles to outline a directional scenario for the broader crypto market. After completing the recent downward leg, I expect dominance to move higher in three waves, forming a corrective structure before the larger continuation to the downside can resume.
This is not a trade setup, but a structural roadmap to understand how capital may rotate across the crypto market. As long as BTC.D remains below the invalidation level at 61.32%, my expectation is that dominance will eventually turn lower with TP1, TP2, and TP3 as the downside objectives - signalling increasing strength for ALTcoins.
If dominance breaks above the invalidation level, this scenario is no longer valid.
Good luck and trade safe!

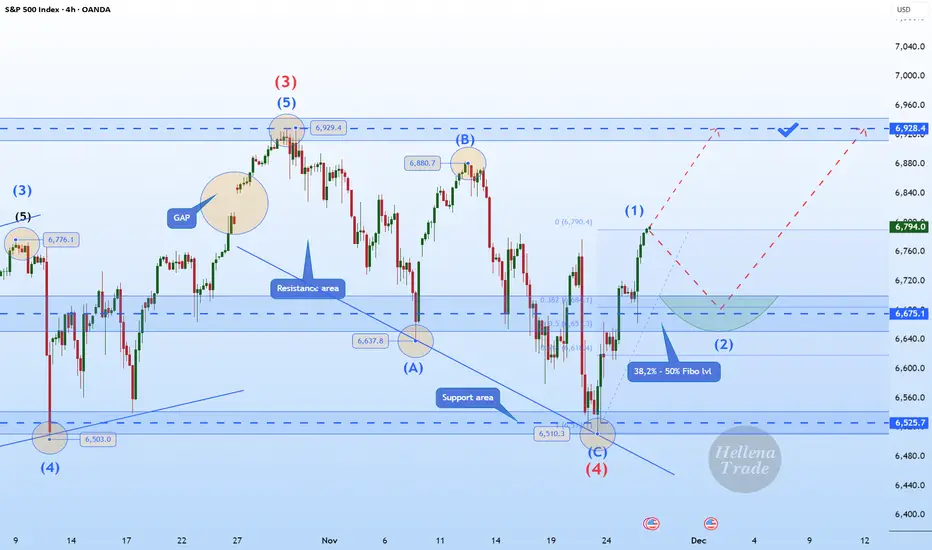
Hellena | SPX500 (4H): LONG to MAX of wave "3" of 6928.Colleagues, we continue the previous scenario of upward movement in the impulse “12345”.
I expect a small correction in the middle order wave “2” approximately to the area of 38.2%-50% Fibonacci levels (6675).
Then I expect a continuation of the upward movement to the maximum of the wave "3" of the higher order 6928.4.
It is possible that the first wave may be stretched, which may mean a correction-free movement to the target.
Fundamental Context.
Market sentiment remains cautiously bullish ahead of this week’s US data releases. Investors continue to price in a softer Fed policy path for 2026, which supports the equity market after the recent correction.
US Treasury yields remain under pressure, and the latest macro indicators — especially labor market cooling and weaker business activity components — reinforce expectations of an economic slowdown. This backdrop typically favors equity upside as markets look ahead to potential policy easing.
Manage your capital correctly and competently! Only enter trades based on reliable patterns!
EURUSD Elliott Wave OutlookThe daily EURUSD structure continues to support a Wave 4 contracting triangle interpretation. Wave d appears complete at the recent swing high, and the pair is now expected to work lower in wave e toward the lower boundary of the triangle and the 0.382–0.5–0.618 Fibonacci retracement cluster of the prior advance.
As long as price holds above the triangle floor and the base channel, the higher timeframe bias remains bullish and the Wave 4 label stays valid. Once wave e completes within this support zone, the next anticipated move is a Wave 5 thrust higher, with a measured triangle target near 1.20697.
Key points:
Wave 4 daily triangle in progress
Wave d high in place, wave e developing lower
Wave e downside zone: 0.382 / 0.5 / 0.618 Fibs
Invalidation: break below triangle and base channel support
Wave 5 upside objective: ~1.20697 triangle thrust level

ETHUSDT – Big Reversal Zone TriggeredHi fellow traders,
On the 1D ETHUSDT chart, I am applying Elliott Wave principles to outline a potential long setup. Price is reacting strongly after completing a deeper correction, and the current structure suggests continuation to the upside within the larger impulsive sequence.
I am entering at the current price, with a Stop Loss at 2400. My Take Profit is positioned at 5267.34, targeting the next objective within this bullish structure.
If price drops below the stop level, this trade is no longer valid.
Structure first. Noise second.
Good luck and trade safe!

UKOIL
Oil is completing a complex corrective pattern, and the current wave is a branch of the corrective wave forming a

GBPNZD Potential Long setup Price has formed and ABC pattern and has reacted from a demand area
waiting to see some price action at pullback inside the zone with some volume pushing price up targeting around 2.35 area
watching price action here is a must
trade safe

EURUSD SHORTPrice tapped the supply zone at daily
overall trend bearish
ABC formation high probability for short trade to 1.1550
Trend safe

BTC Wave 4 Bounce Looks Like a Trap! Is it?BTC is still moving inside a clear corrective channel, with the current bounce likely forming wave 4 before one final drop toward the 1.618 extension near 79,650 . The highlighted red zone shows a potential trap area where price may lure traders into thinking a reversal has started. Until BTC breaks above the channel convincingly, the broader structure still favors a wave 5 decline. The wave count from 1–2–3 supports this final leg down before any major recovery.
Stay Tuned!
@Money_Dictators

BTC reality check! Flat wave C & Oct 26 bottomWe’re back on BTC to drill into my alternate Elliott Wave count and the cyclical roadmap. Cycle work pointed to an October top, which we’ve seen. I remain long-term bullish, but near term I still see a flat correction in play, with wave C unfolding.
Drivers
Elliott Wave structure
The larger uptrend remains intact, but the current phase looks corrective as a flat: wave A as a flat, wave B irregular, and wave C unfolding in five subwaves.
Near term, price action looks like we’re in or finishing wave 4 of C. By alternation, with wave 2 having been deep (around the 61.8% area), wave 4 often resolves shallower (around the 38.2% area). If it stretches closer to 50% and compresses, a triangle into a final wave 5 is plausible before completion of C.
If C remains overlapping and wedge-like, an ending diagonal scenario keeps downside limited. If instead the decline is impulsive, this drop could be only wave 1 of a larger 5-wave move lower.
Momentum-wise, higher-timeframe RSI shows divergence, consistent with a late-stage correction.
Cyclical framework
Bitcoin’s recurring rhythm has often mirrored halving cycles: a bear phase roughly around a year, followed by multi-year bull advances.
Symmetry between bottom→halving and halving→top continues to be informative. With the next halving due in 2028, the cycle window I’m monitoring points to a potential bottom window around Q4 2026 (often cited around October).
This video focuses less on a single trade and more on the timing roadmap: when the corrective structure might complete and when to consider re-engaging for the longer term.
Key zones to watch
If an ending diagonal plays out, a termination near the high-60Ks (around 69k area) would be consistent with “limited downside.”
A more dramatic impulse path could open a wider “magnetic zone” of support roughly spanning the low-70Ks down toward the 50Ks, with deeper stretch risks if the impulse extends.
Confirmation will depend on how wave 4 resolves and whether the next leg proves corrective (ED) or impulsive.
Trade idea
My base lens is structure-first, timing-second. If wave C finishes as an ending diagonal, downside should be limited in the high-60Ks and setting up a bullish continuation in 2026. If instead the drop proves impulsive (5 down), treat bounces (0.5–0.618 retraces) as opportunities to reassess shorts, with a support “magnet” spanning roughly low-70Ks to low-50Ks, and deeper risk if momentum accelerates. Validation hinges on how wave 4 resolves and whether the final leg is overlapping (ED) or cleanly impulsive.
If you want my annotated charts and live invalidation levels, drop a comment. Like and subscribe to catch the mid‑week follow‑up when wave 4/5 signals firm up.
This content is not directed to residents of the EU or UK. Any opinions, news, research, analyses, prices or other information contained on this website is provided as general market commentary and does not constitute investment advice. ThinkMarkets will not accept liability for any loss or damage including, without limitation, to any loss of profit which may arise directly or indirectly from use of or reliance on such information.

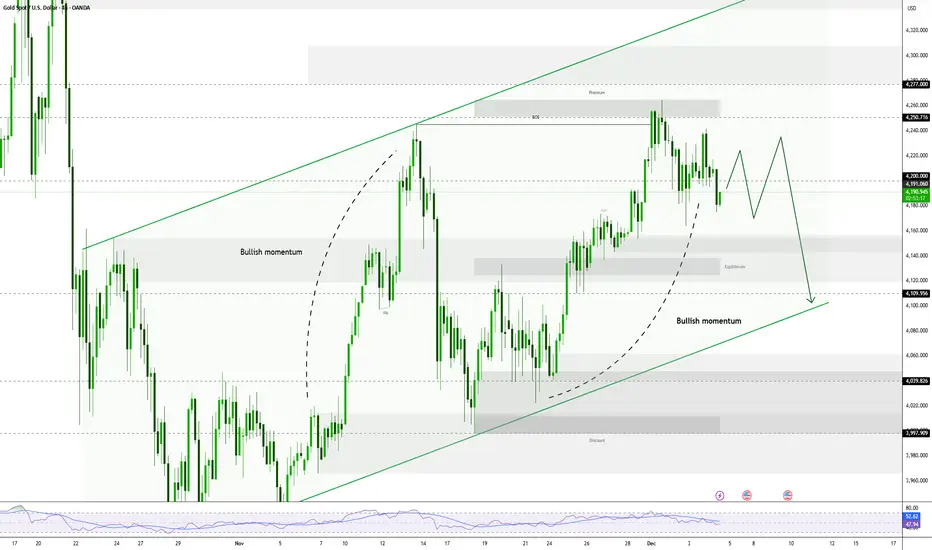
Price Under Pressure and Fails to Break $4,245Gold (XAU/USD) is under pressure as it has repeatedly failed to break through the $4,245-$4,250 barrier. This failure, followed by a decline, supports the bearish view.
✅ Bearish Scenario
- ⚡Initial Critical Point: Diverse technical oscillators indicate that further declines are likely to find decent support near the weekly low, which is the $4,164-$4,163 area.
- ⚡Downside Target: Continued selling below this level could drag Gold towards the $4,100 round figure.
- ⚡Strong Support Base: The next decline will test the confluence support at $4,085.
Note: $4,085 is composed of the 200-period EMA on the 4-hour chart and an ascending trendline. This level should act as a strong short-term base.
✅ Bullish Scenario
- ⚡Strong Hurdle: The $4,245 – $4,250 zone will continue to act as an immediate strong barrier.
- ⚡Next Target: Above $4,250, the price could head towards the $4,277 – $4,278 region.
- ⚡Strong Upside Trigger: Sustained strength beyond the $4,300 round figure will be seen as a key trigger for bulls and pave the way for additional short-term gains.
MSTR - Wave 4? - Next stop 197-202 then reload for 220-235!THESIS
The recent price action confirms a bullish Elliott Wave impulse move from the $155.61 low. The market has validated an Extended Wave 3 by successfully holding the maximum 61.8% retracement level during the deep Wave 4 pullback (low of $177.82).
We are now in the final thrust of Minor Wave 5, we should then see a 3 wave pullback which sets up the full corrective rally to our higher-degree target of $220-$235!
Analysis & Targets (Aligned to the Chart)
1. 🎯 Wave (A) Completion: The Final Minor Impulse
The current action is the final push of Minor Wave 5 (the fifth wave of the initial impulse from the $177.82 low).
• Entry Signal: The bounce from the $177.82 low confirmed the Wave 4 bottom.
• Target Zone (A): The technical projection for Wave 5 (using W5 = W1 or 0.618 \times W1-3) places the peak between $196 - $202
• Action: This is the initial profit-taking zone. Look to sell calls here, as this completes the first major structural move.
2. 🌊 Wave (B) Correction: The High-Grade Reload
Once the Wave (A) target is hit, a larger corrective pullback (Wave (2) in the larger context) is mandatory before the final surge. Since the preceding Wave 4 was sharp/deep, this Wave (B) correction is likely to be shallow/sideways (a Flat or Triangle) to adhere to the Principle of Alternation.
• Target Zone (B): We project a 38.2-50-61.8% retracement of the entire impulse. This places the reloading zone between $182 - $172 (The green box on the chart).
• Action: This is the Optimal Reloading Zone for long positions before the final rally.
3. 🚀 Wave (C) Final Target: The Greater Rally Peak
The final Wave (C) completes the overarching corrective rally. This leg is targeting a significant Fibonacci retracement of the prior, large bear wave.
• Target Zone (C): The $220 - $235 box is perfectly aligned with the high-probability 38.2% of the massive Wave 3 down that preceded this entire rally.
• Action: This is the final take-profit target for the entire trade structure.
Key Levels to Watch
• Buy Target (Sell Limit): $197 (Exit Minor W5).
• Reload Zone: $182- $172 - (Buy the Wave B dip).
• Invalidation Price: $170 (A close below this invalidates the entire impulse).
Good luck with the final wave! Remember to manage risk and set a stop loss! I am a guy on the internet and not a financial advisor!
#ElliottWave #MSTR #Bitcoin #Bullish #TechnicalAnalysis

Netflix: Long-Term Buy Zone in Focus Netflix shares have recently turned lower, moving towards our previously identified long-term entry zone between $96.27 and $75.19. Within this range, we expect the low of the turquoise wave 4 to form, setting the stage for the ongoing upward impulse in wave 5 to push past resistance at $134.11. In a new alternative scenario, there is a 30% probability that the beige wave alt.IV could establish a lower low below $81.27, though it would still remain within the long-term entry zone

USDJPY Breakdown Begins:Elliott Wave Points to Deeper CorrectionThe USDJPY 4H chart shows a completed five-wave impulsive structure, ending at the recent high marked as wave (5). After finishing this full wave cycle, the price has started to break down from the rising wedge pattern, which is a common sign of a trend reversal. The corrective structure from the top suggests the beginning of a larger A-B-C decline, targeting lower levels in the coming sessions. As long as price stays below the invalidation level near 157.68, the bearish outlook remains valid. This setup indicates that USDJPY has likely completed its bullish phase and is now preparing for a deeper corrective move downward.
Stay tuned!
@Money_Dictators
Thank you :)

EURCHF – Bullish ABC Pattern“Market is forming a bullish ABC structure. Wave C may continue upward if support holds.”

EUR/USD Wave CWe just validated the 5 wave count followed by A & B we expect the the the correctional C wave to be violent to the downside

XAUUSDWhen Elliott and liquidity line up perfectly, the market has only one option: submit. 💸🔥
TP:40RR

S&P500: Futures Stuck in Tight Range S&P 500 futures traded mostly sideways yesterday, remaining confined within a tight range. In our primary scenario, however, we anticipate that magenta wave (4) will soon resume its downward move. During this phase, the index is expected to initially break below the support levels at 6540 and 6371 points. We then look for the final low of the wave (4) correction to occur within our green Long Target Zone between 6163 and 5912 points. Once this low is established, the subsequent wave (5) should propel prices above resistance at 6952, marking the peak of the broader blue wave (III). Immediately after, we expect the onset of magenta wave (1), which should kick off a significant corrective phase. However, if the index continues to fall below the Long Target Zone, our alternative scenario may come into play (probability: 31%). In that case, it would suggest that the alternative blue wave alt.(III) has already completed and the major correction is already in progress.

BTC(based on NEo wave)this is not a trend-impulse...it is terminal and if it hit the limitation of wave 4 its a natural triangle and its not wave C of a flat.
