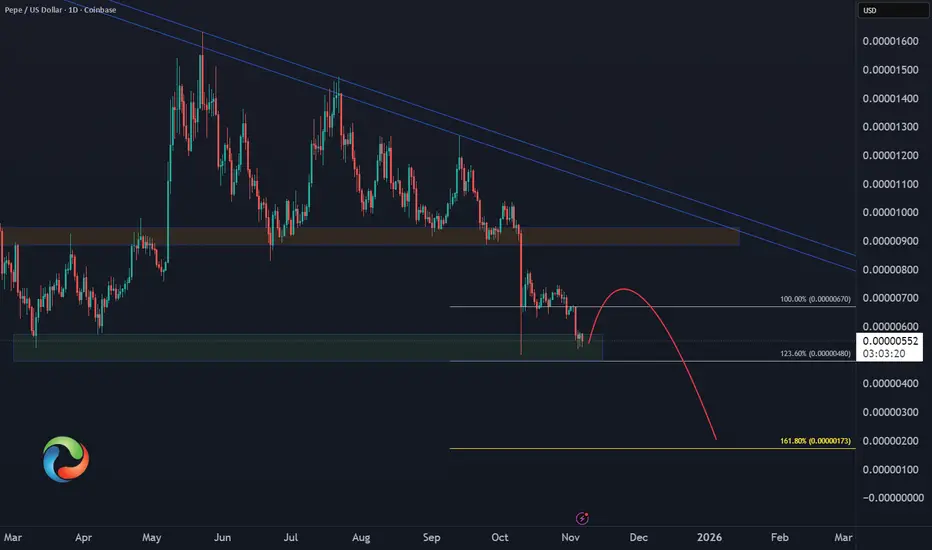
PEPE – Relief Rally, Then More Pain?CRYPTO:PEPEUSD is still testing the 2025 lows, which could trigger a short-term bounce in the coming weeks. However, unless the rally breaks above the October high, the structure suggests this is just a corrective move before further downside resumes.
📉 Key Levels to Watch:
Support: 2025 lows – potential bounce zone
Resistance: October high – likely cap for relief rally
Outlook: Bearish continuation favored unless bulls reclaim key resistance
Fibonacci
GBPCAD will Fly , All Confirmations are in the Bullish SideHello Traders
In This Chart GBPCAD HOURLY Forex Forecast By FOREX PLANET
today GBPCAD analysis 👆
🟢This Chart includes_ (GBPCAD market update)
🟢What is The Next Opportunity on GBPCAD Market
🟢how to Enter to the Valid Entry With Assurance Profit
This CHART is For Trader's that Want to Improve Their Technical Analysis Skills and Their Trading By Understanding How To Analyze The Market Using Multiple Timeframes and Understanding The Bigger Picture on the Chart

EUR/USD Snaps 1.15- Recovery Risk RisesEuro is attempting to recover after a brief break below the 1.15 handle, with EUR/USD carving the weekly opening range just below the November open. The move highlights potential downside exhaustion within the broader downtrend, with the focus now on whether a near-term recovery can develop from this zone. A breakout of the weekly opening range may offer clarity on direction in the days ahead.
EUR/USD continues to trade within the confines of the descending pitchfork extending off the yearly high. A two-day rally is now testing confluent resistance near the 75% parallel at 1.1537/42- a region defined by the objective monthly / weekly open and the mid-October swing lows. A rally surpassing this pivot zone would expose a stretch towards the Fed reversal close at 1.1601. Note that this level converges on the upper parallel tomorrow (near-term bearish invalidation). Ultimately, a breach / close above the 38.2% retracement of the September decline and the September 25 swing low at 1.1641/46 would be needed to suggest a more significant low is in place / a larger reversal is underway. Subsequent resistance eyed at the October high-day close (HDC) / 61.8% retracement at 1.1731/47.
Initial support rests at the 1.15-handle and is backed closely by the weekly range low at 1.1469. A break / close below the median-line is needed to mark resumption of the September downtrend with subsequent support objectives seen at the May HDC / August low at 1.1387/92 and 200-day moving average / 100% extension of the September decline at 1.1340/52. Both regions represent areas of interest for possible downside exhaustion / price exhaustion IF reached.
Bottom line : EUR/USD is threatening downside exhaustion here and the risk remains for a larger recovery within the multi-month downtrend. From a trading standpoint, the immediate focus is on a breakout of the weekly opening-range for guidance. Rallies should be limited to 1.16 IF price is heading lower on this stretch with a close below the weekly low needed to fuel the next leg of this decline.
-MB

USD/JPY Coils as Breakout Setup BuildsThe Japanese Yen is getting a brief reprieve from recent selling pressure, with USD/JPY consolidating near the upper bounds of a multi-month uptrend. The immediate focus is on a breakout of this range at nine-month highs for guidance into November trade. A topside breach would mark resumption of the broader advance, while a break below the October slope could trigger a deeper correction in the days ahead.
USD/JPY continues to trade within the confines of an ascending pitchfork extending off the October lows. The lower parallel now converges on support at the October high-close / swing high at 153.08/27. A break / close below this threshold would threaten a larger correction towards key support (bullish invalidation) at 151.63/95- a region defined by the 61.8% retracement of the yearly range and the 2022 / 2023 swing highs. Look for a larger reaction there IF reached. Subsequent support seen at the July high-close at 150.74 and the September high-close at 149.81.
Initial resistance is eyed at the 78.6% retracement of at 154.82- note that the 75% parallel converges on this threshold next week and a breach / daily close above would be needed to mark resumption of the broader uptrend. Subsequent resistance objectives are eyed at the November high-close and the 100% extension of the April advance at 153.27/44 and the 2025 yearly open at 157.19.
Bottom line: USD/JPY is trading just below confluent resistance with the weekly and monthly opening-ranges now taking shape- look for the breakout in the days ahead. From a trading standpoint, losses should be limited to 151.63 IF price is heading higher on this stretch with a close above 154.82 needed to fuel the next major leg of the advance.
-MB

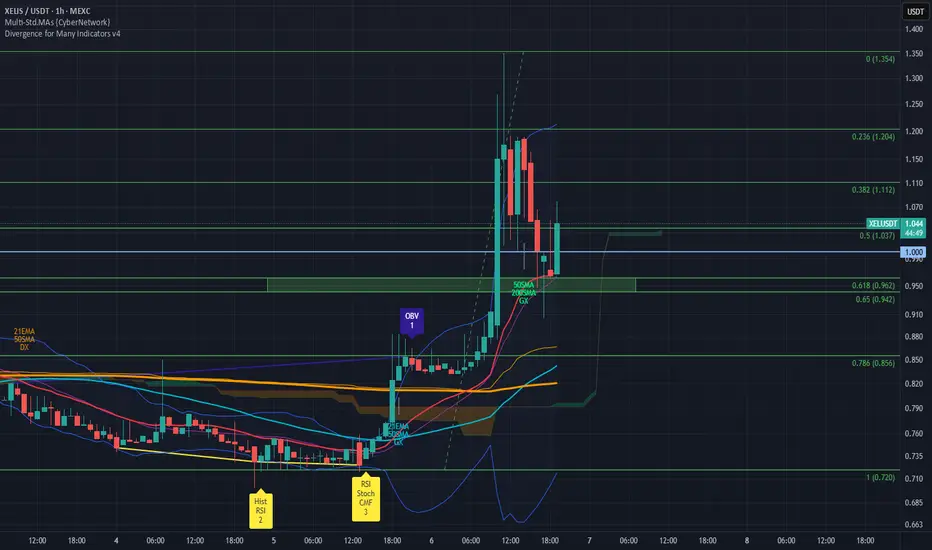
Xelis (fast Privacy BlockDAG) is about to do a banana-zone pump?NASDAQ:XEL #Xelis finding support above the 21 EMA on the lower timeframe, readying itself on a launchpad @ the golden pocket, before continuation.
Fundamental Analysis:
Holding 3500 NASDAQ:XEL is like holding 3Mil CSE:KAS in terms of supply. Currently at around Rank #2400 in terms of MarketCap, basically a micro-cap.
We are still early on #Kaspa $KAS. And we are even earlier on #XELIS which is basically = #ZCash + #Kaspa technology (building on the shoulders of the two great giants: one in advancing privacy, and the other in POW consensus solving the trilemma, respectively).
SKYROCKETINGGG GBP/USD (15m – 1H) | 6NOV💷GBP/USD (15m – 1H)
HTF Context:
🔹 SMC Flow:
Price recently grabbed liquidity beneath the previous 30m swing low (30m LQC), then reacted from a valid demand zone.
A minor BOS (Break of Structure) has confirmed short-term bullish intent, aligning with higher-timeframe demand.
🔹 LQC Insight:
That sweep below internal liquidity served as a clean accumulation phase, trapping sellers before bullish displacement.
📈 Bias: Bullish towards 1.3125 – 1.3140
📉 Invalidation: Below 1.3084 (break of 30m demand zone)
💡 Plan: Wait for a retest of 15m demand or continuation entry after confirming intraday momentum.

Wayfinder PROMPT price analysis💥 When’s the best time to pump a coin?
Of course — during a market dump! 😎
That’s exactly what the $PROMPT market maker thought 💭
And with one smooth move — +102% in a single day! 🚀
💰 The #Wayfinder project’s market cap is still tiny — around $26M,
so there’s plenty of room for “magic” moves like this 😉
📊 On the OKX:PROMPTUSDT chart, price is now testing a strong liquidity zone at $0.115–$0.145.
So for now, be very careful with longs ⚠️
But if bulls manage to hold above that range, there’s a good chance for a move toward ~$0.30 💪
🤔 What do you think — just a flash pump or the start of a bigger game?
Share your thoughts in the comments 👇
______________
◆ Follow us ❤️ for daily crypto insights & updates!
🚀 Don’t miss out on important market moves
🧠 DYOR | This is not financial advice, just thinking out loud

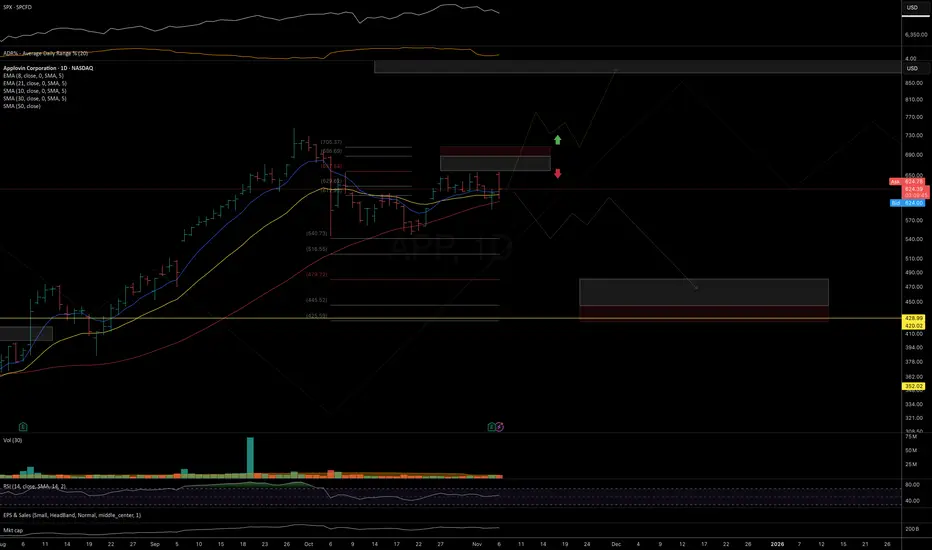
APP: at risk of deeper correctionAs long as price stays below today’s high and the 700 level, I’m watching for a deeper pullback toward 515–480 or a potential re-test of the June 2025 highs.
Alternatively, a sustained breakout above 700 would open the door for a continuation move toward the next macro resistance zone at 900–1100.
Chart:
Macro view:
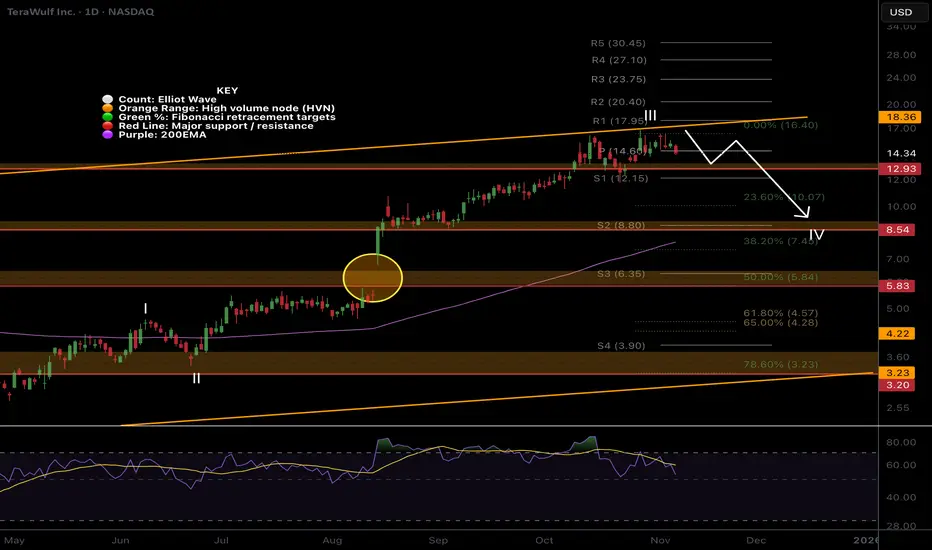
WULF pullback on the cards!Price is struggling at the trend-line boundary on bearish divergence suggesting wave III is complete and wave IV is soon underway.
Due to the size of the rally wave IV could be deep. The usual 0.382 target is down at $8 where it would meet the daily 200EMA.
Daily RSI has printed bearish divergence in overbought.
breaking out above the trend-line could be extremely bullish.
MSTR further downside but looking exhaustedNASDAQ:MSTR Price continues range bound in a complex wave 4 correction, notoriously hard to analyse. The trend is down but looks exhausted.
Wave Y can complete any time in this flat correction pattern but is approaching the previous swing low and the 0.236 Fibonnacci retracement.
Daily RSI has printed bullish divergence but price continues lower. IF pice breaks down further the next target is $185 where price may find a bottom.
Recovering the daily 200EMA is the first goal.

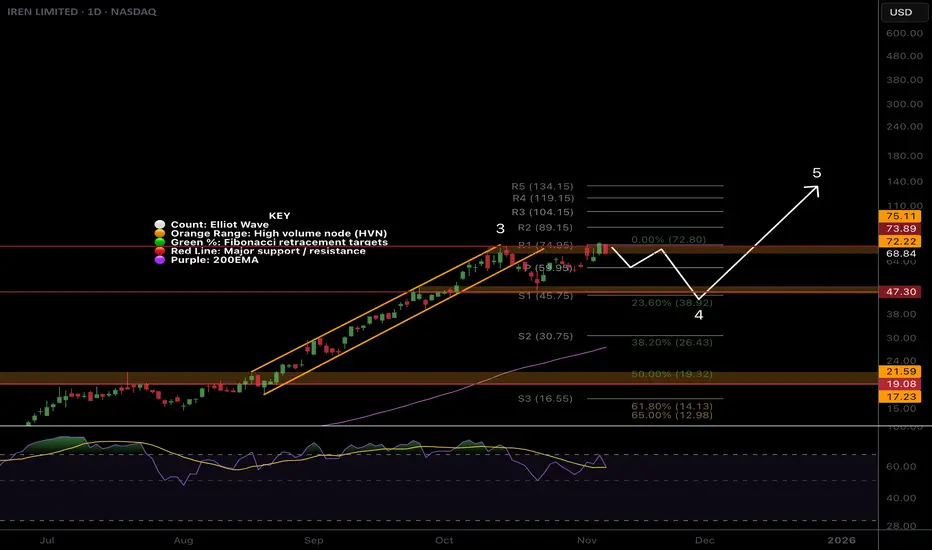
IREN pullback on the cardsNASDAQ:IREN is breaking out again on huge candle spread, though I am skeptical of continued rally from here without a pullback first. For now the trend is up.
Price has broken out of its momentum channel and formed a range so I am expecting the excitement to trap late comers and traders with a swift reversal in wave 4. Initial downside target is $47 at the High Volume Node and .0236 Fibonacci retracemenet. Stronger downside momentum could test the rising daily 200EMA at the 0.382 Fibs.
Daily RSI has printed unconfirmed bullish divergence at the EQ.
Continued upside keeps us looking at the pivot targets.
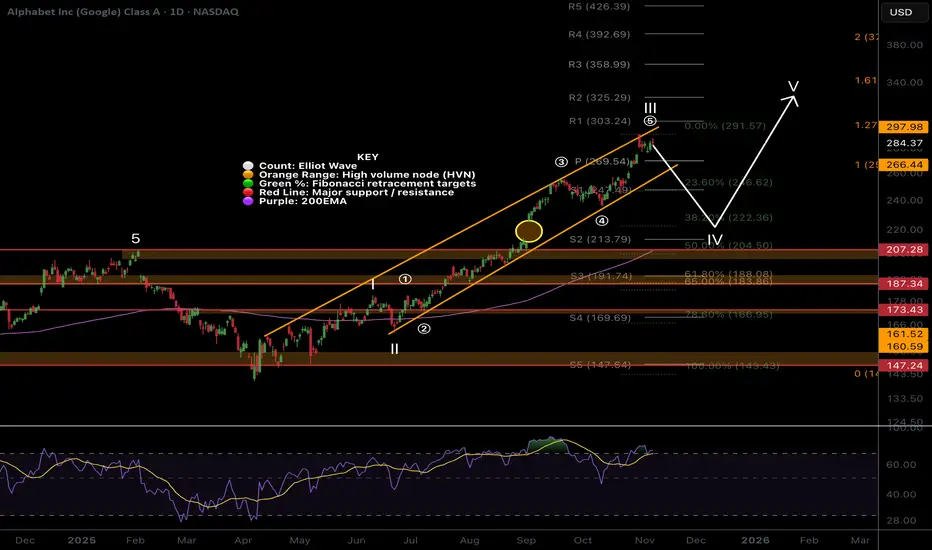
Google pullback still in play, local chartWave III continues but price looks exhausted and may trap late investors causing them to capitulate lower later.
Wave (5) of III is likely to complete with a throw-over of the upper channel boundary. Wave IV has an expected retracement target of the 0.382, $222, filling the gap left and meeting the daily 200EMA.
Daily RSI has printed bearish divergence from overbought.
Continued upside hasa target of the R3 pivot, $358.
Coinbase wave C underway NASDAQ:COIN Price appears to be completing wave C of IV, a corrective pattern to the downside expected to be shallow.
Wave IV are often shallow ending no further than the 0.5 Fibonacci retracement. This is just below the S2 pivot and High Volume Node support. 0.382 is the higher probability target for the end of the downwards move aligning with a swing below the daily 200EMA and S1 pivot.
Daily RSI has room to fall.
Breaking wave B would suggest a new bull move is underway.

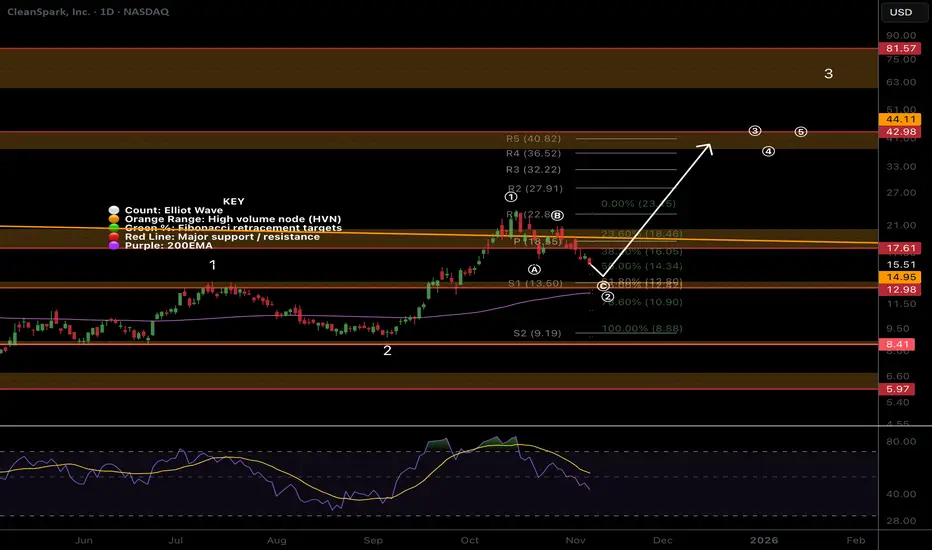
CLSK Local analysis, pullback does not violate larger trendNASDAQ:CLSK Price is pulling after a failed breakout falling back into the macro triangle. Behaviour appears to be a textbook corrective ABC which should end with one more thrust down to the S1 pivot before continuation to the upside.
Wave © can be strong and powerful, often where investors capitulate. The target is the High Volume Node support, rising daily 200EMA, Fibonacci golden pocket and S1 pivot.
Daily RSI has room to fall.
Breaking above wave (B) would suggest the correction is over.
CIFR Pullback time?NASDAQ:CIFR Locally, price continues into price discovery with big jumps suggesting wave 3 is still going Wave (5) of 3 appears to be underway which could end at any moment. I am still expecting a retracement to test the previous all time high and punish late investors who are chasing prices up, trapping them into capitulation later.
Wave 4 has a downside target of the 0.236 Fibonacci retracement, High Volume Node support + the trend-line retest, $14. This may also meet the ascending daily 200EMA.
Daily RSI has a series of bearish divergence from overbought which a strong signal for a reversal.
Continued upside could run the daily pivots to $38.

BTDR Consolidation below support often leads to a breakoutNASDAQ:BTDR Locally, price is struggling at the expected High Volume Node resistance but without a major rejection. Consolidation below resistance often leads to a breakout
Wave (3) characteristics are being followed with shallow pullbacks so far. The target for a stronger downwards move is the golden pocket and S1 pivot at $17 which would meet the rising daily 200EMA, adding confluence to a local bottom. This would be normal and should be expected.
Daily RSI has printed unconfirmed bullish divergence at the EQ.
Continued upside would flip $25 resistance into support.

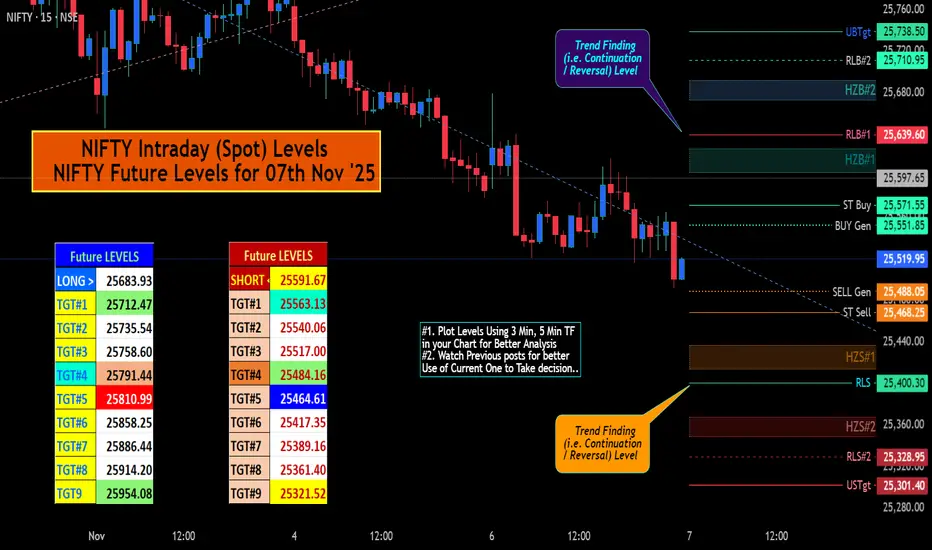
NIFTY IntraSwing (Spot) & Future Levels for 07th Nov '25✍🏼️ "Future IntraSwing Levels" mentioned in BOX format.
✍🏼️ "WEEKLY Levels" follow Sunday / Saturday's Post.
L#1: If the candle crossed & stays above the “Buy Gen”, it is treated / considered as Bullish bias.
L#2: Possibility / Probability of REVERSAL near RLB#1 & UBTgt
L#3: If the candle stays above “Sell Gen” but below “Buy Gen”, it is treated / considered as Sidewise. Aggressive Traders can take Long position near “Sell Gen” either retesting or crossed from Below & vice-versa i.e. can take Short position near “Buy Gen” either retesting or crossed downward from Above.
L#4: If the candle crossed & stays below the “Sell Gen”, it is treated / considered a Bearish bias.
L#5: Possibility / Probability of REVERSAL near RLS#1 & USTgt
HZB (Buy side) & HZS (Sell side) => Hurdle Zone,
*** Specialty of “HZB#1, HZB#2 HZS#1 & HZS#2” is Sidewise (behaviour in Nature)
Rest Plotted and Mentioned on Chart
Color code Used:
Green =. Positive bias.
Red =. Negative bias.
RED in Between Green means Trend Finder / Momentum Change
/ CYCLE Change and Vice Versa.
Notice One thing: HOW LEVELS are Working.
Use any Momentum Indicator / Oscillator or as you "USED to" to Take entry.
⚠️ DISCLAIMER:
The information, views, and ideas shared here are purely for educational and informational purposes only. They are not intended as investment advice or a recommendation to buy, sell, or hold any financial instruments. I am not a SEBI-registered financial adviser.
Trading and investing in the stock market involves risk, and you should do your own research and analysis. You are solely responsible for any decisions made based on this research.
"As HARD EARNED MONEY IS YOUR's, So DECISION SHOULD HAVE TO BE YOUR's".
Do comment if Helpful .
In depth Analysis will be added later (If time Permits)
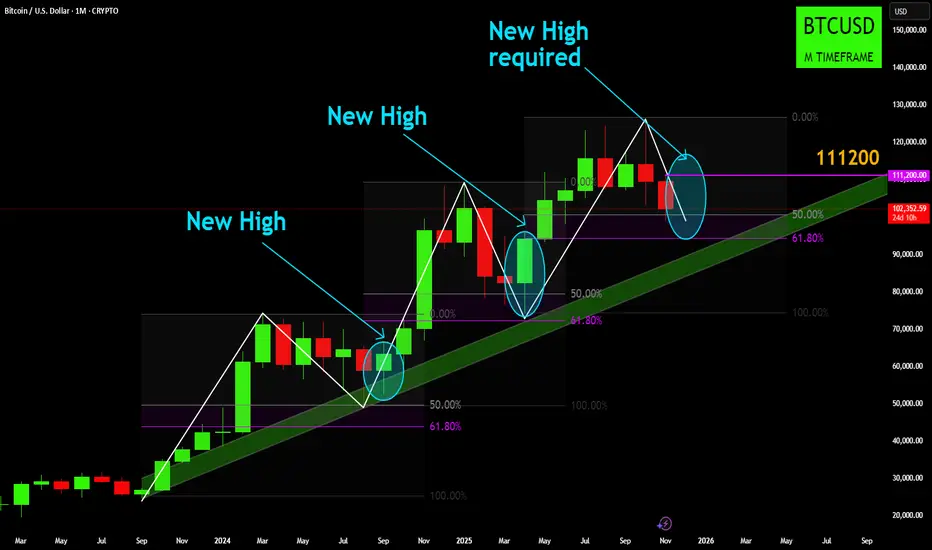
BTC Monthly: Awaiting Bullish Confirmation from Golden Zone
BTC Monthly: Awaiting Bullish Confirmation from Fibonacci Golden Zone
Hello, traders. This is a high-level, monthly-timeframe analysis of Bitcoin's macro trend.
This idea is based on a clear, repeating pattern that has defined the bull market since September 2023. By understanding this larger structure, we can better frame the current volatility and identify what to look for as confirmation of the next major leg up.
🔍 The Core Analysis
On the monthly chart, BTC's bullish trend has followed a consistent blueprint:
A strong impulse move up.
A corrective pullback into the Fibonacci "Golden Zone" (the area between the 50% and 61.8% retracement levels).
A period of consolidation in this zone, where support is found.
A breakout from this zone, leading to a New High and continuation of the trend.
As you can see from the chart, this "pullback-and-breakout" pattern has happened twice already during this uptrend.
📍 Where We Are Now
Currently, we are at a critical juncture. After posting a significant new high (around $128,000), the price has once again entered a corrective phase.
Price is currently testing the 50% Fibonacci level at approximately $102,404.
This places us squarely back inside the "Golden Zone," the same area that has acted as a support and springboard for price in the past.
🐂 The Bullish Thesis (Confirmation)
For the long-term bullish trend to be confirmed, the pattern must repeat:
Support must hold within this 50% - 61.8% Fib zone.
The price must eventually break out of this corrective structure and create a New High above the previous peak.
This new high is the required confirmation that the pullback is complete and the macro uptrend is continuing.
🐻 The Corrective/Volatile Phase (The "Wait")
Until that new high is formed, we must respect the current market phase.
Price is technically in a "pullback mode."
This means we should expect continued volatility. Price can easily fluctuate for weeks, or even months, within this corrective zone before a clear direction is established.
A break below the 61.8% Fib level on a monthly closing basis would be a significant warning sign and would challenge the validity of this entire bullish structure.
⚠️ Important: A Macro View
This is a Monthly Chart. Each candle represents 30 days of price action.
This analysis is ideal for a long-term perspective (investors, position traders) to understand the bigger picture.
It is NOT suitable for short-term trading. The moves within this "golden zone" can still be tens of thousands of dollars.
This same concept (impulse, Fib pullback, new high) can be applied to shorter time frames (like the Daily or 4-Hour) to find short-term trade setups, but this specific chart is strictly a macro view.
Disclaimer:
The information provided in this chart is for educational and informational purposes only and should not be considered as investment advice. Trading and investing involve substantial risk and are not suitable for every investor. You should carefully consider your financial situation and consult with a financial advisor before making any investment decisions. The creator of this chart does not guarantee any specific outcome or profit and is not responsible for any losses incurred as a result of using this information. Past performance is not indicative of future results. Use this information at your own risk. This chart has been created for my own improvement in Trading and Investment Analysis. Please do your own analysis before any investments.
AMC SHORT SETUPThere is a strong support at $2.50—.
Stochastic is deeply oversold so I expect a bounce at the support.
The entry for the short I'm looking at is the box between $2.67 and $2.94, which lines up with the downtrend and the fibonnaci levels.
I like to keep the setups simple and low leverage.
Let me know what you think.

EURUSD Technical Setup – Bullish Move Incoming?EURUSD ( FX:EURUSD ) is currently positioned near the lower line of a potential descending channel and is hovering around a Support zone($1.1542-$1.1514) . There's also a smaller descending channel that formed last week, which is something we should consider in our EURUSD analysis .
There's a Regular Divergence (RD+) between the two recent lows that EURUSD has made, which is a good sign of a possible reversal.
In terms of Elliott Wave theory , it appears that EURUSD has completed the main wave 5, with the main wave 3 being an Extended wave . A break of the upper line of the descending channel(small) could confirm the end of the main wave 5.
I expect that EURUSD could at least move up toward the next Resistance zone($1.1586-$1.1575) .
Second Target: $1.1597
Stop Loss(SL)= $1.14857
Please respect each other's ideas and express them politely if you agree or disagree.
Euro/U.S. Dollar Analyze (EURUSD), 1-hour time frame.
Be sure to follow the updated ideas.
Do not forget to put a Stop loss for your positions (For every position you want to open).
Please follow your strategy and updates; this is just my Idea, and I will gladly see your ideas in this post.
Please do not forget the ✅' like '✅ button 🙏😊 & Share it with your friends; thanks, and Trade safe.

XAUUSD XAU/USD – Gold Analysis
Gold is approaching the upper boundary of the descending channel after a strong bounce from the midline support earlier today.
As it nears this zone, price faces a confluence of resistance factors: the descending trendline, the 0.5 Fibonacci retracement, and the upper Bollinger Band.
From this area, I’ll be looking for a short setup, targeting a move back toward the midline of the channel to capture the liquidity left by today’s upward move.
Fundamental Outlook:
The U.S. dollar remains firm as investors continue to favor USD as a safe-haven amid ongoing geopolitical tensions and uncertainty around global growth.
The Federal Reserve’s cautious stance and limited expectations for rate cuts are supporting higher Treasury yields, which typically weigh on gold prices.
However, gold’s safe-haven demand could re-emerge if geopolitical risks intensify or U.S. economic data begins to soften.
For now, the short-term bias remains bearish, with gold under pressure from strong USD fundamentals and technical resistance zones above.
Summary:
📈 Testing major resistance (trendline + 0.5 Fibo + Bollinger top).
📉 Looking for short setups near 4024.
🎯 Target: Mid-channel around 3962.
⚙️ Fundamentals: Strong USD and yields keep gold capped short-term.
💡 Bias: Bearish near resistance, bullish only if price breaks above the channel.

META - At SupportWell, theoretically META is just getting to the support cluster and competing a Crab Pattern. It may be respected and push the price higher, but if... If the markets forget of the poor results and of the fear that AI Rally is actually no more than another bubble... The best way to wait a bit and just see
Just my humble opinion

USDCAD - At ResistanceUSDCAD is just approaching a Resistance Cluster and completing the Butterfly Harmonic Pattern at 1.4146-1.4166. This is in line with the situation on EURUSD, GBPUSD and USDJPY.
I expect the price to perform a correction down to 1.3914 and then revert to uptrend.
Just my humble opinion
