BAJAJ CONSUMER – Multi-Year Breakout | Can Upside Resume?🟦 BAJAJ CONSUMER – Multi-Year Breakout | Can Upside Resume?
Bajaj Consumer Care is attempting a multi-year breakout. After touching the ₹320 zone again (last seen in 2021), the stock is showing signs of renewed strength.
📊 Technical Structure
• Multi-year resistance near ₹320 tested
• Long-term trendline + horizontal resistance broken
• Sustaining above breakout zone can lead to strong upside acceleration
• Structure is bullish but volatile, given global cues
💰 Trade / Positional Plan
• CMP: ₹320
• Stop Loss: ₹240
🎯 Targets
• ₹368
• ₹468
• ₹522 (post-confirmation expansion)
📌 Trading Approach
• Prefer staggered entry
• Strict position sizing control
• Longer-term structure, not a chase
• Impatience = forced cut if sharp pullback comes
⚠️ Clarification:
This is an independent technical analysis. No part of Religare is involved in this view or recommendation.
📝 Important:
I am not responsible for any loss or profit incurred. No fees charged – shared purely for educational and informational purposes.
📉 Disclaimer:
Not SEBI-registered. Please do your own research or consult a financial advisor before taking any investment decision.
✅ Sustain above 320 = strength. Time + patience will decide the magnitude.
Fibonacci

TXN - The Move ContinuesSince November 2018, a large wave 3 has been developing.
Within this wave, only the fifth sub-wave remains to be completed, and the impulsive move has already begun.
Key targets:
238 - local pullback
270
296
Estimated upside potential from current levels:
25–37%
---
Please subscribe and leave a comment!
You’ll get new information faster than anyone else.
---

GOLD - Correction ahead of the Fed meeting. What next?FX:XAUUSD hit a new high of 5311 and entered a correction phase (profit-taking) ahead of the Fed's interest rate meeting...
Fundamental situation
Tensions between the US and NATO over plans for Greenland. Trump's threats to impose 100% tariffs on goods from Canada. Fruitless negotiations between Russia and Ukraine
Fed:
Expectations that rates will remain unchanged at the January 31 meeting. Powell's tone and the appointment of a new Fed chair (announcement possible today) could increase volatility. However, the market is pricing in two Fed rate cuts in 2026, despite a possible pause in the near term.
US consumer confidence index fell to an 11.5-year low (84.5), supporting demand for gold
Resistance levels: 5285, 5310, 5350
Support levels: 5250, 5230, 5190
Gold maintains its upward momentum thanks to geopolitical risks and expectations of a soft Fed policy. However, news volatility could trigger a correction before the growth continues. Focus on key (marked) support levels.
Best regards, R. Linda!

GBPUSD - The hunt for liquidity before the trend continues FX:GBPUSD entered a local correction phase amid a pullback in the dollar after a strong rally. The main trend is bearish, and growth after the correction may continue.
A correction has been forming since the opening of the session. The dollar is recovering slightly, while the pound is correcting towards the daily level of 1.377 and the Fibonacci area of 0.5-0.6. If the bulls hold back the correction, the market may return to the trend.
The main/medium-term trend is bullish. The correction and false breakout of support may shift the imbalance of forces towards buyers, which could trigger growth from strong levels.
Resistance levels: 1.3831, 1.38688
Support levels: 1.377, 1.3748
A false breakdown of support and the upward trend line could trigger growth within the main trend
Best regards, R. Linda!

NTPC – Pre-emptive Upside Turnaround Setup🟦 NTPC – Pre-emptive Upside Turnaround Setup
NTPC is showing early signs of a potential upside turnaround. This is still a pre-emptive structure, so discipline matters more than speed.
📊 Technical View
• Trading in a range of ₹350–₹370
• Box breakout likely above ₹370 (range held since April 2025)
• Key resistance: 61.8% Fib at ~₹388 → may cause a pause
• Sustained move above ₹388 can open higher momentum
💰 Trade / Positional Plan
• CMP: ₹359
• Stop Loss: ₹312
• Targets: ₹389 → ₹447
📌 Approach
• Prefer staggered entry
• Strict position sizing control
• Longer-term structure, not a chase
• Impatience = forced cut if sharp pullback occurs
⚠️ Clarification:
This is an independent analysis. No part of Religare is involved in this view.
📝 Important:
I am not responsible for any loss or profit incurred. No fees charged – shared for educational purposes only.
📉 Disclaimer:
Not SEBI-registered. Please do your own research or consult a financial advisor before taking any investment decision.

Gold ATH after FOMC: Reaction or New Wave?Before the FOMC meeting, the market shared the same question:
would gold rally ahead of the meeting and then face a sharp sell-off afterward, or continue breaking higher and extend the trend?
After the FOMC, the Fed kept interest rates unchanged — which was not a surprise.
What really mattered was the Fed’s tone, and Powell clearly chose a balanced stance:
neither too dovish nor too hawkish.
More importantly, the Fed has effectively ruled out further rate hikes, while still maintaining a high interest-rate environment.
As a result, gold did not experience a heavy sell-off after the FOMC, and continues to hold its structure near the highs.
At this stage, market focus is shifting toward external risk factors:
The risk of a U.S. government shutdown
U.S.–Iran tensions
Ongoing trade war risks with major partners
Questions surrounding the independence of the Fed
👉 The current macro backdrop is not bearish for gold.
👉 SELL setups are reactionary, not the core narrative of the trend.
⏱️ H1 Observation Range
Lower bound: 5,415
Upper bound: 5,600
Price is consolidating near the highs with a wide range and may gradually push toward higher round-number levels.
🟢 Support / BUY zones
5,505 – 5,410 – 5,310 – 5,250 – 5,100
🔴 Resistance / Key observation zones
5,660–5,665 – 5,700 – 5,800 – 6,000
🧠 Primary scenario
Wide volatility → risk management is key.
SELLs are only short-term reactions at resistance.
BUY pullbacks to support to ride the broader move, not to pick the top.
⚠️ Key notes for the current phase
Reading the chart is a skill.
Reading the Fed is a strategy.
Reading Trump’s statements is survival.
Markets don’t reward being right —
they reward discipline and alignment with the trend.
👉 SELL to react — BUY to stay in the game.
📌 Follow me to track macro scenarios, key price levels, and the ongoing journey of finding opportunities in the market.

OIL INDIA – Upside Setup Building🟦 OIL INDIA – Upside Setup Building with Global Support
Oil India is showing positive structure, supported by rising crude prices and improving global cues.
📊 Technical View
• Sustaining above 38.2% Fibonacci retracement
• Contraction pattern formed → often precedes breakout
• Momentum supportive, but stock has run up sharply in the last week
• Risk of short-term volatility remains
💰 Trade / Positional Plan
• CMP: ₹514
• Stop Loss: ₹387
• Targets:
• ₹592
• ₹767 (longer-term structure target)
📌 Trading Approach
• Prefer staggered entry
• Control position sizing strictly
• This is a longer-term structure, not a chase
• Impatience = forced cut if sharp pullback occurs
⚠️ Clarification:
This is an independent analysis. No part of Religare is involved in this view or recommendation.
📝 Important:
I am not responsible for any loss or profit incurred. No fees charged – shared for educational purposes only.
📉 Disclaimer:
Not SEBI-registered. Please do your own research or consult a financial advisor before taking any investment decision.

NQ Power Range Report with FIB Ext - 1/29/2026 SessionCME_MINI:NQH2026
- PR High: 26296.00
- PR Low: 26160.00
- NZ Spread: 304.25
Key scheduled economic events:
08:30 | Initial Jobless Claims
Session Open Stats (As of 12:15 AM)
- Session Open ATR: 364.28
- Volume: 44K
- Open Int: 261K
- Trend Grade: Long
- From BA ATH: -1.5% (Rounded)
Key Levels (Rounded - Think of these as ranges)
- Long: 26521
- Mid: 25264
- Short: 24008
Keep in mind this is not speculation or a prediction. Only a report of the Power Range with Fib extensions for target hunting. Do your DD! You determine your risk tolerance. You are fully capable of making your own decisions.
BA: Back Adjusted
BuZ/BeZ: Bull Zone / Bear Zone
NZ: Neutral Zone

Usdcad potential long setup?This count is based on my assumptions so anything can happen not a trading or financial advice just for educational purposes only kindly do your own ta thanks trade with care good luck.

WDC - Looking for a Completion PointContinuing the idea from the previous analysis.
If we take a closer look at the chart, most corrections are zigzags .
Therefore, the move starting from November 2025 can be considered the beginning of a five-wave structure.
This means we may expect the move to complete slightly higher than previously anticipated.
Key targets:
250
270
Most importantly, you’ve been warned - the final decision is always yours.
---
Please subscribe and leave a comment!
You’ll get new information faster than anyone else.
---

ONGC- IHS Breakout StronglyONGC-29-01-2026: CMP : 268..
Why it raised 10% yesterday.. Intl oil prices increased...
Break of IHS pattern..
Upside targets mentioned. As per standard, can expect a retest to neckline..

Carvana - Wave CWe are analyzing the move starting from November 2025.
The five-wave upward structure has been completed.
We are now in the corrective phase, which we consider a r egular flat.
Waves A and B are already in place, and wave C has started to develop.
Wave C is expected to unfold as an impulse to the downside.
Key targets:
411 - local correction level
387 / 372 - potential reversal zones
---
Please subscribe and leave a comment!
You’ll get new information faster than anyone else.
---

Usd/Cad Buy Idea ( countertrend trade ) USD/CAD Buy Setup 📈
Stop Loss: 1.35300
Take Profit: 1.36245
USD/CAD is currently respecting a downtrend parallel channel. Price recently tapped the lower boundary of the channel and is now showing a clear reaction from that area.
Dropping down to the 15-minute timeframe, price formed a new higher high, signaling short-term bullish momentum. This is where I looked for a short-term buy opportunity, while on the H1 and H4 timeframes I’m still expecting a deeper pullback within the overall structure.
This trade is focused on capturing the intraday reaction move from channel support rather than a full trend reversal.
I will post the 15 minute set up here

AUD/USD Seven-Day Rally Hits Resistance- Bulls Eye Test at 70A seven-day rally extending nearly 5.4% off the monthly lows. The advance is testing confluent resistance today ahead of the Fed rate decision at 7009/17- a region defined by the 100% extension of the November advance and the objective 2020 yearly open. Note that the upper parallel of an ascending pitchfork converges on this threshold and a breach / daily close above this slope is needed to fuel the next major leg of the Aussie advance. Look for a reaction off this mark into the close of the week for guidance.
AUD/USD has been trading within the confines of an embedded channel formation (red) extending off the January 18 low with the upper bounds further highlighting near-term resistance here today. Initial support rests with the 2024 swing high at 6943 and is backed by the weekly open / 2024 high close at 6896-6913. A break / close below this threshold would threaten a larger setback within the broader uptrend with medium-term bullish invalidation now raised to the 2023 & 2024 yearly opens at 6811/17. Losses below this zone would suggest a more significant high is in place and a larger reversal is underway.
A topside breach / close above the upper parallel would expose subsequent resistance objectives at the 2023 high-day close (HDC) at 7077 and the August 2022 swing high at 7137. The next major technical consideration is eyed at the 100% extension of the broader April advance at 7214- look for a larger reaction there IF reached.
Bottom line: The AUD/USD rally has extended into confluent uptrend resistance ahead of today’s Fed rate decision and the focus on possible inflection off this zone. From a trading standpoint, a good zone to reduce portions of long-exposure / raise protective stops- losses should be limited to 6896 IF price is heading higher on this stretch with a close above the upper parallel needed to fuel the next major leg of the rally.
-MB

GOLD: Breaking the Circle , Road to 7.5K This is a 3-month timeframe view of Gold using Fibonacci Circles to understand the longterm trend.
Fibonacci circles help show where price builds pressure, slows down, and then expands. For many years, Gold stayed inside these circles. Every rally and pullback respected them. When price remained inside, the market was in compression. When a circle was broken, a strong move followed.
Gold has clearly broken above the 5,000 Fibonacci circle.This level was not just resistance. It was a major boundary. This behavior signals the start of a new expansion phase.
What This Means for Gold?
Above 5,000
- Gold is in long-term price discovery.
-Old resistance levels lose importance
-Buyers stay in control on higher timeframes
As long as price stays above the 5,000 circle, the bullish structure remains valid.
7,500 - Next Fibonacci circle and main expansion target
9,200 - Outer circle and full macro extension if momentum continues
These are long-term roadmap levels, not short-term trade calls.
Gold has left the range behind.
The road to 7.5K is now in play.

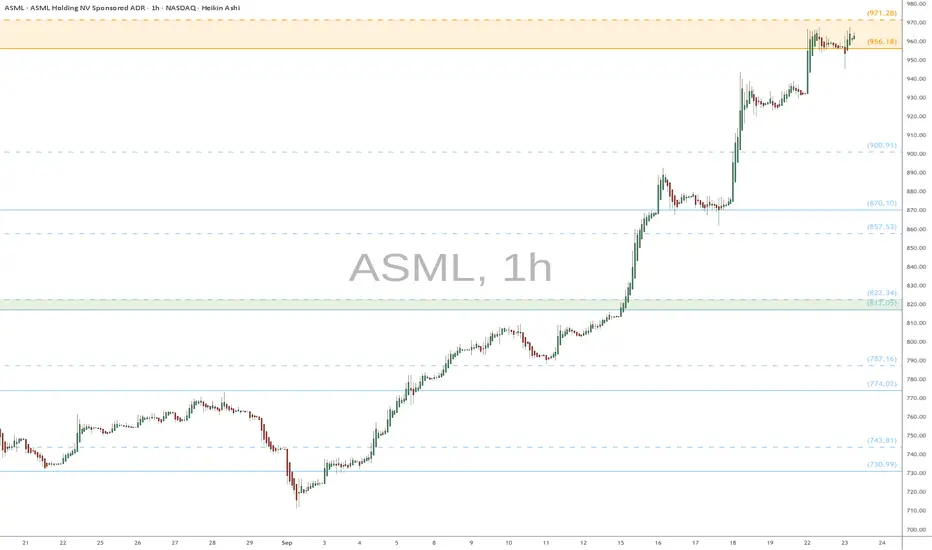
ASML watch $956-971: Double Golden fibs may give a DIP to buyASML has been growing in spurts along with the semi's.
It has just hit a Double-Goldden fib zone $956.18-971.28
Looking for a Dip-to-Fib or Break-n-Retest for long entries.
.
Previoius Analysis that nailed the EXACT BOTTOM:
Hit BOOST and FOLLOW for more such PRECISE and TIMELY charts.
========================================================
.
AMD watch $202 below 213 above: Major Golden fibs hold the surgeAMD got a monstrous surge from deal with OpenAI
Touched its ATH and retraced into a double Golden zone.
Expending to consolidate within the range then break.
$ 213.76 is a Golden Genesis above.
$ 202.82 is a Golden Covid fib below.
$ 217.05 is a minor Covid and was ATH.
.
See "Related Publications" for previous plots such a as this recent TOP CALL:
Hit BOOST and FOLLOW for more such PRECISE and TIMELY charts.
We post timely updates with accurate mapping of trade targets.
========================================================
.

TCS Weekly View ! Monitor for continuation ?TCS Weekly View ! Monitor for continuation ?
Cluster band to watch.

Brent Crude Oil Wave Analysis – 28 January 2026
- Brent Crude Oil broke resistance level 66.00
- Likely to rise to resistance level 68.00
Brent Crude Oil recently broke through the resistance area between the resistance level 66.00 (which has been reversing the price from October) and the resistance trendline of the daily down channel from August.
The breakout of the resistance level 66.00 coincided with the breakout of the 38.2% Fibonacci correction of the downward ABC correction (B) from June.
Brent Crude Oil can be expected to rise to the next resistance level 68.00 (target for the completion of the active impulse wave 3).

BNB Wave Analysis – 28 January 2026
- BNB reversed from support zone
- Likely to rise to resistance level 950.00
BNB cryptocurrency recently reversed up from the support zone between the key support level 870.00 (which has been reversing the price from the start of January) and the lower daily Bollinger Band.
The support level 870.00 was further strengthened by the support trendline of the daily up channel from November and by the 61.8% Fibonacci correction of the upward impulse from December.
BNB cryptocurrency can be expected to rise to the next resistance level 950.00 (which stopped the previous impulse wave i).

UNH: adding into fear after a completed ABC correctionThesis
NYSE:UNH has completed its corrective ABC structure and is stabilizing within Wave 2, offering long-term accumulation opportunities in a proven cash-flow compounder.
Context
- Daily and weekly timeframes
- Deep corrective phase already completed
- Long-term uptrend remains intact on the weekly chart
- Dividend-paying, high free-cash-flow defensive name
What I see
- Yesterday’s selloff was headline-driven, not structural
- Price is holding inside the Wave 2 retracement zone
- Volatility is shaking out weak hands, not breaking structure
- This behavior is typical at the end of corrective phases
- I added to my long-term position yesterday, bringing my average into the $270s
What matters now
- The priority is stabilization and base-building
- A reclaim of the 50-day MA improves short-term structure
- Reclaiming the 200-day MA confirms the next impulsive leg
- Gap-filling narratives are noise, not a strategy
Buy / Accumulation zone
- Accumulation remains valid inside the current Wave 2 range
- I have no issue adding again once price stabilizes
- Risk is defined against the recent correction lows
Targets
- First major structural reference: 200-week MA near $460
- Wave 3 target remains the 1.618 Fib extension around $540
- Dividend yield (~2.6%) pays while waiting
Execution note
- This game isn’t for everyone — pressure exposes conviction
- I added at $250 and $240 when sentiment was darkest
- Buffett added at higher prices, yet fear returned instantly
- NYSE:UNH is my current safe-haven: strong FCF, cash-rich, defensive
This is a 3–5 year hold for me, not a short-term trade

EURUSD Short: Approaches Supply - Pullback Short Setup in FocusHello traders! Here’s a clear technical breakdown of EURUSD (3H) based on the current chart structure. After a strong bullish impulse and a confirmed breakout from the descending channel, EURUSD has moved aggressively higher inside a newly formed ascending channel. This impulsive rally signals strong buyer dominance in the short term; however, price is now approaching a key Demand-to-Supply transition area around 1.1790–1.1830, which previously acted as a significant reaction zone. The sharp upside move has created a near-vertical leg, increasing the probability of a temporary pullback due to overextension and profit-taking.
Currently, price is testing the upper portion of the ascending channel while simultaneously reacting to prior structure resistance. The rejection candles forming near this area suggest that bullish momentum is slowing, and buyers may be losing short-term control. This behavior often precedes a corrective retracement rather than a full trend reversal, especially after such an impulsive move. From a structural perspective, the zone around 1.1830–1.1870 aligns with a higher-timeframe Supply Zone, making it a logical area for sellers to step in. A bearish reaction from this region could trigger a pullback toward the mid or lower boundary of the ascending channel, where fresh demand may later re-enter.
My scenario: In my opinion, after a strong impulse, a corrective pullback to the level of 1.1790 (TP!) will follow. This zone aligns with channel support and previous breakout structure, making it a natural target for a healthy retracement (TP1). This short idea is counter-trend and should be treated strictly as a pullback trade within a broader bullish structure. Strong acceptance and continuation above the supply zone would invalidate the short scenario and signal renewed bullish continuation. For now, price is at a critical reaction zone where sellers may attempt to force a correction before the next directional move. Manage your risk!

GBPUSD:Intraday Trading Setup 250+ Pips MoveDear Traders,
GBPUSD showed us the change of character has occurred and now it also has retested the price zone, now it is likely to be heading towards 1.3700 area which in our view is likely to be a next target for GBPUSD. According to the fib placement we can see price reversing from 0.618 point. As stated in the chart that there is only one swing target and stop loss can be placed based on your risk management.
Good luck and thanks for the support throughout these years, also like and comment for more such analysis.
Regards,
Team Setupsfx_
