LITE: at the upper resistancePrice has approached the upper resistance zone: 460–630.
Watching for signs of a topping process to start unfolding in the coming weeks.
Chart (Weekly):
Fibonacci

Particle Network PARTI price analysisWhile the whole crypto market is busy asking “is this the bottom or not?”, CRYPTOCAP:PARTI seems to be living in its own reality 😏
And that’s not surprising.
Particle Network has a market cap of only ~$25M, which means thinner liquidity and much more freedom for market makers to shape price action.
🔍 Scenario:
If OKX:PARTIUSDT gets confirmed above the trendline, for example above $0.086, there are currently very few technical obstacles up to the $0.16+ zone.
That opens the door for a potential x2 move, assuming structure holds.
⚠️ At the same time, low cap means volatility works both ways — fast upside moves, but also sharp pullbacks if momentum fades.
❓ Do you see CRYPTOCAP:PARTI as a controlled breakout in the making, or just short-term noise while the broader market is undecided ?
______________
◆ Follow us ❤️ for daily crypto insights & updates!
🚀 Don’t miss out on important market moves
🧠 DYOR | This is not financial advice, just thinking out loud

GBPUSD 30M – Bullish Breakout After Fib Retracement (0.618)GBPUSD on the 30-minute timeframe shows a strong bullish continuation setup.
Price previously sold off and completed a deep pullback into the Fibonacci retracement zone 0.618, which aligned with a clear demand/support area. This zone held well and price reacted strongly, printing a sharp impulsive bullish move back above structure.
Currently, price has reclaimed the key level around 1.3660, indicating buyers are in control. As long as price holds above the retracement zone, bullish continuation toward the next liquidity and resistance area is favored.
Trade idea:
- Bias: Bullish
- Entry: On pullbacks or confirmation above structure
-Invalidation: Clean break and close below the Fib support zone
Target: Previous highs / next resistance area

AUD/CAD Market Analysis: Macro + Structure [MaB]1. The Macro Context (The "Why") 🌍
Hi traders! Before looking at the candles, let's look at the money.
My fundamental scoring table is giving us a clear signal: we have a +5 differential, pointing toward a Bullish (Moderate) bias that we simply can't ignore. 🏦
Key Factor Analysis:
🏦 Current Rates: Explanation: RBA at 3.6% offers elevated and competitive yields compared to the BOC's mid-low 2.25% stance. Score AUD: +1 | Score CAD: 0
🌍 Economic Regime: Explanation: AUD is in a Reflation regime with accelerating inflation (+0.79%), while CAD shows signs of Stagflation with a borderline 50.9 Manufacturing PMI. Score AUD: +2 | Score CAD: -1
📊 Rate Expectations: Explanation: RBA remains hawkish following a recent +25bp hike; BOC maintains a neutral "prolonged holding" stance. Score AUD: +1 | Score CAD: 0
⚖️ Risk Sentiment: Explanation: Market sentiment is currently neutral for both currencies with no specific bias. Score AUD: 0 | Score CAD: 0
🏛️ COT Score: Explanation: Both currencies show maximum bullishness from speculators with a strong acceleration in long positions. Score AUD: +2 | Score CAD: +2
Currency Score Summary:
Total Score AUD: +6 (Strong Bullish)
Total Score CAD: +1 (Neutral/Positive)
Synthesis:
💡 AUD (Very Strong, Score +6): Driven by a hawkish RBA, solid 2.3% GDP, and strong PMI expansion.
💡 CAD (Positive, Score +1): Supported by COT data and target inflation, but weighed down by moderate 1.6% GDP and weak manufacturing.
Conclusion: Given this fundamental backdrop, we are strictly looking for Long setups. Going against this bias would be statistical suicide. 🚫
2. The Technical Setup (The "Where") 📉
Timeframe: 1h | Pair: AUD/CAD
The SMC Market Structure + Price Zones indicator has confirmed our statistical edge. Here’s the probabilistic data from the dashboard:
🚀 Continuation Rate (63.6%): We are currently above the 60% threshold. This confirms a healthy directional trend where continuation has a much higher probability than a reversal.
🔥 Streak Analysis (0): We are currently on impulse number 1 (start of a new cycle).
Expected Streak: 1 | 2 | 3 (Percentile: 55.2%)
Remaining Moves: 1 to 2. This indicates a Young trend.
🔄 Retest & Reaction:
Retest Prob (67.5%): High probability of the price returning to test the demand zone after the Break of Structure (BOS).
BOS/Ret Rate (55.2%): Once inside the zone, there is a solid probability of a positive reaction leading to a new BOS.
🎯 Extension & Projection:
Extension Range: The expected extension for this single leg is between 1.50x and 2.78x (Expected: 1.78x).
Compound Extension (2.45x): This is the total projected move based on the remaining expected impulses.
3. Execution Plan on Chart 🎯
Moving over to the charts, we are using these statistics to define our operational levels:
📍 Entry and Stop Loss: We are placing a limit entry within the Demand Zone 1h (Cyan/Blue Band) . The stop loss is tucked a few pips outside the zone at 0.95023 to protect against structural invalidation.
🏁 Statistical Take Profit: Instead of an arbitrary target, we are leveraging the Compound Extension . We project the target at 2.45x relative to the pullback zone height, aligning with the 0.98553 level. This allows us to capture the full extension projected by the algorithm. 🏆
Trade Parameters:
💰 Entry Price: 0.95583
🛡️ Stop Loss: 0.95023
🏆 Take Profit: 0.98553
⚠️ Disclaimer: This analysis is based on a proprietary algorithm and is shared exclusively for educational and didactic purposes. It does not constitute financial advice or investment solicitation in any way. Trading involves significant risk.

Macro Trend Overview: BTC, SOL, ETH, XRPAcross all major assets, price has approached the first macro-support zones and appears to be in the final stage of multi-month corrective structures from their all-time highs.
At the same time, structural room still exists for one more corrective leg toward deeper macro-support levels.
As long as price remains within the ranges outlined below, the base scenario remains unchanged: completion of the correction phase followed by at least a medium-term recovery period.
BTC
Key macro-support: 62,500–56,200 and 52,600
⸻
SOL
Key macro-support: 81.60–62.5 and 53–48.5
⸻
ETH
Key macro-support: 1,790–1,540 and 1,400
⸻
XRP
Key macro-support: 1.27–1.04 and 0.88–0.85
⸻
Thank you for your attention, and wishing everyone successful trades ahead!

BTC/USD where to GET out !!I’m seeing some resistance for Bitcoin around the 104 level.
Some people are saying a rate cut will push the price higher and trigger a big move afterward. But let’s be honest — rate cuts are already priced in. Any move up from here could easily turn into a trap.
Either way, make sure you’re protecting your capital.
This is your hard-earned money — don’t trade with emotions.

GBPCAD SHORT price pushing into the 50% area at (1.61000) sat just above recent resistance, looking at price grabbing this resistance and liquidity before continuing to downside.

SOL, Finding support for a bottom?CRYPTOCAP:SOL took a hit last week on the capitulation event, printing a strong bottoming candle with a long lower wick.
Price has now reached my wave 4 ytarget of the 0.382 Fibonacci retracement at the major High Volume Node support, between the S1 nd S2 pivot.
Daily RSI hit oversold, but with no divergence. The trend remains down, below the daily pivot and daily 200EMA, but could be finding a bottom soon.
Safe trading

IREN Still lower to complete wave 4NASDAQ:IREN printed another daily bearish divergence in a downtrend, signalling continued momentum to the downside. Price met the 200EMA and caught a bid Friday closing its candle only +5%, a far cry from the competitors last week, considering its volatility, showing weakness.
The narrative and buzz of the bull run is still being sold into as investors are still greedy.
Wave C of 4 has a termina target f the major High Volume Node support and 0.382 Fibonacci retracement, the highest probability area for wave 4 to end, $27.
Daily RSI has room to fall. The daily pivot is lost.
Safe trading

AUD/CHF Market Analysis: Macro + Structure [MaB]1. The Macro Context (The "Why") 🌍
Hi traders! Before looking at the candles, let's look at the money.
My fundamental scoring table is giving us a clear signal: we have a +7 differential, pointing toward a Strong Bullish bias that we simply can't ignore.
Key Factor Analysis:
🏦 Current Rates: Explanation: AUD RBA at 3.6% offers competitive high rates, while CHF SNB remains at 0.0%, the lowest among majors. Score AUD: +1 | Score CHF: -1
🌍 Economic Regime: Explanation: Both currencies are in a Reflation regime, but AUD shows stronger acceleration (+0.79%). Score AUD: +2 | Score CHF: +1
📊 Rate Expectations: Explanation: RBA remains hawkish with a recent +25bp hike, whereas SNB is expected to hold rates for a prolonged period. Score AUD: +1 | Score CHF: 0
⚖️ Risk Sentiment: Explanation: Market appetite is currently neutral with no specific bias affecting these currencies. Score AUD: 0 | Score CHF: 0
🏛️ COT Score: Explanation: Speculators are maximally bullish on AUD with accelerating longs; CHF shows mixed signals despite a strong short position. Score AUD: +2 | Score CHF: 0
Currency Score Summary: Total Score AUD: +6 (Strong Bullish) Total Score CHF: -1 (Weak Bearish)
Synthesis:
💡 AUD (Strong, Score +6): Driven by a hawkish RBA, solid 2.3% GDP, and strong PMI expansion. 💡 CHF (Weak, Score -1): Weighted down by 0.02% deflation, modest growth, and manufacturing contraction (PMI 48.8).
Conclusion: Given this fundamental backdrop, we are strictly looking for Long setups. Going against this bias would be statistical suicide.
2. The Technical Setup (The "Where") 📉
Timeframe: 1h | Pair: AUD/CHF The SMC Market Structure + Price Zones indicator has confirmed our statistical edge. Here’s the probabilistic data from the dashboard:
🚀 Continuation Rate (65.1%): We are currently above the 60% threshold. This confirms a healthy directional trend where continuation has a much higher probability than a reversal.
🔥 Streak Analysis (1): We are currently on impulse number 1.
Expected Streak: 1 | 2 | 4 (Percentile: 20th-80th) Remaining Moves: This indicates a Young trend, suggesting significant room for further appreciation.
🔄 Retest & Reaction:
Retest Prob (75.2%): High probability of the price returning to test the demand zone. BOS/Ret Rate (56.7%): Once inside the zone, there is a solid probability of a positive reaction leading to a new Break of Structure.
🎯 Extension & Projection:
Extension Range: Expected extension for this leg is between 1.61x and 2.72x. Compound Extension (1.75x): This is the total projected move based on the remaining expected impulses.
3. Execution Plan on Chart 🎯
Moving over to the charts, we are using these statistics to define our operational levels:
📍 Entry and Stop Loss: We are placing a limit entry within the Demand Zone 1h (Cyan Band) . The stop loss is tucked a few pips outside the zone to protect against structural invalidation.
🏁 Statistical Take Profit: Instead of an arbitrary target, we are leveraging the Compound Extension . We project the target at 1.75x relative to the pullback zone height.
This allows us to capture the full extension projected by the algorithm. 🏆
Trade Parameters:
💰 Entry Price: 0.53949 🛡️ Stop Loss: 0.53653 🏆 Take Profit: 0.55654
⚠️ Disclaimer: This analysis is based on a proprietary algorithm and is shared exclusively for educational and didactic purposes.
It does not constitute financial advice or investment solicitation in any way. Trading involves significant risk.

CIFR Triangle path played out nicely..NASDAQ:CIFR triangle in wave B played out, following my path closely, touching the daily 200EMA and major High Volume Node support line, at the 0.236 Fibonacci retracement. This is a highly probable place for wave 4 to end.
Triangle are a penultimate pattern, so that thrust lower last week should mark the end of the downtrend.
There is no divergence in the daily RSi and has a little room left to hit oversold but can do so on a bullish divergence without a new low.
Price closed Fridays candle at the highs +16% showing consumer confidence to hold over the weekend news cycle.
Safe trading

COIN, Elliot wave degree changed, Wave 2 complete?NASDAQ:COIN has a larger sell off then expected completely falling out of its rising wedge. This suggests that the top was a wave 1, completing 5 wave ups diminishing with wave V, with a poke above all time high, IPO launch.
The Elliot wave count is textbook. Wave C of 2 looks to have complete 5 waves down, just below the weekly 200EMA at the major High Volume Node support, 0.382 Fibonacci retracement. While the trend remains down and below the weekly pivot I think Friday was a capitulation event and we move up from here. Theres always a sweep of the lows possible first.
Friday closed at the daily candle high, showing investor confidence to hold over the weekend news and BTC price cycle.
Weekly RSI is tapping oversold, with slight hidden bullish divergence.
Safe trading

HBAR Macro Chart, Wave 2 complete, ATH incoming?CRYPTOCAP:HBAR wave C of 2 ended in the expected area, the 0.786 Fibonacci retracement of wave 1, at a high volume node. This is the altCoin golden pocket where low-caps have the highest probability of reversing from. A long weekly lower wick was left on daily bullish engulfing candles.
If that was wave 1 then wave 3 should be powerful and take price into all-time high and beyond, with targets of the weekly R3-R5 pivots, $0.6-$0.8.
Weekly RSI has a little room to push lower into oversold but also gives it roo to produce a weekly bullish divergence. First target s the weekly pivot at $0.2.
Safe trading

ONDO Wave 2 survived, just...LSE:ONDO is having a significant pullback compared to other alts despite the RWA narrative, which is frustrating.
It came just shy of making a lower low, but did not make one, keeping wave 2 alive.
A bottom is likely in on crypto, let's see if Ondo can come back to life or if it shows relative signs of weakness.
Safe trading

RIOT entering Wave (3) of 3 of III?This will be crazy if so...NASDAQ:RIOT has been trying to go on a tear for months, but keeps getting knocked back by broader economic and BTC uncertainty.
Price is testing the weekly 200EMA and previous range trend-line with RSI printing bullish divergence at the EQ, a bullish sign. Price recovered the weekly pivot, leaving a long lower, bottoming wick. All of this is just above the golden pocket Fibonacci retracement.
It closed Friday at the high of a 20% candle. Closing at the high on a Friday is a significant move as it shows investors are confident in holding over the weekend news cycle and Bitcoin price action.
Elliot Wave (3) of 3 of III will be crazy fast and bullish, hitting my $80 target at the very least.
Safe trading

CLSK Still in a triangle, nothing change on the weekly/macroNASDAQ:CLSK remains firmly in the macro triangle boundaries and has not penetrated wave E on last weeks dumping price action.
In fact, wave (2) is still alive and now printing weekly bullish divergence!
Fib depths for the triangle remain deep 0.786+ which is a characteristic of triangle.
Price left a long lower wick and Friday closed at the high of a 22% bullish engulfing daily candle. Closing at the high on a Friday is a significant move as it shows investors are confident in holding over the weekend news cycle and Bitcoin price action.
The goal is still to break wave D to end the triangle and thrust us in our final move to take profits around $40. This will be highly likely one we get back above the weekly pivot and 200EMA ~£14.
Safe trading

MSTR has likely found a bottomNASDAQ:MSTR has a huge bullish engulfing candle on Friday, 26% closing at the high. CLosing at the high on a Friday is a significant move as it shows investors are confident in holding over the weekend news cycle and Bitcoin price action.
Saylor continues buying weekly including today, now lowering his cost average as he below. He still has 2 years worth of USD to survive a pro-longed bear market and STRC continues to give him more capital.
Wave 4 hit the 0.5 Fibonacci retracement where it can not go beyond, per the rules. Any lower would invalidate the Elliot wave count and it would become wave 2. Which means wave 3, the most powerful is still to come....
Weekly RSI printed a huge bullish divergence at a major High Volume Node resistance in oversold, with a long lower wick being left. You cant get better bottoming signals than all of these confluences.
MSTR may be a good proxy for judging BTC bottoms moving forward, following institutional flows.
All of this said, the trend is down, the weekly 200EMA and pivot are lost. Don't fade the trend, wait for the reversal signal in price action. Overcoming these 2 areas is the first challenge to cement a new bullish trend in place.
Safe trading

FDAX1!So i took this trade becasue t hit 2 out f 3 of mu confirmations and thats the mistake i made 2 out of 3. For those who want to take it . wait for the 1 hour candle to close out side of confluence. Everything else is good its just that 1 tiny bit that remains.

Gold – Correction Over?Precious metals markets have been volatile to say the least in the last 2 weeks, but could the downside correction for Gold be over?
At this point last Monday Gold prices were in the throws of a meltdown which had seen prices reverse from a record high of 5598 registered on January the 29th to a low of 4403. Since then, while price action has been extremely choppy, prices have moved higher again, briefly touching a peak at 5047 this morning before slipping back lower to trade +1% at 5010 at the time of writing (0730 GMT).
There are currently a lot of drivers impacting Gold. Data released over the weekend showed that the Chinese central bank (PBOC) bought for the 15th month in a row, and Bloomberg reported only this morning that Chinese regulators have advised financial institutions to rein in their holdings of US treasuries, which could add to Gold’s appeal as a safe haven asset.
Not only that, Sunday’s landslide election win for Japanese PM Sanae Takaichi on a mandate of tax cuts and higher spending have renewed concerns about the sustainability of government finances in the developed economies, something that could add to demand for precious metals, and Gold in particular, as debasement assets. For this reason, the announcement of new fiscal measures from the Japanese government may be heavily scrutinised and could impact the direction of Gold.
Looking forward, tensions between US and Iran seem to have eased in the short term, after talks recent talks between the two nations ended with a more positive tone, although the US maintains a heavy military presence in the region. Traders may be keen to see how this story progresses across this new week, with President Trump meeting the Israeli President on Wednesday and further talks between US-Iranian delegations also a possibility.
US economic data could also be important with the delayed US Non-farm Payrolls release now due at 1330 GMT on Wednesday and the next CPI reading due on Friday (1330 GMT). Both these releases have the potential to change market expectations for Federal Reserve interest rate moves in the first half of 2026 and could add to Gold price volatility heading into Friday’s close.
Gold Technical Update: Is the Correction Over?
Gold’s more than 21% liquidation from the 5598 January 29th all-time high caught many investors off guard due to both its speed and extent. However, the decline did reach a potential long‑term support zone at 4425, which aligns with the 50% Fibonacci retracement of the entire June 30th 2025 to January 29th 2026 rally.
As the chart above shows, it was this long‑term 4425 retracement support that successfully held the decline, a level from which prices have since recovered. This could reinforce 4425 as a key longer term support level going forward.
With some uncertainty still dominating sentiment in Gold, it could be useful to identify potential key support and resistance levels that may be in focus for the week ahead to help gauge where the next directional risks may lie.
Potential Support Levels:
While 4425 remains the key long‑term support, Friday’s strong rebound from the 4655 low suggests this may act as initial support in the week ahead. A close back below 4655 could warn of renewed weakness and a potential retest of the 4425 retracement level.
While not a guarantee of continued weakness, a close below 4425 could then increase the risk of further downside, opening scope toward the next support at 4150, which is the 61.8% retracement. A break below the 4150 level on a closing basis could extend losses toward 3887, which is the October 28th extreme.
Potential Resistance Levels:
While the 4655 and 4425 supports continue to hold any future price declines, further attempts to push higher remain a possibility. Any such strength could shift attention to the first potential resistance at 5092, which is the February 4th high. How this level is defended on a closing basis could be key.
If Gold prices were to close above 5092 in the coming week, further upside attempts could be possible. Such a break could shift focus back toward the 5598 all‑time high from January 29th, although that level may still act as strong resistance.
The material provided here has not been prepared accordance with legal requirements designed to promote the independence of investment research and as such is considered to be a marketing communication. Whilst it is not subject to any prohibition on dealing ahead of the dissemination of investment research, we will not seek to take any advantage before providing it to our clients.
Pepperstone doesn’t represent that the material provided here is accurate, current or complete, and therefore shouldn’t be relied upon as such. The information, whether from a third party or not, isn’t to be considered as a recommendation; or an offer to buy or sell; or the solicitation of an offer to buy or sell any security, financial product or instrument; or to participate in any particular trading strategy. It does not take into account readers’ financial situation or investment objectives. We advise any readers of this content to seek their own advice. Without the approval of Pepperstone, reproduction or redistribution of this information isn’t permitted.

XAUUSD (15min) UpdateXAUUSD is currently consolidating after a clear shift in market structure, suggesting a pause before the next directional move. Price may retrace deeper into the highlighted bullish order block to mitigate inefficiencies and grab sell-side liquidity. If buyers step in with confirmation from this zone, a continuation to the upside becomes likely, targeting the weak highs and the overhead supply area.
Failure to hold the order block would invalidate the bullish scenario and could open the door for deeper downside. As always, patience and confirmation are key.

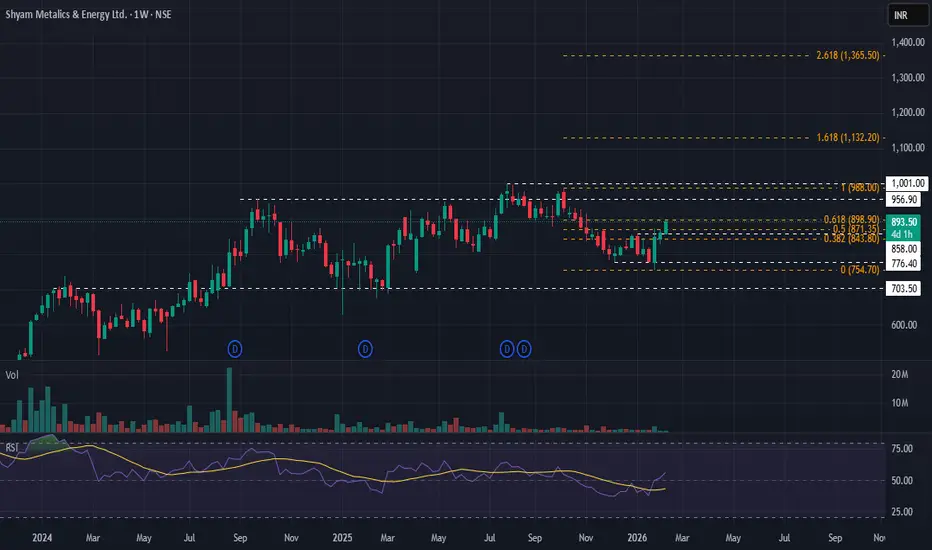
SHYAM METALICS & ENERGY – Upside Momentum Building🟦 SHYAM METALICS & ENERGY – Upside Momentum Building
Shyam Metalics and Energy is showing signs of upside momentum after a prolonged corrective and consolidation phase.
💰 Trade / Positional Plan
• CMP: ₹895
• Stop Loss: ₹774
🎯 Targets
• ₹958
• ₹1011
• ₹1132
📊 Technical View
• Stock remained in a broad range of ₹703–₹956 for ~6 months
• After falling from ₹988 → ₹754, price is now near 61.8% Fibonacci (~₹898)
• Holding and sustaining near this zone suggests strength returning
• Price action indicates potential range breakout and trend resumption
• If momentum sustains, structure can attempt fresh highs over time
📌 Trading Approach
• High volatility → keep quantity in check
• Prefer staggered entry
• Strict position sizing
• Patience trade, not a chase
• Avoid reacting to news flow; respect SL
⚠️ Clarification: Independent analysis. No part of Religare involved.
📝 Important: No responsibility for profit/loss. No fees charged.
📉 Disclaimer: Not SEBI-registered. Please do your own research.
✅ Range contraction + Fib support = potential upside, discipline decides outcome.
GBPCAD SHORT GBPCAD looking at moving lower after tapping the 1.86000 level again in Asia session, looking at the bearish trend continuing down to 1.84000.
price in a 15 minute range from 1.86000 to 1.854000, if price breaks the bottom range we look good to continue down.
political pressures bearish bets a long with a dovish tilt on Thursday weighing on the pound.

ETHUSD Market Analysis: Macro + Structure [MaB]1. The Technical Setup (The "Where") 📉
Timeframe: 15m | Pair: ETHUSD
The SMC Market Structure + Price Zones indicator gave us the confirmation we needed for our statistical edge. Look at the dashboard, numbers don't lie:
🚀 Continuation Rate (73.9%): We are well above the 60% threshold. This tells us the market is in a healthy, directional trend. Statistically, betting on continuation pays off more than looking for a reversal.
🔥 Streak (0): We are at the start of a potential new cycle after the recent BOS.
🔄 Retest (70%): The indicator tells us that statistically, when price creates a new Break of Structure (BOS), it retraces into the previous zone 70% of the time.
💥 BOS/Ret Rate (64.2%): This parameter tells us that once price retraces inside the previous zone, it has a high probability of reacting and creating a new BOS.
🎯 Extension Rate (1.65 - 3.3x): The algorithm projects an ambitious target. We expect this move to extend at least 1.65 times the current pullback leg.
2. Execution Plan on Chart
Moving to the chart, the SMC Market Structure + Price Zones indicator supports us in pinpointing liquidity to define entry and stop loss:
Entry and Stop Loss: We place a limit entry in the Supply Zone 15m (Red Band) at the 0.5 Fibonacci level and the stop loss above the zone.
Take Profit: We leverage the asset's statistical analysis offered by the Extension Rate and place the target at 1936.1 .
Trade Parameters:
Entry Price: 2071.3
Stop Loss: 2097.6
Take Profit: 1936.1
⚠️ Disclaimer: This analysis is based on a proprietary algorithm and is shared exclusively for educational and didactic purposes. It does not constitute financial advice or investment solicitation in any way. Trading involves significant risk.
