GOLD → Consolidation in the ATH zone. Risk zone...FX:XAUUSD hit a new all-time high of around $3,550 as investors worldwide rushed to safe-haven assets. As prices rise, the risk of profit-taking increases, especially with news coming up...
The key driver is the crisis in the bond market: long-term government bond yields are rising sharply in the UK and Japan. This is boosting demand for gold as a safe haven. We should also not forget about expectations of Fed easing: weak employment data could increase bets on a rate cut in September.
However, strong US employment data (starting with JOLTS today) could support the USD and limit gold's growth.
Correction: Record levels could trigger profit-taking, especially given that the price has come a long way since the last pullback, rising nearly 6% (7 days of growth).
Key factor: US labor market data (JOLTS today, NFP on Friday). Weak figures will strengthen gold, strong ones may cause a correction.
Resistance levels: 3546, 3550, 3575
Support levels: 3526, 3508, 3500
Technically, a retest of resistance at 3342-2246 could lead to a breakout and further growth. However, since the price has stopped updating its highs locally, I do not rule out the possibility of a retest of support at 3529-3526 before further growth. However, a weak reaction to support could lead to the formation of a pre-breakdown base, and a breakdown of support could trigger a decline to 3500.
Best regards, R. Linda!
Fibonacci Retracement

GBPNZD → Retest 2.276 before resuming the bullish trend FX:GBPNZD is testing a key support level as part of a correction after breaking through consolidation resistance. The trend is bullish, and liquidity capture could resume the upward movement.
GBPNZD is testing a strong support level within the uptrend during the correction phase. Against the backdrop of the long-term decline of the NZD, the currency pair has every chance of continuing to grow.
On the daily timeframe, we have a fairly strong upward structure, with the previously broken consolidation resistance and the 0.5f area playing a key role. This tandem hides a liquidity area that could become a driver for the market. A false breakdown of 2.276 could trigger a resumption of growth.
Support levels: 2.276, 2.2682
Resistance levels: 2.2983, 2.3215
The bullish trend may support the main trend. The current correction is a healthy movement within an uptrend that may continue after a pullback and consolidation.
Best regards, R. Linda!

$BTC.D Head and Shoulders Topple to 42%If I were a betting man, this is what the future holds for ₿itcoin Dominance.
A head and shoulders pattern could very well be the eventual topple for CRYPTOCAP:BTC.D as we see it make it's way down to 42% which follows previous cycle's trend.
the RSI shows room for correction back up for one more push.
the 20WMA bearish crossing below the 50WMA will be the nail in the coffin.

GOLD → False breakout at 3500. What next? 3400 or 3600?FX:XAUUSD updates its ATH on the spot market to 3508.5 and forms a false breakout, provoking liquidation and profit-taking. The imbalance in the market is changing, and a deeper correction is possible...
Gold updated its historical maximum above $3500, but faced a correction amid a short-term strengthening of the dollar. The market's attention is focused on the US ISM Manufacturing PMI data, which may determine further dynamics.
Key drivers: The probability of a rate cut in September is estimated at 90%, which supports gold. Pressure on the USD continues due to concerns about the independence of the Fed (pressure from Trump) and geopolitics. The escalation of the Russia-Ukraine conflict (new strikes by the Armed Forces of Ukraine on Russian territory) is increasing demand for defensive assets.
Ahead of the ISM Manufacturing PMI: Forecast — growth to 49 (but remains in the contraction zone). If the data turns out to be weaker, it will strengthen dollar sales and push gold to new records.
Resistance levels: 3485, 3500
Support levels: 3467.6, 3441, 3423
Technically, gold may enter a longer consolidation or correction. If the bears keep the price below 3490-3485, then in the short term, we can expect a decline to the specified support zones. I do not rule out the possibility of a retest of 3500-3505, but at the moment I do not see the potential for the market to continue growing (in the short term!).
Best regards, R. Linda!

WLFIUSDT → Liquidation of hamsters before the rally to 0.3300BINANCE:WLFIUSDT.P is Trump's project. This relatively new coin is demonstrating aggressive and manipulative trading, but there are key areas on the chart that can be used as a guide...
We all know about the manipulative games of Trump's projects ;) and this can be used in trading... The WLFI coin has growth potential, but we need to wait for confirmation. Technically, this is a rather aggressive and manipulative game. A sharp drop and liquidation of all “hamsters” to the 0.25 - 0.20 zone. However, the price has stopped updating lows, volatility is decreasing (consolidation). If the price returns to the range, there will be potential for growth. At the moment, the price is not allowed to fall, consolidation is forming, with resistance at the 0.2521 trigger. The market is testing this trigger... At the same time, Bitcoin is strengthening and may support altcoins...
Resistance levels: 0.2521
Support levels: 0.2250, 0.2042
Technically, if the local structure does not break down and the price continues to storm 0.2520 - 0.255, this could lead to a return of the price to the trading range, which would open up the possibility of growth to 0.33.
The structure will break if the price breaks through the support level of 0.225 - 0.22.
Best regards, R. Linda!

GOLD → One step away from 3500. Consolidation. What next?FX:XAUUSD has been rallying towards 3500 since the opening of the session, and the market has every chance of testing this level. Consolidation or correction may form before the next breakout...
Gold resumed its growth at the beginning of the week, reaching five-month highs around $3480 amid declining risk appetite and expectations of Fed policy easing. Trading activity remains low due to holidays in the US and Canada.
Key drivers : Weak Asian markets and uncertainty surrounding Trump's trade policy are supporting interest in gold. The probability of a rate cut in September is estimated at 90% after last week's PCE data.
Overall, the market maintains its momentum towards record levels ($3500), but low liquidity may increase volatility.
Technically , gold is strongly bullish. The price is striving to test the ATH - 3500. Before that, consolidation or a retest of the 3469-3460 zone may form. The dollar is weak at the moment and continues to trend downward, which generally supports gold.
Resistance levels: 3484.8, 3500
Support levels: 3469.5, 3460
Undoubtedly, after consolidation or correction, gold may reach its target. However, continued growth beyond 3500 may be questionable due to a lack of energy, as the market has spent it to reach 3500. Accordingly, a false breakout of the ATH could trigger a strong profit-taking phase, which in turn could lead to a sell-off and correction.
Best regards, R. Linda!

50% retracement from the top. BNL Analysis
Closed at 89.48 (01-09-2025)
It bounced from 93 till 103 - 104.
Though it has broken its HL but Bullish Divergence is there & also
50% retracement from the top.
Now if the current level is not honored as a Good Support (couple of Bullish
Candles Required), we may witness 72 - 73.
Upside Immediate Resistance is around 104 - 105 (as mentioned earlier.)

Bearish Momentum for Bitcoin!Looking at the Daily Time-frame, we can see that the market structure has been broken. The high formed in the 14th of July, where liquidity was resting, was taken out and immediately price began its down-ward spiral! Within a period of 9 days, the low formed on the 2nd of August was taken out, qualifying that level as a breaker, but a more decisive move took place on the 25th.
Thus we can see, by the unwillingness of price to go above the breaker level, that the market is bearish! Right now, I am waiting for price to reach the 111,855 level to see how price will react.
All the best with your trading.

$SOL Rotation IncomingNow that the CRYPTOCAP:ETH hype has calmed,
it’s almost time for CRYPTOCAP:SOL
to rip the haters face off...
once again🎃

AUDUSD Pullback Toward 0.65000 as Dollar Weakens Ahead of US PCEHey Traders, in today's trading session we are monitoring AUDUSD for a buying opportunity around the 0.65000 zone. AUDUSD is trading in an uptrend, with price currently correcting toward this key support/resistance level.
Structure: The broader bias remains bullish, but price is retracing after recent highs.
Key level in focus: 0.65000 — an important area where buyers may look to step in.
Fundamentals: The US Dollar Index (DXY) is breaking below 98.100 support, pointing to further downside. A bearish DXY combined with bullish Gold strengthens the case for AUDUSD upside.
Event risk: Today’s US PCE release is key.
A soft print would reinforce the Fed’s dovish stance, supporting dollar weakness.
A hot print could complicate the bearish dollar narrative.
Next move: Monitoring how AUDUSD reacts around 0.65000 to assess whether buyers regain control or if deeper correction unfolds.
Trade safe,
Joe.

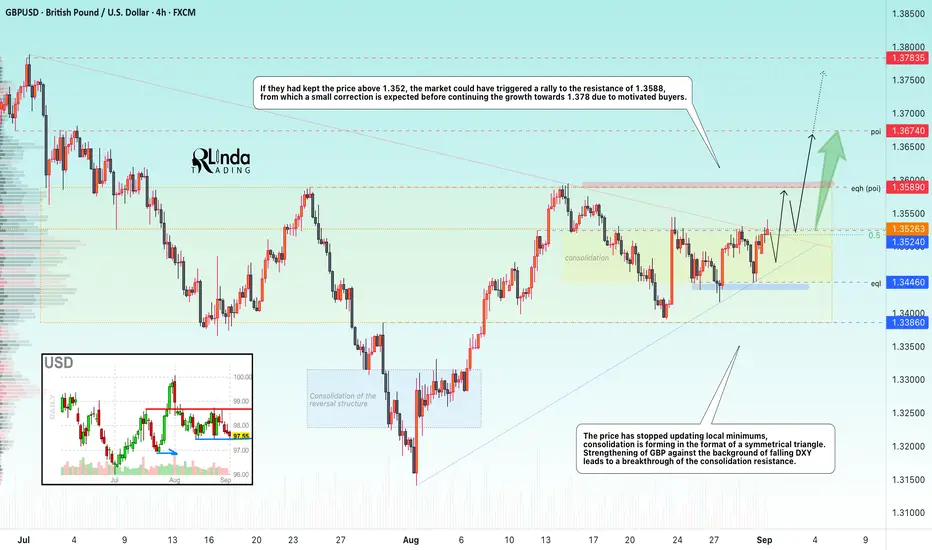
GBPUSD → Retest resistance for a breakout. Distribution?FX:GBPUSD is attempting to break through the resistance of the symmetrical triangle consolidation pattern, which is a continuation pattern of the main bullish trend.
Against the backdrop of stagnation and weakening of the dollar index, the GBPUSD price has stopped updating local lows, and consolidation in the form of a symmetrical triangle is forming. The strengthening of the GBP led to a breakout of the consolidation resistance, and if the bulls can stay above 1.352, then the market may trigger a rally to the resistance at 1.3588, from which a small correction is expected before continuing to grow to 1.378 thanks to motivated buyers.
Resistance levels: 1.3589, 1.3674
Support levels: 1.3524, 1.3446
In the 1.3525 zone, there may be a prolonged struggle for the buying area (above resistance). If the bulls manage to stay above the resistance conglomerate, this will confirm the fact of a resistance breakout and the end of the downward correction, which may trigger a continuation of the global trend and price growth to 1.378.
Best regards, R. Linda!
Looking for Zuari's Golden Zone - Fib RetracementZuari's fib retracement on the daily chart on the run up from 200 to 390 shows a clear pullback to 38.2% followed by a failed attempt to break 100% in a seeming double top formation around 390, invalidating immediate bullish momentum.
Daily Macd and RSI look weak with bearish divergences forming against PA, denoted with green brush lines showing both indicators with lower highs against price's equal high.
A retest of the golden zone (61.8% to 78.6%) puts us between roughly 240 and 275, which should offer a high probability zone for accumulation and eventually a bounce.
Look out for confluences of major fib levels with 1d 50ma, 99ma and 200ma. 61.8% also has a horizontal confluence with the Dec 3rd peak, and 78.6% has horizontal confluence with April 24th peak, also potentially infleuntial to support levels.

$BTC Weekly Close Below 20WMA - DANGER ZONE₿ITCOIN HAS OFFICIALLY CLOSED THE WEEK BELOW THE DANGER ZONE ⚠️
PA literally closed nearly right on the 20WMA 🤯
MMs are REALLY trying to keep us guessing huh …
Appears that CRYPTOCAP:BTC is now heading down to retest the .328 Fib ~$105k and grab liquidity there.
Hopefully that holds as support and bulls bounce back quickly, otherwise more downside to the 34WMA ~$101k

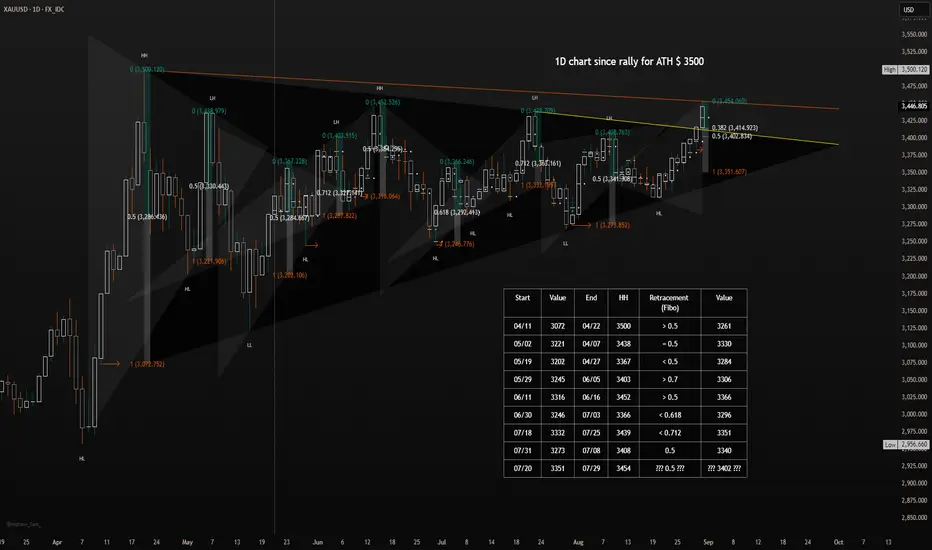
The day after a new higher highHello fellow traders! 👋
It seems like so many times again, the market went in a different direction than you may have expected. 🤷♀️
After multiple positive words from members of the Fed, a rate cut is likely to happen and is getting priced in. 📉 On Friday, July 29, we got some good economic data from the U.S., but the market acted differently. 🤔 Why is this? The data wasn't worse than expected; it was as expected. The market is taking this as a sign—a sign for higher prices. But, and this is a fact, many retail traders aren't. 😥
It's not about confusion; it's about the market (and us as traders) not having priced in all the possibilities. 🤯
The truth is, they are lying to you. They (the government) are telling people and the news that things are about to get fixed and will be good, but they aren't. 🤥 If you think the data we got on Friday is true, think again. Look at the data; you'll see the forecast was as expected, but in reality, the numbers are better than before. Do you get it? The obvious conclusion isn't always the real one. 💡 In my opinion, the U.S. economic data everyone is talking about is much better than many people think because the news is written to make it seem bad. 😒 You can think whatever you want, of course!
Price went up, not down, and a rally was chased. Many stop-loss orders were hit and turned into a cascade of higher prices. 📈 Institutions are buying gold, yes, because the dollar is cheap (?), and a rate cut is coming with a very high probability. 💰 So they buy gold, which results in many people's (and that's a good thing) stop-loss orders being executed. 👏 (sorry)
I've seen it in the past, and you can see it too if you look at my data table. Whenever a very high gold price was reached, a correction followed. 📉
I expect a correction on Monday or Tuesday, and this correction will lead to at least $3418, which is the 0.382 Fibonacci level. In my view, $3403 is the 0.5 level and more realistic. If you look at the table I put in the image, you can see that the day after a high price like we had today, the correction was always at the 0.5 Fibonacci level or more! 📊
Don't think it won't happen; they will trap you in any way they can, such as with fakeouts... 😈
Believe in the market and its structure because, until now, there has never been a day without a correction after a rally like this! 💪
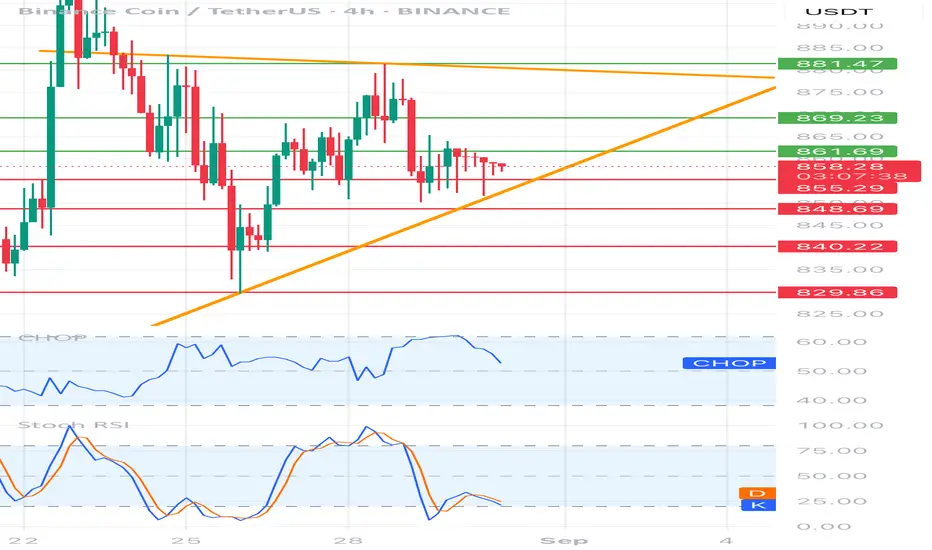
BNBUSDT 4H Chart 1. Price structure
• Current price: ~ 858 USDT
• The price moves in the clinic in a lowering (yellow lines). Upper inheritance trend (~ 881) + lower growth line (~ 848).
• We see consolidation - the market is "squeezed" between supports and resistance.
2. Horizers of support and resistance
• Support:
• 855 (local, this is where the price stopped)
• 848 (Important - lower wedge + demand level)
• 840 and 829 (key with a larger decline).
• resistance:
• 861 (first test, short -term)
• 869 (stronger resistance, earlier reflections)
• 881 (upper wedge line, strategic resistance).
3. Oscillators
• RSI (Chop) - around 50, i.e. neutral → no clear advantage of bulls/bears.
• STOCHASTIC RSI - is located at the bottom of the zone (approx. 20-25), which suggests the possibility of reflecting up (bull signal, but only after the candle confirmation).
4. Scenarios
Bullish (reflection up):
• If the price persists over 855–848 → possible reflection to 861 and 869.
• Breaking above 869 → opens the road to 881 (Test of the upper line of Klina).
• Only closure of the 4h candle above 881 → a signal of a kick from the wedge and a stronger upward movement.
Bearish (continuation of the inheritance):
• If the price drops below 848 and closes the candle at this level → strong inheritance signal, tarpapers: 840 and 829.
• 829 is key support - its bursting down can deepen the declines.
⸻
📊 Summary
BNB is now in the Departing Clinic, in the uncertainty zone:
• Maintenance 848–855 = chance of reflection.
• Punction down 848 = signal to a stronger decrease.
• Only breaking above 881 = signal of stronger growth movement.
GOLD → Retest 3400 before the news. Will there be a rally?FX:XAUUSD is pulling back slightly after hitting a new high of 3423. The trend is bullish, and on the D1 chart we see a breakout of a symmetrical triangle, which generally hints at bullish potential.
Gold is correcting after rising to $3423 in anticipation of US PCE inflation data.
Key factors: Doubts about the Fed's independence are limiting the USD's strengthening. Soft Fed rhetoric: Board member Waller supported a rate cut in September and further easing. The probability of a September rate cut is estimated at 87%.
Today's news: Core PCE inflation data (forecast: 2.6% y/y).
If below forecast → increased expectations for policy easing → support for gold
If above forecast → dollar strength → gold correction
Short-term gold dynamics depend on inflation data and its impact on Fed rate expectations
Support levels: 3405, 3394, 3386.5
Resistance levels: 3415, 3423, 3433
As part of the correction, the price may test liquidity zones and enter a consolidation phase ahead of the news. However, the market is one step away from distribution (exit from a symmetrical triangle). If the bulls keep the price above 3400 as part of the correction, we will have a good chance to catch the rally...
Best regards, R. Linda!

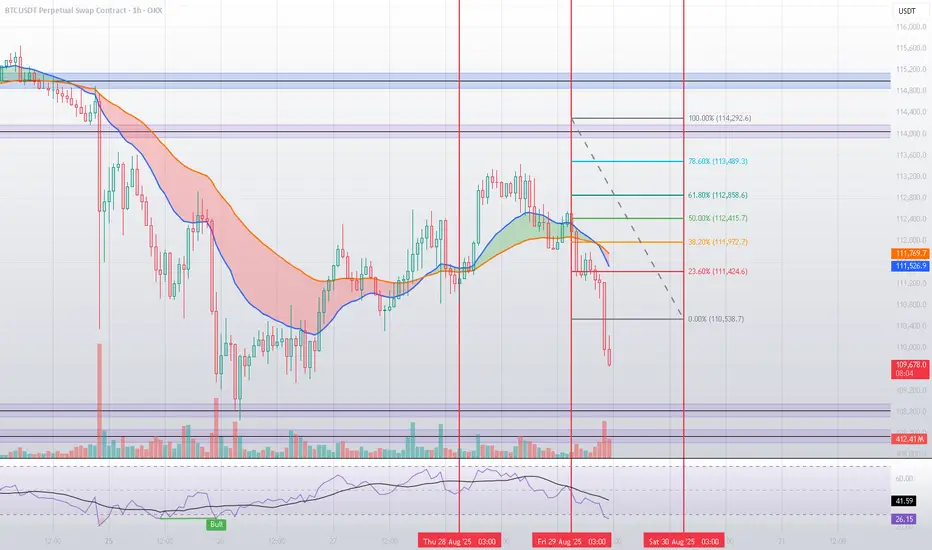
Technical Analysis for BTC/USDTBased on mathematical and statistical models, along with technical tools such as Fibonacci retracement levels and moving averages, Bitcoin is currently undergoing a bearish correction after failing to break through the key resistance at $114,046.
🔹 Interaction with Fibonacci Levels
In the previous analysis, we highlighted the importance of Fibonacci retracements in anticipating turning points. Recent price action confirmed this, as Bitcoin repeatedly reacted to these levels. The 61.8% retracement at $112,858 acted as a strong resistance, turning into a supply zone where sellers regained control.
Moreover, price failed to approach the 100% retracement at $114,292, reflecting a clear weakness in bullish momentum at higher levels. After that, Bitcoin broke below the 38.2% retracement at $111,972, triggering a sharper downside move — once again proving the reliability of statistical models in mapping market behavior ahead of time. 📉
🔹 Key Support Levels
$108,832: The first major support, aligning with a previous liquidity zone where price showed strong reactions. 🛡️
$108,353: A stronger support level. If broken, this could lead to a deeper bearish extension toward $107,500 or lower.
🔹 Technical Indicators
The RSI dropped to low levels (41.6 and even near 26.4 at certain points), signaling oversold conditions ⚠️, which may lead to a short-term rebound from the supports.
The 20 & 50 EMAs have crossed bearishly, confirming the downward bias.
🟢 Bullish Scenario
To regain momentum, Bitcoin must reclaim the $111,400 – $111,900 area and then retest the $112,800 (61.8% Fibonacci) level. Only a sustained breakout here would open the way toward the major resistance at $114,046. 🚀
🔴 Bearish Scenario
Failure to stabilize near current levels could push price down to $108,832, followed by $108,353. A breakdown below the latter would likely accelerate bearish momentum significantly.
✅ Conclusion
Bitcoin failed to reach the key resistance at $114,046 and gradually lost strength as it broke through crucial Fibonacci levels. The market is now testing critical supports at $108,832 and $108,353, which will determine whether a rebound is possible or if further downside is ahead. At this stage, caution is essential ⚖️, with close monitoring of liquidity and momentum.
BTCUSD 1D Chart1. Price Trend and Structure
The BTC price has fallen below the yellow uptrend line – this indicates a break in the bullish structure and signals weakening buyers.
Currently, the price is hovering around $107,950, which is local support (red zone ~108k).
Next important supports:
$104,500 – $103,900
$98,400 (recent stronger demand level + near the 200 SMA).
Resistance to break:
$113,500 (green line, previous support now acts as resistance).
$118,000 (key level for a return to the uptrend).
$124,500 (highs).
2. Moving Averages
SMA 50 (green) and SMA 200 (blue) → classic trend analysis:
The price is currently below the SMA 50, confirming short-term weakness.
The SMA 200 (~$100,300) is still maintaining the long-term trend – only a break below would signal a more serious bear market.
Possible scenario: If the SMA 50 begins to decline and approaches the SMA 200 → a Death Cross threatens.
3. MACD
Negative histogram, signal line below zero → downward momentum continues.
No signs of a reversal (no positive divergence yet).
4. RSI
RSI ~47 – neutral zone, slightly below 50 → not oversold, but showing an oversold market.
The RSI previously rebounded from the ~70 line (overheating) and is now heading down.
5. Key Levels
Support:
108,000 (current)
104,500
98,400 (strategic)
Resistance:
113,500
118,000
124,500
📊 Scenarios
Bearish (more likely now):
If 108,000 fails → a test of 104,500, and in the longer term, 98,400 USD.
A break below 98,000 would signal a long-term downtrend.
Bullish (less likely at this point):
A return above 113,500 and a daily candle closing above this level → a signal for a reversal and a possible re-entry into the 118–124k range.

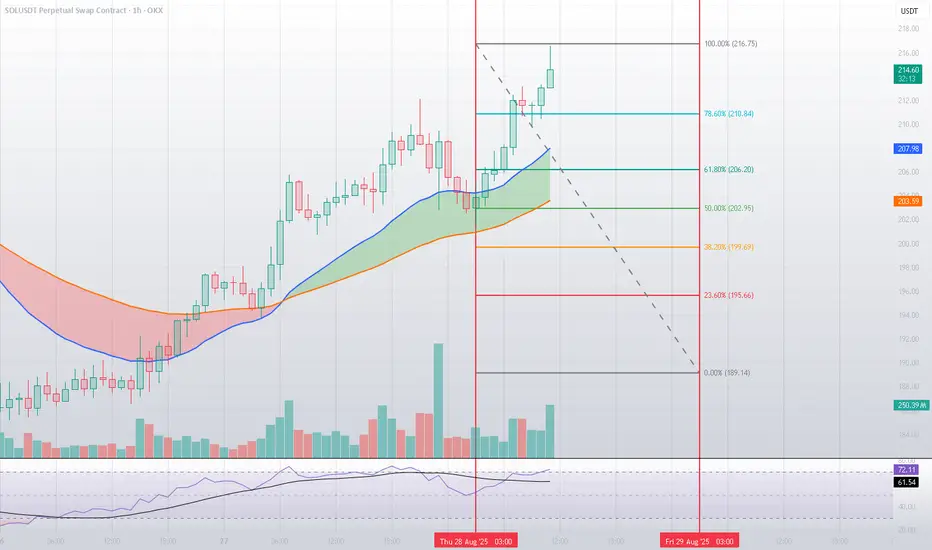
SOLUSDT → Stronger than the market. Correction before growthBINANCE:SOLUSDT updated its maximum to 218 and entered another phase of correction for consolidation. The altcoin looks quite strong against the backdrop of the rest of the cryptocurrency market...
Bitcoin continues its aggressive decline after yesterday's trap (false breakout of the trend line). Despite relatively positive fundamental and technical developments, the cryptocurrency market is in the red. Against this backdrop, SOL stands out as a strong altcoin compared to Bitcoin, which has been falling for two weeks. SOL updated its maximum and entered a correction phase. Within the current structure, the price may test the liquidity zone of 202.5 - 195.3 before continuing to grow to 220 - 240.
The reaction to false breakouts of local highs is weak, there is no reversal, and the nature of the current structure is “consolidation.” If the bulls keep the price above 200 during the correction, the further outlook will be positive.
Resistance levels: 216.5, 220, 244
Support levels: 202.5, 198.0, 195.3
Focus on the current correction. We need to wait for a slowdown and the end of the structure. Focus on the specified support zones, from which the market may resume bullish trading, which in turn may lead to a breakout of intermediate resistance and growth to the specified targets.
Best regards, R. Linda!

BITCOIN → Breakthrough of the downward trend resistance... 120K?BINANCE:BTCUSDT.P formed a false breakdown of key support at 110,000 - 112,000 and returned to the whales' zone of interest. The chart shows the prerequisites for a possible end to the countertrend correction...
A false breakdown of the daily support of 110K - 112K provokes a local bearish rally, within which the price breaks through the downward resistance of the correction and tests 113.300. The growth was supported by positive signals from institutional investors, technical stability and a decrease in selling pressure.
The fundamental background is positive, the market is trending. The chart shows prerequisites for the end of the correction. However, the further outlook depends on the 112.0 - 112.5K area. if the bulls hold the price above this zone, the flagship may return to the upward movement and head towards 117K - 120K.
Support levels: 112.5, 112.0, 110.9
Resistance levels: 113.6, 114.6, 117.0
After breaking through the resistance of the descending channel, the impulse stops and most likely a fight for the 112K zone may form. If the price returns to the channel and consolidates below 112K, then Bitcoin may return to the downward movement, however, while the price is trading above this line, the bulls have a chance...
Best regards, R. Linda!

$LINK Next Target $31Looks like I was right about my Chainlink call.
Go figure 🤓
CRYPTOCAP:LINK has closed the day above the 9EMA which is the first level you look to close above before the next leg up.
Notice it found support off the .618 Fib before the close.
$31 for the next target seems very likely, which was this cycle’s local high.

GOLD → Retest 3400. Readiness for a breakthroughFX:XAUUSD is "consolidating" creeping up on resistance, which generally increases the chances of a breakout, but the initial resistance test may end in a pullback. However, there is news ahead that could trigger one of two scenarios...
At the moment, gold is testing $3,400, but is ready for a correction pending new data from the US. However, further decline may be limited for the following reasons: Weak dollar: The probability of a Fed rate cut in September is estimated at 90%. Trump-Fed conflict: Pressure on Fed Chair Lisa Cook undermines confidence in the dollar. Trade wars: New US tariffs (on India) and retaliatory measures (Mexico, Canada against China) increase demand for "safe havens"
What is important: Political uncertainty and soft rhetoric of the Fed continue to play in favor of gold. Any attempts to reduce will be supported by buyers. It is also worth paying attention to the GDP and Initial Jobless Claims, which will be published today at 12:30 GMT.
Resistance levels: 3405, 3420, 3433
Support levels: 3386, 3373, 3369
Technically, the situation is ambiguous and everything depends on the reaction to 3405 and further news. Weakening of the fundamental background may lead to consolidation or correction to 3373 - 3369. However, if traders feel support, then the retest of 3405 may end with a small consolidation around the level and subsequent breakout and growth to the specified targets (I am more inclined to this scenario based on the above situation)
Best regards, R. Linda!

Technical Analysis for SOL/USDTBased on mathematical and statistical models, along with technical tools such as Fibonacci retracement levels and moving averages, Solana (SOL) continues to show strong bullish momentum after breaking key levels and trading around $215.
🔹 Resistance Levels
$216.75: The first major resistance, derived from the 100% Fibonacci extension. A confirmed breakout above this level would likely trigger a new impulsive move upward. 🚀
$225.61: A critical resistance zone. Surpassing this level would further validate the bullish trend and open the door for an extended rally toward $230+.
🔹 Support Levels
$213.38: The first support level. Holding above this zone reflects buyers’ strength, while a break below it could lead to a short-term correction. 🛡️
$210.84: A stronger and more decisive support aligned with the 78.6% Fibonacci retracement. Losing this level would weaken bullish momentum and potentially push the price down toward $206 – $202.
📈 Indicators
The RSI is hovering around 72, signaling overbought conditions ⚠️, which may trigger short-term corrections before any further upside.
The 20 & 50 EMAs remain in a bullish alignment, confirming the upward trend as long as price holds above key support levels.
🟢 Bullish Scenario
A successful breakout above $216.75 will pave the way toward $225.61, with potential continuation toward $230+ if momentum persists.
🔴 Bearish Scenario
Failure to clear resistance and a corrective pullback could test $213.38 first, followed by $210.84 as a decisive support level to avoid a deeper trend reversal.
✅ Conclusion
Solana stands at a critical juncture between strong resistances around $216 – $225 and solid supports near $213 – $210. A breakout or breakdown from these zones will define the next major move — either extending the bullish rally or triggering a deeper correction. ⚖️