EOS : Death cross and phase 2 of break out strategyHello fellas, Let's discuss this beautiful EOS. Let's get to the point.
I use bitfinex exchange to analyze current moves. From the chart that I've shared, there is a white support trend line that has already held the price since December 7th, 2019 and then it has broken out since August 14th, 2019. And since this break out, the price has never retest again the white trend line as confirmed resistance. I believe the last 11 days rally is a part of phase 2 break out strategy which will end up at the white trend line as confirmed resistance. In other side of fibonacci view, we can see the golden pocket zone is moving align with this previous support trend line. and when the price touch this golden pocket zone, I will be very interested to enter short position for EOS. My targeted area for take profit will be on previous swing low which is around $ 3.2 will produce a good rr. The risk to reward is pretty affordable with sacrificing 2% loss to catch the significant 23% profit.
Thank you
Fibonacci Retracement

The Precision, 5th truncated wave and Next possible stopHello all, It has been a very volatile day in the market, A huge moves has occured in today's market and I saw a lot of drama occur. But, once again our yesterday's scenario is going really well with 5th truncated wave at the upper line of the triangle.
Back to the 4 hours chart which is becoming the best benchmark for swing traders. in this specific period, you can see the yellow trend line which become the broken resistance previously and until now, I haven't seen any proper retest toward this resistance again that is now become support. Usually, after a major trend occur to the upside, we will try to find a support for possible place to catch the reversal. I use the fibonacci levels to find supports and in this case, I really don't think that the golden pocket on fibonacci retracement can hold the price considering the fact that bitcoin is moving inside a huge descending triangle.
In my opinion, The price should touch again the major support on around $9400-$9000 region where this horizontal support will find an alignment with the yellow line which now become a support trend line. and if this breaks, you will see a very very nasty drop from bitcoin.
Right now, I want to stay idle and watch the wild volatility that occurs in the market.

Elliot wave perspective on BTCGood afternoon all of my fellas, How are you doing? did you catch the last awesome bulls? I hope you are doing so. Let's get to the point of today's bitcoin analysis!
In this podcast, I will cover the daily movement, intra day and scalp opportunity on bitcoin. Based on this chart, I show you 2 support and upper line movement the green dotted one and the green line. The different between this 2 line is based on how I connect the price. the green line I use the wick to wick connecting method which doesn't exclude the bear trap and bull trap region. the green dotted line, I use the body to body connecting method which exclude the bull trap and bear trap region. Based on those 2 line, It is clear that bitcoin still has the room to grow to the upside of the upper line. And based on my opinion, it can be at the golden pocket region around $11100 region which in fact has a confluence with the upper line of the triangle.
And for smaller time frame view, I will give you an explanation on update section.

Room to grow, support and resistance for bitcoinFor all of you who has opened a long position since my last signal should be in an amazing profit by now. That's why congratulation for all of you my baby. here we come with another view on bitcoin based on daily chart.
First, the last volatility is just amazing and if you have seen my previous analysis about bitcoin, you should have opened long position since $9500 region. Right now, the price is trending inside the huge descending triangle and I clearly see the potential of the price to fill the empty room toward the upper line of the triangle. but, looking at the size of current daily chart, it has a huge possibility for bitcoin to have a spike toward the golden pocket zone or even at the 78.6% fib retracement region before another drop to the downside.
Looking at the MACD indicator right now, the histogram has a significant ticking up to the upside and to the positive side. if this condition can hold until the daily candle close, I firmly believe that the price will fill the empty room toward the upper line of the triangle.
Currently the price has already claimed back the dynamic support on daily chart and this is a pretty good sign for me.
Thank you I will keep on updating about bitcoin's current moves.

Next waves must be around $1600 Hello all, looking at the analysis for XAU that is very interesting. I bet the $1600 as the next target for XAU and if we look at the blue line which has crossed up the white dynamic line, this is clearly a good sign for trend continuation, I hope to see the price retrace first to complete the 4th wave before challenging the golden pocket zone.
Thank you

GBPNZD 50% Fibonacci Retracement of Pin BarEntry 50% Fibonacci Retracement of Pin Bar (Price Level 1.86555)
Exit at Key Horizontal Support Resistance Level 1.84292
Another idea is to enter at 38.2% Fibonacci Level and Horizontal Key Level (1.86323) for confluence.

GBPSGD Fibonacci Trade Entry Level and Stop Loss LevelGBPSGD | Enter between 0.618 and 0.786 of the Pin Bar for Fibonacci Level Trade Idea. Stop Loss at the 1.618 Level.

EUR/USD UPTRENDING !!*-BROKE ASCENDING TRENDLINE
*-DOUBLE BOTTOM FORMATION SIGNALING A TREND CHANGE
*-PRICE IS ABOUT TO CREATE A NEW DESCENDING TRENDLINE
*-I AM EXPECTING A FURTHER MORE SMALL PUSH TO THE DOWNSIDE TOUCHING THE SUPPORT AND FIBONACCI RETRACEMENT
*-PRICE MIGHT ALSO CORRELATE WITH 50 EMA
*-WAITING TO SEE SOME PRICE ACTION/CANDLESTICK PATTERNS ON MY POCKET BEFORE ENTERING A LONG TRADE
*-BE CAREFULL OF NFP THIS FRIDAY
*-ITS BETTER TO CLOSE ALL OPEN TRADES BEFORE NFP
#tradesafe #education #bestsetup #learn #freecontent

The "Pulse" of an asset times Fibonacci: Golden Ratio of GrowthLTC in a perfect example of "Golden Ratio of Growth".
Each extension is 1.618 times the previous extension.
Most things in Nature which Grow, do so by this Ratio.
Impulse was from the Bottom of Despair.
Ripples were all grown with perfect Ratio.
Retraces will be of much similar proportions.
.
.
Ordered Chaos
every Wave is born from Impulse, like a Pebble into Water.
every Pebble bears its own Ripples, gilded of Ratio Golden.
every Ripple behaves as its forerunner, setting the Pulse.
each line Gains its Gravity.
each line Tried and Tested.
each line Poised to Reflect.
Confluence of 2 is Dependable.
Congruence of 3 is Respectable.
Coincidence of 4 is Worshipable.
every Asset Class behaves this way.
every Time Frame displays its ripples.
every Brain Chord rings these rhythms.
He who Understands will be Humble.
He who Grasps will observe the Order.
He who Ignores will behold only Chaos.
Ordered Chaos
.
.
.
want to Learn a little More?
can you Spend a few Moments?
click the Links under Related.

GOLD - Daily - Multi-Timeframe Analysis Series 1GOLD has a correlation to the strength of USD, as a risk-off asset investors seek haven in the event of Dollar weakness (USD falls > GOLD rises). I'm sure there's more to it than that, be sure to check it out online for yourself.
Comments
The Daily timeframe is looking very clean when it comes to price action.
Having formed bearish MACD Divergence between 4th January - 20th Feb, we have since seen this break down on the the lower timeframes. What concerns me about shorting this just now though is the Daily 50 EMA which seems to be propping up price at the region of 1300. This is the same region we had a minor rejection on the Weekly timeframe too.
The two red arrows highlight the potential for 2 shoulders, one left and one right, which could be an indication of a bearish Head & Shoulders pattern forming. This adds a lot of confluence to our overall bearish sentiment, and could be the markings of further consolidation which we referred to in the earlier lessons.
A double top on the Daily would be a prime signal for a sell-off cascading up the higher timeframes. This may not happen if we see more selling pressure. Let's see what this next week brings!
Key Note
Head & Shoulders patters can be traded as is or used for overall market sentiment. In their nature, they are consolidation / reversal formations.

DXY - Monthly - Multi-Timeframe Analysis Series 1Continuing with another episode of Multi-Timeframe Analysis Series 1, I'd like to break down the DXY.
The DXY being weighted as follows:
EUR - 57.6%
JPY - 13.6 %
GBP - 11.9%
CAD - 9.1%
SEK - 4.2%
CHF - 3.6%
As you may imagine, there's a lot more interest in using the DXY for a correlation / confluence tool when trading the EURUSD. The EURO equates to over half of the overall weight of the index, meaning there's a majority interest in the EUR vs USD.
We can use this to our advantage, alongside the USDOLLAR INDEX, to add positive or negative trade factors when considering positions across USD pairs and commodities.
Comments
Looking at the Monthly timeframe we appear to be stalling between the 61.8% retracement of A>B as indicated on the chart. Price is showing high test candles at this level, as well as a potential rolling double top (continuation formation). Given the circumstances of this in its current form, 94.00 could easily be on the cards as we move into the second quarter of 2019.
Key Note
At time of writing this, it's the current monthly candle cannot be considered an indication of direction just yet as it hasn't fully formed (being the 24th of the month).

EURUSD Retest for a possible Continuation?With the EURUSD hitting a Resistance Zone just below the 1.2500 zone (which is a Major psychological level as well), could we see it move further down, or will it hold to the 61.8% Fibonacci Retracement we have on our Weekly Chart?
Link for the Weekly chart below

First look at my new Fib based indicator True FibsThis is a first look at my new charting tool True Fibs. The chart speaks for itself. I'll be making it available for use in the next couple days. Altogether I have 4 or 5 Fib based indicators / tools in the works so if you are using FibbyTenths or like the idea, stay tuned.

Example of FibbyTenths indicator on DOGEBTCI recently put out an indicator entitled "FibbyTenths" and wanted to show a nice example of its usage. Here it is on DOGEBTC on the 1D chart. What are you looking at? Line 1.000 (pink) is a baseline from which all other levels are calculated. To get the 0.618 line (for example)= Baseline * 0.618. Pretty easy. As you can see, there are numerous examples of the price reversing direction from, or rebounding off, the 0.618 and 0.236 lines.

[DXY] How to use Fibonacci IndicatorHi guys !
This a simple chart with a explicit Fibonacci Indicator. Many people asking me how to use it, it's easy, have a look.
Story : Fibonacci was an Italian mathematician (1175 - 1250). He discovered this number sequence like this: Each numbers is calculated by adding the two previous numbers, for exemple : 1, 1, 2, 3, 5, 8, 13, 21, 34, 55, 89...
The special thing in this sequence is that every numbers is 1.618 of previous and 0,618 of next one. And as you know, 1,618 is the "Gold number" .
(Hope my english is not too bad haha)
1 - Choose a higher and lower price (downtrend) or lower and higher price (uptrend)
2 - Fibonacci will retrace different line at 23.6, 38.2, 50, 61.8, 78.6 and 100 %
3 - Theses line will be the next supports / resistances in the correction / bounce
You can use it to place the best order (BUY or SELL) and make more profit.
Ask me for any questions !
Thanks for your time.

Support and Resistance Levels with auto Fibonacci Setup TutorialIdentify horizontal support and resistance lines using your choice of 6 methods.
Available options
Lookback window: Number of bars back to consider in calculations
Lookback window right (only applicable for methods 3 and 4): Number of bars to the right to consider in calculations
Number of S/R lines to plot: S/R lines to plot (currently the max setting is 4 so 8 lines due to pine limitations. I can post separate scripts for each method that allow more depending on user feedback)
Use Custom Time Frame? (M1, M6, M5 only work if viewing lower TF): Set a custom timeframe in minutes, then 1D for daily, 3D for 3 daily etc.
Calculation offset: How many of the most recent bars to ignore in the calculations.
Update Frequency: How many bars to wait until updating the lines since the last update.
Things to tweak.
I still need to test the methods, depending on that and feedback I can post separate scripts for each method that allow more depending lines or scrap some.
I'll tweak the parameters for using linebreaks to scrap them. Currently required a three close through it (so two in one direction and one in the other).
Fibs don't work on the static timeframe as I've reached certain restriction in the coding system.
Link to Indicator
Below are some examples using the default settings (which I have not optimized as of yet)
Method 1
Method 2
Method 3
Method 4
Method 5
Method 6
Referral Links
Bitmex 10% fee discount for 6 months
www.bitmex.com
TradingView (50% off after trial period ends)
tradingview.go2cloud.org
Tip Jar
BTC: 1FgEeDDMF7QKydQPJVCDjp7ypjREp8XG6c
LTC: LM9KsXz7GUxCN9g9EjTC8ayviDEmBK14rw

BTCUSD- Understanding Structures in the Crypto MarketHi all,
I felt compelled to spend quite a bit of time to create what I believe is an incredibly comprehensive guide to understanding the movements of the market. If you're tired of getting burned on every run, then look no further. Let's begin.
You might notice a handful of purple and black bars in this chart- their purpose is to designate "structures", or zones of heavy resistance/support. They might take a moment to get a grasp of, but once you understand how to define them, it becomes easy, and you'll be to start predicting where a run will end with scary accuracy.
To define a structure, you will essentially want to cover the .5-.618 region of a wave, although since waves rarely retrace exactly in that zone, you may want to expand your structures out a bit to cover wicks and outliers. Anyways, the easiest way to define your structure is simply by recognizing what our trend is. Would you be able to look at a chart and tell me when we've seen a bullish reversal or a bearish reversal? If not, it's quite easy; to spot a bullish reversal, look for a break above the previous high. To spot a bearish reversal, look for a break below the previous low. Obviously terms like "high" or "low" can be quite subjective, as there's a near infinite ways of looking at the charts, but having a bit of some background on Elliot Wave theory, Fibonacci retracements, and reversal candlestick patterns will help you recognize when a reversal is happening. The easiest way to try and find a reversal is by seeking out a definitive high and definitive low, and creating a Fibonacci retracement structure between the two. Let me go into detail a bit further below.
If you reference the first picture above the chart, you'll see 3 blue arrows with a Fibonacci and a purple box. This is showing what a bullish trend would look like. To set up this structure, you must determine what your wave of interest is. In this example, we create our points based on the first arrow. In an uptrend, you will start your retracement from the top to the bottom, rather than the bottom to the top. The reason you want to do this is because you are retracing DOWN, so you want your retracement wave to head to the .618 in its respective direction. Anyways, as you can see, the second blue arrow is a retracement wave, and you can see that it touches the .618, ends, and then proceeds to start the third wave. Because we made a bounce off of the .618, we have confirmed continued bullish momentum. if we were to do a convincing close below the .618, this would more than likely indicate that a trend reversal is commencing. Understand that at times, we can be faked out by this, but this is the nature of trading. If you have a good trading strategy, you don't need to worry about losing trades every so often, so it's better to put your faith into something that's quite accurate rather than trade with no strategy in play.
To keep in short (pun intended), whenever you are in a downtrend, the opposite applies to that of the uptrend; you will start your retracement from the bottom to the top. The same deal applies with the downtrend as it does the uptrend, in that a rejection of the .618 will most likely point to continued bearishness. Using these bullish and bearish wave structures are incredibly power tools that not only help you minimize losses, but they also give you the confidence to stay in a trade for longer than you might have realized was possible. Remember, if there's no clear signal of a trend change, then the trend will continue.
So with these tools in hand, I went through every noticeable wave structure since the 3000 dollar range and determined wave lengths, which can be done by finding .5-.618 regions that appear to have found a lot of activity. For the most part, determining your wave structure will come down to common sense, but it takes a bit of practice to know where a wave starts and where a wave ends.
If you look at each structure found in the chart, you'll notice they all start in different positions. I positioned each of them to reflect the date in which they first were established. As you can see, this is an incredibly powerful tool to have at your disposal, because it predicted the top in March, it predicted the top in May, and it predicted the top in July. Something tells me that this has predicted the top in September, too, but I'll let you guys figure that out ;). Additionally, the support structure (bottom purple bar) shows the rejection that we experienced in February, June, and August.
I don't want to give too many details about my opinions or thoughts on what we have here, because this is meant to be educational over anything, but I hope that this helps you guys get a better understanding of what makes the market move the way it does. Feel free to message me if you have any questions, and be sure to shoot this a like if you dig what you've read. Happy trading!

The Golden Pocket Fibonacci like a BossBuying the pull back is always tricky.
As a trader we deal with probabilities and try our very best to find high probability trades. We do this by finding confluence and various reasons to add to our trade setup.
The Golden Pocket
It is my ideal favorite zone to enter a high probability retracement after an impulse wave upwards.
It is the 61.8% to 65% zone (highlighted in red).
How to trade it
i) Find a swing low and swing high points
Bullish
- Swing Low to Swing High
Bearish
- Swing High to Swing Low
ii) Draw fib extension line
iii) Find other confluence reasons to enter the trade besides this e.g. RSI levels, previous support levels.
iv) Wait for confirmation of some form of support before considering entering the trade as it can sometimes just tear thru

5 STEPS TO CHANNEL THE TARGET WAVE 5 USING ELLIOTT WAVESSTEP 1 - Once the 1 wave is completed use Fib Retracement to find out the possible wave 2 level. Usually wave 2 is 0.5 - 0.8 of wave 1. In a uptrend Fib level is close to 0.8 but its the opposite on downtrend
STEP 2- Once the wave 2 is completed use Fib Extension to find out the possible wave 3 level. Usually wave 3 is 1.618 of wave 1 or 2.618 of wave 2.
STEP 3 - Once the wave 3 is completed then you can draw a line to join 1 and 3 and then draw a parallel line on wave 2 to project the wave 4. Usually wave 4 is 0.5 - 0.618 of wave 3
STEP 4 - Once wave 4 is completed then you can draw a line to join wave 2 and 4 and then remove the previously drawn line joining wave 1 and 3
STEP 5 - Then draw a parallel lines from wave 1 and 3 and the 50% trend line of the above parallel lines to project wave 5. Usually wave 5 is 1 or 0.618 of wave 1

BTCUSD 1H Bullish ContinuationPrice dropped to 50% fib retracement then reversed long. First Entry would have been after 1 candle pullback @ 8010.00. Original buy stop was 8110.00. First take profit would be swing high. Price hit swing high and broke above it. Nice to watch and learn how this pair reacts to fast drops in price.

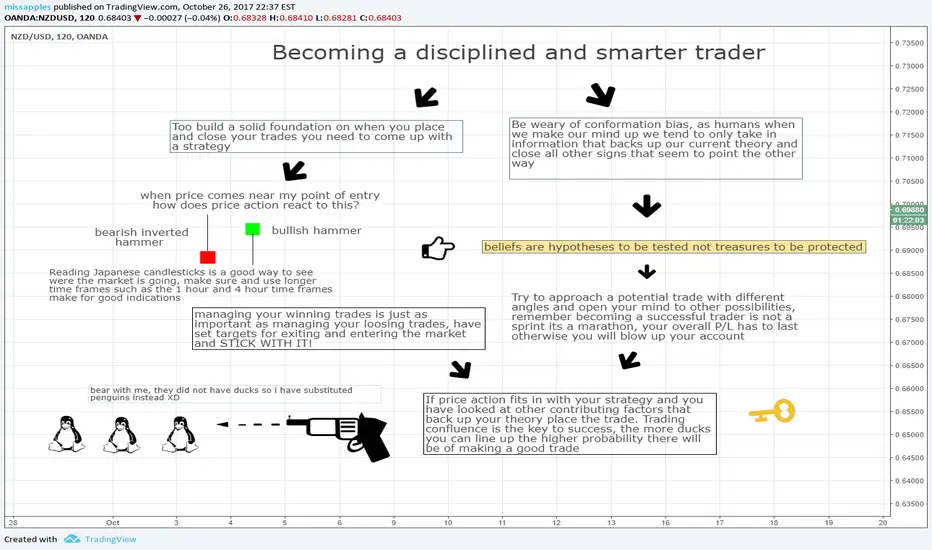
Becoming a disciplined and more thoughtful traderHello there, everyday i look in the chat and i see people making trades based on fomo, chasing price and news and i wanted to bring to life a few steps that i have in place before making a trade. I hope this is helpful! best of luck!
EURUSD weekly Fibonacci levels for long term view and trading
EURUSD is adhering or responding to the Fibonacci levels all most all of the times. When trader wants to ride the trend this much information is enough to enter and exit trades. We are not trying to forecast the direction or the top/bottom. We are trying to identify important zones in which price may turn in Future.
Price patterns like double top or bottoms or many other patterns can be used along with Fibonacci. I have mentioned few on chart. Going ahead we can look for shorting opportunity near level 1 of Fibonacci and long near 1.27. Price may stop and turn(as expected) or continue up or down movement from mentioned levels. To avoid such scenarios where price continues the move instead of reversing, we need to take help of price structure and candlestick patterns.
Many traders msg me about how Fibonacci doesn't work, I recommend them all to stop using Fibonacci and use the tool in which you believe. As a trader our job is not to criticize any tool or method of analysis. Our target needs to be "designing trade plan which works for us". No tool works independently in my experience, we always need to club different tools and use them collectively.

[Tips] High-Probability Trade with Fibonacci Retracement
How To Use Fibonacci Retracement to find High-Probability Trade Setup
Brief Definition:
Fibonacci retracement is a very popular tool among technical traders and is based on the key numbers identified by mathematician Leonardo Fibonacci in the thirteenth century.
In technical analysis, Fibonacci retracement is created by taking two extreme points (usually a major High and Low) on a chart and dividing the vertical distance by the key Fibonacci ratios of 23.6%, 38.2%, 50%, 61.8%, 78.6%, and 100%.
Once these levels are identified, horizontal lines are drawn and used to identify possible support and resistance levels.
These ratios seem to play an important role in the financial market and can be used to determine critical points that cause price to reverse. The direction of the prior trend is likely to continue once the price has retraced to one of the ratios listed above.
Tips for Effective Setup:
1. Analyze the general overview (big picture) of price movement to the current trend.
In the above example, blue vertical line divides chart into 2 section, Downtrend on the left and Uptrend on the right.
We can use MA200 to identify the overall trend.
2. Look at the price movement carefully and then draw Fibo Ret from the extreme pivot points.
For Downtrend, drag 100% level from previous High to 0% level at the newly formed Low.
For Uptrend, drag 100% level from previous Low to 0% level at the newly formed High.
3. Pay attention to the price movement to the opposite direction of the general trend.
Wait for any price rejection to the same direction with the general trend at one of the Fibo Ret level.
Entry zone which quite popular are 38.2%, 50%, and 61.8% level.
4. Probability of success will increased if price rejection occurs at the confluence of Support and Resistance levels.
ie. confluence of one Fibo Ret level with Support / Resistance area, Trendline, or Chart Pattern.
The point is, more confluences are taking places, probability of success for price rejection at Fibo Ret level is higher.
Few Examples:
Example 1 - 3 for Downtrend case (MA200 sloping down)
Example 4 - 5 for Uptrend case (MA200 sloping up)
1. (Normal Retracement) Price reversed to the opposite direction of the trend and rejected down from around Fibo Ret 50%.
The downtrend continuation after price rejection tend to be normal and not too deep.
2. (Higher Probability Retracement) Price reversed to the opposite direction of the trend and rejected down from the confluence of 2 resistance:
Fibo Ret 23.6% and Resistance Area 110.648-110.771.
The downtrend continuation after price rejection tend to be quite deep.
3. (Highest Probability Retracement) Price reversed to the opposite direction of the trend and rejected down from the confluence of 3 resistance:
Fibo Ret 61.8%, Major Down Trendline (diagonal red line), and Resistance Area 110.275-110.346.
The downtrend continuation after price rejection tend to be very deep.
4. (Higher Probability Retracement) Price reversed to the opposite direction of the trend and rejected up from the confluence of 2 support:
Fibo Ret 38.2% and Support Area 110.648-110.771.
The uptrend continuation after price rejection tend to be quite high.
5. (Normal Retracement) Price reversed to the opposite direction of the trend and rejected up from around Fibo Ret 61.8%.
The uptrend continuation after price rejection tend to be normal and not too high.
Happy Trading...
