Elliott Wave CheatSheet with Fibonacci Targets - LogScaleHi EW Fans,
added some interesting and helpful Fibonacci Numbers in Terms of Elliott Wave from an old Sheet i have found in the Web. You need to switch your Chart and your Fibonacci Tool to Log-Scale.
Greetings
Fibonacci Retracement

types of pullbacksIn this lesson, I shared with you the types of pullbacks
Be careful, pullbacks are breaks in the middle of the trend
Poolbacks do not have the strength of main steps
In my opinion, the best type of trading with pullbacks is to recognize the completion of these corrections patterns so that we can move in the direction of the trend at the right point.
Of course, it depends on your trading time frame.

3 FIBONACCI TOOLS YOU MUST KNOW 💡
Hey traders,
In this article, we will discuss 3 classic Fibonacci tools you must know.
1️⃣Fibonacci Retracement
Fib.Retracement is my favorite fib.tool. It is aimed to identify strong horizontal support and resistance levels within the impulse leg.
We draw this tool based on the high and low of the impulse (from wick to wick) and it shows us POTENTIALLY strong structure levels determined by Fibonacci numbers.
Common Fib.Retracement levels are: 0.382, 0.5, 0.618, 0.786.
Once one of the levels is reached, wait for a confirmation before you open a trading positions.
2️⃣Fibonacci Extension
Fib.Extension indicates strong horizontal support and resistance levels beyond the impulse. Similar to Fib.Retracement tool, Fib.Extension is drawn relying on impulse's high and low (from wick to wick) and it shows POTENTIALLY strong structure levels where the consequent impulses may complete based on Fibonacci number.
Common Fib.Extension levels are: 1.272, 1.414, 1.618.
Once one of the levels is reached, wait for a confirmation before you open a trading positions.
3️⃣Fibonacci Channel
Fib.Channel shows strong vertical supports and resistances (trend lines) within the channel. The tool is drawn based on the trend line of a valid parallel channel (based on wicks) and it shows POTENTIALLY strong trend lines from where the market may retrace.
The trend lines within Fib.Channel rest on 0.382, 0.5, 0.618, 0.786 Fib.Levels.
Once one of the levels is reached, wait for a confirmation before you open a trading positions.
Remember that Fibonacci's are simply tools in a toolbox. In order to use them properly, you need to build a trading system around them, test it and confirm its efficiency.
❤️If you have any questions, please, ask me in the comment section.
Please, support my work with like, thank you!❤️

Jumping S-curvesIn this post, I will explain what jumping S-curves means and how you can identify potential S-curves before they jump .
First, let's begin with the chart above (also copied below).
This is a yearly chart of McKesson Corporation (MCK), a medical supplies company.
As you can see in the chart below, this stock has been soaring over the past year despite most other stocks being significantly lower.
Here is the performance of the S&P 500 over the same time period.
Whenever I see something highly unusual in a chart, such as extreme outperformance, I check the higher timeframes to see what's driving price on a technical level. Below is the yearly chart for MCK.
When I examine price action over a long time period, I always log adjust my chart. Below is the log-adjusted chart.
Upon seeing this chart I immediately knew what was going on: the stock price jumped S-curves. I will try to illustrate below how I reached this conclusion.
To begin, I drew Fibonacci levels from the last reaction low to the last reaction high on the yearly timeframe.
The previous reaction low was the bottom of 2008 because that bottom was a Fibonacci retracement of some earlier reaction high, the reaction high is the top in 2015 because price did not surpass that high without first undergoing a Fibonacci retracement (to the golden ratio).
As you can see above, from 2015 to 2018 the price retraced down to the golden ratio (0.618) on the yearly chart. It is often from this retracement level that the base of the second S-curve is created. (For simplicity, I only included the 0.618 Fibonacci level on the chart).
Some may say that this pattern is merely a bull flag or pennant. (See chart below)
Indeed, bull flags and pennants can be another way to visualize S-curve jumps.
Whereas, on a deeper, more mathematical level, S-curve jumps are logarithmic spirals (approximated as Fibonacci spirals or Golden spirals). If you wish to delve deeper into logarithmic spirals, including the Golden spiral, you can check out this Wikipedia page: en.wikipedia.org
These Fibonacci or Golden spirals are present on mostly every chart and they appear on mostly every timeframe (hence they are fractal ).
One of the best charts you can use to visualize these spirals is the chart of Bitcoin. Below are charts of Bitcoin which attempt to show the endless fractal nature of Fibonacci spirals (or "S-curve jumps").
I've only illustrated a few of the spirals, but indeed there are numerous spirals. (I tried to do my best using the tools on Trading View to draw these spirals, but it can be quite hard to manipulate the curves perfectly to price action.)
One may ask what about when price falls? That is obviously not an S-curve jump since the price is falling.
Actually, when price is crashing it is usually just an S-curve jump, or Fibonacci spiral, on the inverted chart.
Although I have not tested it with scientific rigor, I do hypothesize that Bitcoin's price movement is a series of infinitely fractal and competing Fibonacci spirals on various timeframes, including Fibonacci spirals on inverted scales. Price movement can be thought of as an infinite series of S-curve dilemmas where infinitely fractal S-curves, including those of which are inverse S-curves, compete to govern the next price move.
Each dilemma is resolved when an S-curve reaches its inflection point, such that it governs price movement and price moves rapidly in that direction until it approaches capacity and faces its next dilemma.
Those who know Calculus may recognize this chart. Indeed this is the graph of a logistic function. The mathematical terminology for an "S-curve" is sigmoid function .
Here are some more interesting charts of S-curves (none of which is intended to be investment advice)
Meridian Bioscience (VIVO) jumps S-curves on its yearly chart
The U.S. Dollar Index jumps S-curves on its yearly chart
The entire price action of Chinese EV Company (NIO) is an S-curve that just completed a perfect golden ratio retracement
Japan's faces a population S-curve dilemma
Citigroup underwent S-curve growth up until the Great Recession.
Then it crashed or underwent S-curve growth on the inverted chart.
In summary, price movement involves an endless series of S-curves or Fibonacci spirals. Identifying an S-curve on a high time frame before it reaches its inflection point and breaks out can lead to tremendous gains (among the most lucrative gains one can realistically make in the financial markets).

FibonacciHello, Let us talk about 'Fibonacci.'
On this chart: You will read about where it came from? Why do we use it, and where does it help us.
Before we dive in to talk about Fibonacci Retracement levels and their use in trading, Let us talk about the origin of Fibonacci :
It all started with rabbits.
Yes, Rabbits!
Fibonacci became interested in a strange issue in 1202. He wanted to know the outcome if he had a pair of male and female rabbits and defined behavior for their offspring. The assumptions were as follows:
We have a pair of male and female rabbits that have just been born.
Rabbits mature after one month.
The gestation period of rabbits is one month.
When a female rabbit reaches puberty, she must become pregnant.
At each pregnancy, the female rabbit gives birth to one male rabbit and one female rabbit.
Rabbits never die.
Calculate how many pairs of this type of rabbit we will have after n months?
In mathematics, the Fibonacci sequence or series is the following infinite sequence of natural numbers:
0,1,1,2,3,5,8,13,21,34,55,89,144,233,377,610,987,1597,...
Take a look at this GIF, to get an idea of this infinite sequence:
drive.google.com
The Fibonacci spiral: an estimate of the golden spiral generated by drawing circular arcs attaching the facing corners of the squares adjusted to the values of the sequence; by successively attaching squares of side 0, 1, 1, 2, 3, 5, 8, 13, 21 and 34.
The sequence begins with the numbers 0 and 1; "each term is the total of the past two" is the recurrence relation that defines it.
The elements of this sequence are called Fibonacci children. Leonardo de Pisa described this sequence in Europe, a 13th-century Italian mathematician also known as Fibonacci. It has numerous applications in computer science, mathematics, and game theory. It also appears in biological configurations, such as in the branches of trees, in the arrangement of leaves on the stem, in the flowers of artichokes and sunflowers, in the inflorescences of Romanesco broccoli, in the configuration of coniferous conifers. In the reproduction of rabbits and in how DNA encodes the growth of complex organic forms. Similarly, it is found in the spiral structure of the shell of some mollusks, such as the nautilus.
Leonardo Pisano, Leonardo de Pisa, or Leonardo Bigollo, also known as Fibonacci, was born in 1170 and died in 1240. Long before being known in the West, the Fibonacci sequence was already described in mathematics in India in connection with the Sanskrit prosody.
Susantha Goonatilake notes that the development of the Fibonacci sequence "is attributed in part to Pingala (year 200), later associated with Virahanka (about 700), Gopāla (about 1135) and Hemachandra (about 1150)". Parmanand Singh cites Pingala (around 450) as a forerunner in the discovery of the sequence.
Now let us talk about Fibonacci in the finance world. You might use it too, as Fibonacci Retracement Levels. (As you see on the chart)
The second law of technical analysis indicates that values move in trends, bullish or bearish. Once a trend has given sufficient signs of termination, either by breaking its trend line, confirmation of a trend reversal figure or any other valid factor according to technical analysis theory, the analyst contemplates the possibility of a setback. A pullback represents, in simple terms, a move in the opposite direction to the past trend. It can take the form of a crash in price after a bullish move or a rebound in price after a downtrend. Although the first could properly be called a retracement and the second rebound or rally, technically, the term retracement includes both.
Within technical analysis, Fibonacci retracements refer to the possibility that the price of a financial asset will retrace a considerable portion of the original movement and find support or resistance levels at the levels set by the Fibonacci numbers before continuing. The above address. These levels are constructed by drawing a trend line between the extreme points of the movement in question and applying the critical percentages of 23%, 38.2%, 61.8%, 76.8%, and 100% to the vertical distance.
Fibonacci retracements are used to confirm suspicions of a market movement. Levels of support and resistance can indicate possible bullish or bearish market trends and indicate to people when is the best time to open long or short positions. This means that Fibonacci retracements can be highly fulfilling for people who know when to use them correctly.
Upon confirmation of rejection in the price, we will try to calculate the probable magnitude of the movement. In order to achieve this, specific percentages collected from the Fibonacci series are applied to the total magnitude of the previous trend. The percentages used are as follows:
61.8%: Also recognized as the Golden Ratio, or golden number, it is the limit of the result obtained from the division of an element of the Fibonacci series by the following number, as the series tends to infinity.
38.2%: It is obtained by subtracting 61.8% from the unit (1.000 - 0.618)
100.%: Equivalent to the total magnitude of the primary trend.
Reversal percentages should be calculated after the end of a trend has been confirmed, never while the trend continues.
Considering that trends are always part of a longer-term trend and, in turn, are made up of shorter-term trends, the question on which of these trends should be calculated as setbacks? There might not be a simple answer. We must calculate the setbacks on that trend that has given clear signs of termination in general terms.
A weak trend may have a 31.8% retracement, while a powerful trend may have a 61.8% retracement before returning to its original direction.
Some sources mention a critical zone of 33 to 38.2% and 61.8 to 67% instead of specific levels.
Fibonacci retracements form an essential part of the Elliott Wave Theory.
The most scathing criticisms against Fibonacci retracements are based on the random walk theory, arguing that there is no justification for assuming that price action has any reason to respect predetermined retracement levels.
However, it is not suitable to use Fibonacci retracement all the time. There are a few downsides too:
Fibonacci retracement shows only static price levels. It is unlikely to say that a specific cryptocurrency price will not pass or stay below predicted levels.
Many external factors determine the price of a coin. They have to be taken into account when determining trading decisions.
Fibonacci retracement levels are close to each other, so it is challenging for a professional trader to determine the accuracy from which to predict the value of a particular coin in the future.
Suppose you're interested in using this great indicator. In that case, you can simply go on your TradingView chart and the dashboard, click on 'Indicators & Strategies' and search for Fibonacci and find the best one suited for you.
Have you ever used this indicator? What do you think the pros and cons are?
Let me know your ideas.
Good luck.

Need something to learn? ✅Hello,
Let's stop reading the charts for a while and instead learn how to read them.
There are many indicators and strategies which we can use to get better readings and understand the market better.
Under this post, please leave comments and tell us which indicators or strategies you want to know about more.
Which ones are more helpful? Which ones aren't accurate at all?
Let us know the title, and we will publish an educational idea about it.
Thank you.

Learn How to Trade Fibonacci Levels | Full Guide 📚
In this short video, I will teach you to apply Fibonacci retracement tool.
We will discuss the common levels to apply.
I will show you real market examples and we will discuss important theory.
❤️If you have any questions, please, ask me in the comment section.
Please, support my work with like, thank you!❤️

Beginners tutorial - How to correctly use your FIB tool.If you enjoyed the turorial please comment below and i will upload more of these educational videos.

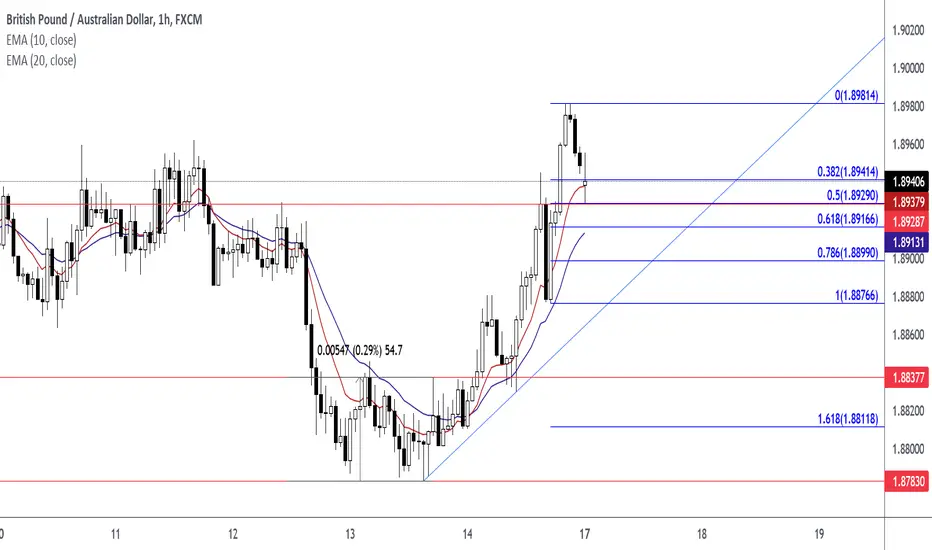
What to look for in a high probability trade set up Price pulled back and closed at the 38.2% Fibonacci Retracement Level ; 50% Fibonacci Retracement Level ; Horizontal Support Resistance Level ; EMA 10 Support Level ; EMA 20 Support Level.
These conditions created a favorable environment for a long position in the currency market. Watch for more of these conditions for high probability trade set ups.

⁉️ How to use Fibonacci Retracement?‼️ Forex traders use Fibonacci retracements to pinpoint where to place orders for market entry, taking profits and stop-loss orders. Fibonacci levels are commonly used in forex trading to identify and trade off support and resistance levels. After a significant price movement up or down, the new support and resistance levels are often at or near these trend lines . Usually the price retracts to 50% or untile OTE (0.62, 0.705, 0.79) before another impulse movement occurs.

Fibonacci Analysis - Part 1
A. Fibonacci Series
01. The Fibonacci series is a sequence of numbers starting from zero arranged so that the value of any number in the series is the sum of the previous two numbers.
02. The Fibonacci sequence is as follows:
0 , 1, 1, 2, 3, 5, 8, 13, 21, 34, 55, 89, 144, 233, 377, 610, …
B. Properties Of The Fibonacci Series
03. The series extends to infinity.
04. Divide any number in the series by the previous number; the ratio is always approximately 1.618. For example:
610/377 = 1.618
377/233 = 1.618
233/144 = 1.618
05. The ratio of 1.618 is considered as the Golden Ratio.
06. Further into the ratio properties, one can find remarkable consistency when a number in the Fibonacci series is divided by its immediate succeeding number. For example:
89/144 = 0.618
144/233 = 0.618
377/610 = 0.618
07. Similar consistency can be found when any number in the Fibonacci series is divided by a number two places higher. For example:
13/34 = 0.382
21/55 = 0.382
34/89 = 0.382
08. Also, consistency is when a number in the Fibonacci series is divided by a number 3 places higher. For example:
13/55 = 0.236
21/89 = 0.236
34/144 = 0.236
55/233 = 0.236
C. Fibonacci Retracement
09. Fibonacci analysis can be applied when there is a noticeable up-move or down-move in prices.
10. Whenever the stock moves either upwards or downwards sharply, it usually tends to retrace back before its next move.
11. ‘The retracement level forecast’ is a technique that can identify up to which level retracement can happen.
12. Fibonacci retracements are movements in the chart that go against the trend.
13. In finance, Fibonacci retracement is a method of technical analysis for determining support and resistance levels. It is named after the Fibonacci sequence of numbers, whose ratios provide price levels to which markets tend to retrace a portion of a move before a trend continues in the original direction.
14. A Fibonacci retracement forecast is created by taking two extreme points on a chart and dividing the vertical distance by important Fibonacci ratios.
15. 0% is considered to be the start of the retracement, while 100% is a complete reversal to the original price before the move.
16. Horizontal lines are drawn in the chart for these price levels to provide support and resistance levels.
17. Unlike moving averages, Fibonacci retracement levels are static prices. They do not change.
18. Because these levels are inflection points, traders expect some type of price action, either a break or a rejection.
19. The 0.618 Fibonacci retracement that is often used by stock analysts approximates to the "golden ratio".
D. How should you use the Fibonacci retracement levels?
20. Think of a situation where you wanted to buy a particular stock, but you have not been able to do so because of a sharp run-up in the stock.
21. The most prudent action to take would be to wait for a retracement in the stock in such a situation.
22. Fibonacci retracement levels such as 61.8%, 38.2%, and 23.6% act as a potential level up to which a stock can correct.
YASER RAHMATI

Why Price Matters - SPX to $4200The SPX reversal to $4,200 provides an opportunity to learn from the pros and get back to the basics of trading. This means understanding the numbers and being able to buy things wholesale and sell them at a retail price. With this knowledge, you can be a successful trader.

Just playing with a fractal idea using fibs within fibs initially the setup hadn't developed yet, so I pulled from current resistance down to support, checked overhead and to the left price history for confluence with the idea, and sure enough price action is respecting them on the money. As the chart develops I will reset the fibs to what ever the larger chart pattern begins to form.

How To Trade Pullbacks Using The Fibonacci Retracement ToolHey Purpose Traders. I pray all is well. In this video, I wanted to give you a deep, but quick insight on how you can trade pullbacks using the Fibonacci Retracement Tool.
I'd love to know your thoughts and if you have any questions. Lets chat in the comment section below.

LINKUSDT The Importance of 0.886 and 0.146 Fibonacci RatiosWhy 14.6% (.146) and 88.6% (.886) are important levels on Fibonacci retracement? The 14.6 Fibonacci ratio, wich has a high mean of assertivity, is mirroned by 88.6, which has become an important entry level and stop loss in the market. 88.6 = 1 - X, X = 14.6. These are hidden levels on the standard scale. But you can add them manually.
As you can see on chart, my fave way to use the Fibonacci Retracement is setting the .50 level at the pivot point** that precedes a pullback, i.e. the lowest low of the first downtrend. The price generally tends to retrace at least to the 0.707* level, which is another hidden level. The most common case in the crypto market, according to my experiences, is the price going into the zone between 0.886 and 0.786. In many cases touching 88.6, which can be considered a conservative point for a stop loss. If the price does not retrace from this zone, then a potential trend reversal can be considered. I have considered the range between 88.6 and 78.6 to be a 'short zone', that is, a zone where I usually wait for a reversive price action, or you could say a potential reversal zone.
When price follows the trend after retracing then I consider 14.6% as my potential target. Means that tendence continues.
This complete zig zag movement is what we call a swing, upward or downward.
*0.707 (70.7%) is the square root of 0.5 Fibonacci ratio, wich is a ratio between 1 and 2.
**Pivot points (some call them "swing points") are those areas where important short term reversals take place.
Okay, let's see what happens during this trade.
Thanks for your attention.

FIBONACCI Retracement ✅✅✅‼️ Forex traders use Fibonacci retracements to pinpoint where to place orders for market entry, taking profits and stop-loss orders. Fibonacci levels are commonly used in forex trading to identify and trade off support and resistance levels. After a significant price movement up or down, the new support and resistance levels are often at or near these trend lines . Usually the price retracts to 50% or untile OTE (0.62, 0.705, 0.79) before another impulse movement occurs.

📌Fibonacci & FIBO retracement❗✳️The author of the Fibonacci series of numbers was the Italian mathematician Leonardo Pisano. The series has been known for centuries for this series of numbers: 1, 1, 2, 3, 5, 8, 13, 21, 34, 55, 89 and so on until infinity. The number is calculated by the sum of the two previous numbers.
This numerical relationship has also been used on the financial markets for a century.The number Phi is of particular importance. Phi was created from the golden ratio. The golden ratio is the ratio of two numbers, the higher number is the numerator and the lower number is the denominator. The result is always around 1.618. Below is an example:
a = 0.618
b = 0.382
0.618/0.382 = 1.618
Golden Ratio: 0.618 + 0.382 = 1,000
🔶🔷It's all about resistance and support:
The Fibonacci retracement is a method of finding potential resistance and support zones in an underlying asset. It is based on the idea that a predetermined portion of a move from a price will bounce back. After that, the price will continue in the “real” direction. Often a correction corrects a Fibonacci percentage of a previous wave. From experience, the most common retracement levels are 38.2%, 50%, and 61.8%. These levels are watched by most analysts because they represent potential market reversal points.
🔴As an example, this chart depicts the rally of BITCOIN towards its ATH . The price drops right back to the 23.6%, after which the price stabilizes and continues in the uptrend
🔵The next chart shows the ETHUSDT on the 4H chart. As we see, the price is going back to the 23.6% and then 38.2% zone, but it failed to stabilize and falls to the next 50% retracement level and returned . Prices recovered and made a new high, continuing the previous uptrend.
⚪Fibonacci Analysis allows you to determine the support and resistance levels of a price correction and more importantly helps you find price targets and potential reversal points Almost in any market
for instance in the past rally for ADAUSDT, I used Fibonacci to determine the possible targets, and it exactly worked:🎯🏹
🔰How to draw Fibonacci retracements on the chart:
It is best to use candlestick shadows so that the analysis includes the extremes of market sentiment. Most of the time the difference is not significant, but sometimes it is crucial. The example below shows how the Fibonacci retracement was drawn to the shadows of the candlesticks from the trend low to high.
The measurement should be in the same direction as the price movement. After the measurement, the horizontal lines can be seen in the chart. These lines are potential support and resistance levels.
🔰Fibonacci retracement as part of trading strategy:
Fibonacci retracements can be very efficient for timing a trend. This method is often used by traders as part of trend strategy. With this strategy, traders monitor key price levels within a trend. This means they buy when the market is going up and sell when it is going down. Traders try to place orders in the same direction as the original trend (less risk). In this scenario, you assume that the price has a certain probability of bouncing off the Fibonacci levels and moving back in the direction of the main trend. In our example, the price dropped to the 38.2% level before correcting again. The probability of a turning point in the market increases sharply,
🔰Powerful and sometimes useful:
Fibonacci retracement is a powerful tool and useful because it often marks reversal points with uncanny accuracy. Because of this, it should be used in conjunction with other indicators to identify potential trading opportunities. also There are five types of trading tools that are based on Fibonacci's discovery: arcs, fans, retracements, extensions, and time zones and ... . The lines created by these Fibonacci studies are believed to signal changes in trends as the prices draw near them.

TYPES OF FIBONACCI's & WHEN TO USE THEM 📐📏
Hey traders,
In this article we will discuss two very popular Fibonacci tools:
Fibonacci retracement and extension.
1️⃣Fib.Retracement tool is applied to identify a completion point of a retracement leg within an impulse.
As you know price action has a zig-zag form.
For example, in a bullish trend, the price tends to set a higher high then retrace and set a higher low before going to the next highs.
In a bearish trend, the price tends to set a lower low and retrace to a lower high.
With retracement levels, we are trying to spot the point from where the next impulse in a bullish or bearish trend will initiate based on the last impulse leg.
Fib.levels that we will apply are:
✔️0.382
✔️0.5
✔️0.618
✔️0.786
The retracement levels will be drawn based on XA impulse leg.
From its low to high if the impulse is bullish
and from its high to low if the impulse is bearish.
From one of the above-mentioned levels, a trend-following movement will be expected.
One should apply different techniques to confirm the strength of one of these levels.
2️⃣Fib.Extension tool is applied to identify a completion point of the impulse.
In a bearish trend, the extension levels will indicate a potential level of the next lower low based on the length of the last bearish impulse.
Fib.levels that we will apply are:
✔️1.272
✔️1.414
✔️1.618
The extension levels will be drawn based on XA impulse leg.
From its low to high if the impulse is bullish
and from its high to low if the impulse is bearish.
From one of the above-mentioned levels, a retracement leg will initiate.
One should apply different techniques to confirm the strength of one of these levels.
Of course other ways of application Fib.Retracement and Extension levels exist. However, these two are the most common.
How do you use these levels?
❤️Please, support this idea with like and comment!❤️

Fib retracementDrop down your thoughts, concerns, questions.
Comment what you like about this video.
Thank you :)
I hope that i am able to give some value.

NYSE Comp: Broadening Top Potential Macro WarningThe NYSE composite has spent the last year building a classic broadening top pattern. The pattern develops as strong hands distribute to weak hands, and when it occurs, often marks a transition from bull to bear.
1. Broadening formations are relatively rare and because the pattern itself is difficult to trade systematically (as the boundaries are continually moving farther apart) aren't given a lot of attention in literature.
a. Edwards and Magee in their seminal "Technical Analysis of Stock Trends" suggest that the broadening top, as a rule, only appears near the end or in the final phases of long bull markets.
b. Shabacker in his classic "Technical Analysis and Stock Market Profits" also remarks that the pattern is rare, but extremely important, often marking an important transition from bull to bear.
2. In my experience both Shabacker and Edwards and Magee are correct. They are rare and generally very hard to trade (so I don't bother) but they do offer an important warning of a potential phase transition.
3. Note that the pattern isn't always well defined, with overthrows and underthrows of the pattern boundaries occuring regularly. This is what makes it hard to trade or design a trading strategy around.
a. The pattern is extremely compelling when it appears in individual equity charts.
As I see it, these are the important chart elements.
1. The composite broke the trendline from the March 2020 low. This changed the weekly trend from up to neutral.
2. After breaking the trendline, the Comp spent most of the next year moving laterally and tracing out a clear broadening formation, warning of a potential phase transition.
3. Over the last few weeks the Comp violated the rising trend line (marked on the chart) along the last three internal trend line lows, and accelerated to the lower boundary of the pattern.
4. I have included the 10 and 40 week moving averages. The two averages are roughly equivalent to the 50 and 200 day averages. Note that the 10 has rolled over and is moving to meet the flattened out 50. Often a narrowing between two moving averages marks an important market decision point. Its interesting that it is occuring at the very moment when the broadening formation appears to be nearing a conclusion.
5. If the market does begin to breakdown there are several initial move targets that can be constructed. I like to look for confluences of move targets and chart supports. The more the merrier.
a. I like to overlay the .382, .500 and .618% retracement targets first.
b. Next I locate chart supports. In this case, the area around the 14183 high from early 2020 can be expected to generate at least some buying interest.
c. There is also a measured move target that can be generated using the width of the broadening top, it projects to roughly 14400.
d. 14089 is the .382% Fibonacci retracement.
6. The support confluence provided by the pivot, the Fibo and the measured move suggest an initial support zone between 14089 and 14400. I would clearly watch this roughly 2% wide zone for reversal behaviors to either reduce shorts or perhaps, if the right behaviors develop, consider new longs.
But again, the MAIN point is not so much generating trading targets as recognizing the pattern as potentially a harbinger of an important trend change. This is particularly important against the context presented in the macro overview posts of the last few weeks.
Good Trading:
Stewart Taylor, CMT
Chartered Market Technician
Shared content and posted charts are intended to be used for informational and educational purposes only. The CMT Association does not offer, and this information shall not be understood or construed as, financial advice or investment recommendations. The information provided is not a substitute for advice from an investment professional. The CMT Association does not accept liability for any financial loss or damage our audience may incur.

Get major S&P trading levels through Pitchfan!Hey everyone, how are you all?
Let’s discuss Pitchfan and Fibonacci Channel on S&P 500. There are some bearish news in the market. The news includes Federal Reserve’s stance on increasing the interest rates, making investors shifting into the bond markets. Netflix down by 22%. Your trades should always respect the fundamental analysis. Don’t try to go against it.
Market Condition:
S&P Index has been in a massive uptrend, giving around 120% returns from its previous low on 20 March 2020. It has been in uptrend since March 2020, having few corrections. But, with Pitchfan, we can catch all these corrections with high accuracy.
Pitchfan
Pitchfan is a mixture of Fibonacci Fan and Pitchfork. It uses both of their levels and has some features of Gann Fan too. The red coloured line is the median line which is the main support and resistance line. The other lines have importance according to Fibonacci’s rules. Main lines are 0.382, 0.5, 0.618. We have kept 0.25 because it is the median of the red line and the 0.5 level of Fibonacci. You can use my levels through the picture in the chart.
How to draw a pitchfan?
Pitchfan is drawn at the starting of a trend. Here, the market was consolidating before entering into the uptrend. A is the the first low of the trend, B is the next high and C is the next low. It can be drawn on the higher timeframes. Refer to the image below.
How to trade these levels?
These lines are the major points where the trend reverses on the lower timeframes. We can use these levels to trade. You need to check two things to get the direction of the trade:
The current trend matches on both the higher timeframes and the lower timeframes.
The news is in the same direction as your trade.
After this, you have to get the best entry. For this, you need to get these three confirmations:
Candlestick Pattern
Fibonacci Retracement or any Chart Pattern
RSI or any other Oscillator
Check out the below chart image to get the perfect entry:
Observations:
Price will touch these lines in 70% of the cases. Price might not touch these lines in 30% of the cases due to sentiments or any other driving factor.
When price passes by any major level, it will always take a pullback on the lower timeframes. You may trail your stop loss or enter into the trade by checking out the pullback.
Targets?
Target can be the next line coming in the direction of the trade. Always have RR of 3 or more. You can always trail the stop loss after checking out for the pullback on the lower timeframes.
Always check the news before carrying your positions overnight.
S&P might bounce back from the yellow level, from the blue demand zone. If it breaks it, our target will be the red median line.
Fibonacci Channel:
Fibonacci channels gives the major turning levels too. Here, you can see the price is bouncing back from the 0.5 to 0.618 levels, and it has happened multiple times. You can take confirmations on the lower timeframes and take the trades accordingly. Do let me know if you want to learn how to make it.

Trading The 50% Retracement LevelDraw Fibonacci Retracement Level.
Wait For The Pull Back To The 50% Retracement Level.
Enter when rejection candlestick forms at the 50% Retracement Level.
Bearish Entry ExampleThis kind of price action happens all the time, you just have to spot it while it's happening so that you can plan your trade and execute. I have put this together to give you an idea of the type of things I look for in the hope that it can help you too.
Once price action has made a clear impulse to the upsides and taking out previous structure that's our first sign that the buyers are stepping in. Once we see some corrective price action we can place our fib from the high to low, mark out previous structure and identify the pattern that price is making to build a picture of where price is most likely to reverse giving us the best possible entry.
