USDCAD: Strong Bullish Pattern
USDCAD will rise more today, following a confirmed bullish breakout
of a resistance line of a bullish flag pattern.
Expect a rise after a completion of a pullback.
Flag

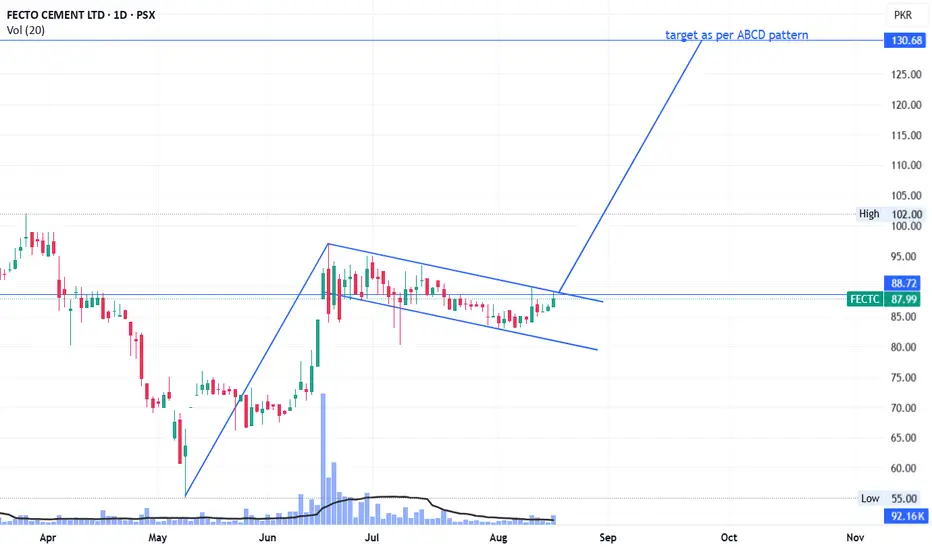
FECTC LongFECTC is forming a bullish flag pattern.
Next target as per ABCD pattern is 131 (on bigger time frame, you can see a cup formation).
Handle will form after that and target of cup and handle will be ~ 220 to 240.
On monthly time frame, golden cross is about to happen which is again a bullish indicator.
WTI Crude | Oversupply Pressures Below Key AveragesWTI crude remains under pressure as the September sell-off extends. Rising supply from OPEC+ easing cuts and Russian export adjustments continue to outweigh seasonal demand, while U.S. macro indicators point to a softer consumption backdrop. The Fed’s September rate cut offered little support, with demand signals still muted and inventories building.
Technically, WTI trades below both the 20- and 50-day moving averages, reinforcing a bearish tone. Price action remains capped within a consolidation channel, with sellers defending the upper boundary. A sustained failure to reclaim the moving averages leaves scope for further downside toward the anchored VWAP from April lows and the broader $60–62 zone.
For now, crude sits at an inflection point: oversupply fears and soft demand keep pressure on the downside, while only a breakout above recent consolidation highs would begin to shift momentum.

XAUUSD (Gold) Technical Outlook Towards the downside– 4H ChartGold has been in a strong uptrend for some time, trading within a rising channel.
🔹 Key Observations
* A bullish flag formed during the climb, signaling continuation.
* Price recently made the 2nd touch on the channel’s upper trendline.
* After that, it started to move slightly downwards, now retesting a **support level (better confirmed on lower timeframes).
🔹 Expectations
* A possible short-term pullback towards previous resistance levels seen on higher timeframes.
* This aligns with the idea of a 3rd touch on the lower trendline of the ascending channel, which may act as support.
If the support holds, price may resume its uptrend continuation.
If broken, it could signal a deeper correction before the next leg up.

NASDAQ Bearish Flag SetupPrice is currently in a supply zone. An estimated measured move target will take price to a demand zone.
Always wait for a break out and retest as confirmation before entering.

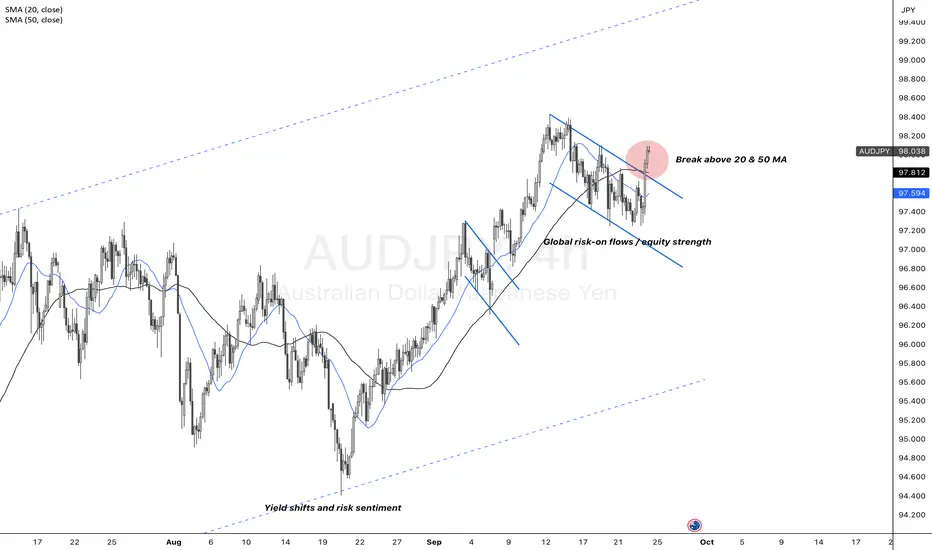
AUDJPY | Fresh Flag Breakout Within Channel – What’s Next?AUDJPY has extended its breakout from the flag formation, reinforced by a decisive move above the 20- and 50-day moving averages. This alignment signals strengthening trend momentum within the broader ascending channel. Near-term catalysts remain RBA policy signals, BOJ guidance, and broader risk sentiment, with the upper channel boundary now the next technical focus.
MARIPSX MARI :: Day Level
📈 MARI Trading Recommendation
Current Market Price (CMP): PKR 685
💎 Bullish Bias: BUY & HOLD
✅ My clear view: MARI is a strong buy for long-& Mid term investors. Fundamentals are solid, and the recent dividend announcement strengthens the positive outlook.
💹 Long-Term Investors:
Enter at the current price for early entry and hold for very strong returns.
Support Levels for Accumulation (if price dips):
🔹 654 (immediate support; key level after breaking smaller range Jan–Sep 2025)
🔹 643
🔹 620
🔹 610
This allows accumulating MARI at discounted prices while maintaining a bullish long-Mid term view.
📊 Technical Outlook:
Range Bound: Since January 2024, MARI has been trading in a broader range of 590–744.
Resistance: 723–744
Support: 590–612
Smaller Positive Range: 605–654, which has been positively broken.
654 now acts as key support.
⚡ Intraday / Short-Term Traders:
Monitor daily price action carefully. Not recoomended for intraday Trading but can manag as per below:
Rule: Do not hold if the price closes below 654 with a bearish candle on the daily chart.
A break below may lead to pullbacks toward 643–610.
Target TP1: 723 TP2: 744
Pattern: Formation of a bullish flag indicating potential upward movement.
✅ Summary:
Long-Mid term: Buy & hold 💎
Short-term: Watch 654 closely ⚡
Market sentiment favors upward movement, making MARI attractive for both accumulation and swing trading.

DOW JONES (US30): Confirmed BoS & More Growth
I see another confirmed break of structure and a violation
of an important intraday horizontal resistance on a 4h time frame on US30 Index.
Odds will be high, that the market will continue rising.
Next resistance - 46550
❤️Please, support my work with like, thank you!❤️
I am part of Trade Nation's Influencer program and receive a monthly fee for using their TradingView charts in my analysis.

bullish pattern for GBPNZDprice has successfully broken the bullish flag pattern in the upward direction, made a bit of a retest, and is now ready towards the projection of the bullish flag pattern target

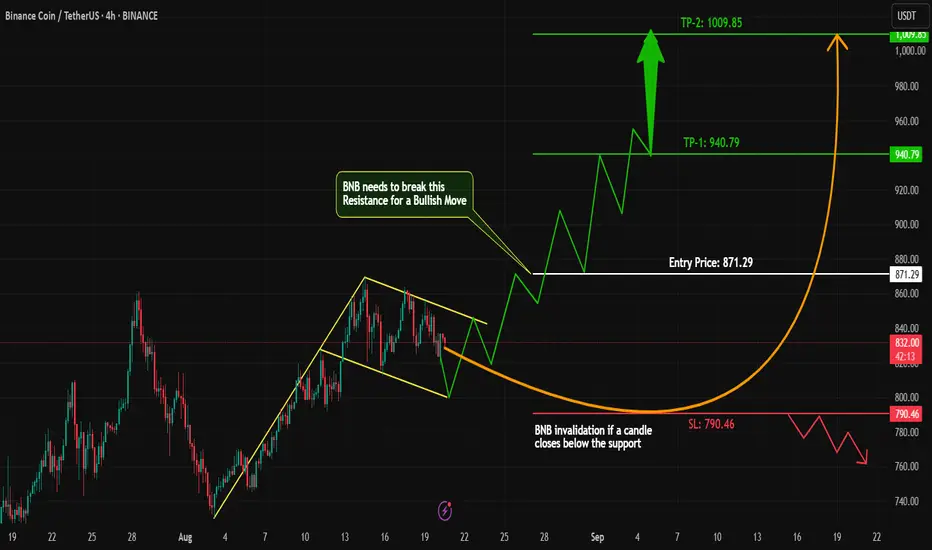
BNB Bullish Setup – Breakout on the Horizon?#BNB has been moving in a perfect bullish trend, consistently printing new highs and showing strong momentum.
On the 4H timeframe, price has tested the 860–868 zone multiple times – this is our key resistance level to watch.
Currently, #BNB is forming a bullish flag pattern, which often acts as a continuation signal in strong uptrends.
Bullish Confirmation Plan:
Wait for a clean breakout above the flag and resistance zone (860–868).
On a successful retest of support, we can look for long entries.
Always apply proper risk management to protect capital.
Key Levels to Watch:
Resistance: 860–868 (major breakout zone)
Support: Recent flag lower boundary
If #BNB breaks this zone with volume, we could see a strong continuation towards new highs.
What do you think? Is BNB gearing up for another rally? Drop your thoughts below and let’s discuss!
#BNB #Crypto #Altcoins #TradingStrategy #Bullish #Breakout #CryptoTrading #BNBAnalysis #CryptoCommunity #TradingView
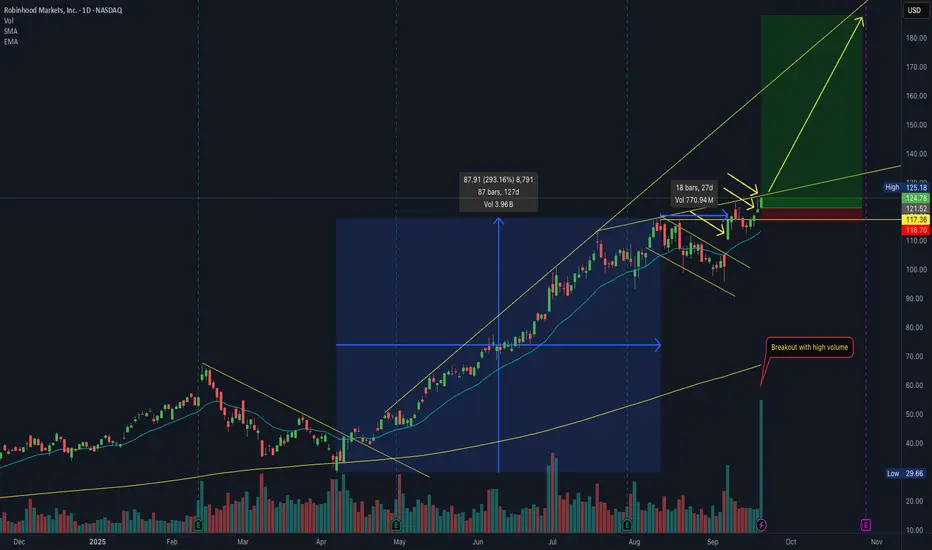
Potential Buy Setup – $HOOD Breakout on High VolumeKey points:
• Growth of 293% in the previous 4 months
• Consolidation phase of nearly 1 month after the growth, with low volume and respecting the EMA21
• Beginning of a flag breakout with average volume surging more than 50%
• Continuation breakout above the previous high with another volume surge
-------------
Dear friends,
I trade the markets using a structured, multi-stage strategy that combines technical analysis, price action, and market psychology. My approach includes key concepts such as candlestick patterns, trendlines, support & resistance, Elliott Wave theory, and price channels. I also integrate strategies from O’Neil’s CANSLIM, Minervini’s SEPA, Oliver Kell’s momentum trading, and Qullamaggie’s breakout setups.
Good luck!
DOGEUSD UP PATTERNLooking for chart pattern, im able to see a flag pattern after the triangle pattern,
If you take a look what DOGE did few months ago, u will see the same pattern. If u wanna make sure take a look to the ghost candle that is on yellow.

NTL New Talisman Weekly ChartFull disclosure I own this stock already but follow it because it is in my portfolio...
Currently breaking out of flag pattern, with potential target of $0.14
Doesn't sound like much.. but that is >100% above where we are right now
This stock is not for the faint hearted - if you are risk adverse stay clear...
this is 100% not advice...
Just highlighting technical setups for those who are interested in what they look like in real time

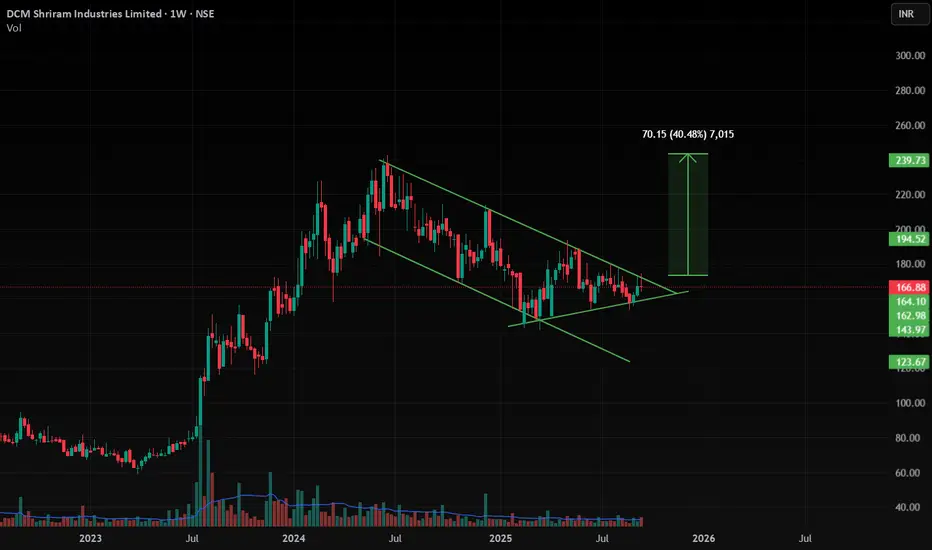
DCMSRIND , 1W Breakout In this stock we clearly see the Channel pattern is formed and Ready for Breakout , Wait for candle Close in 1D with good volume , then we can see very good move up to 40% nearly .
As now nifty is given Breakout from 1D Channel pattern and in Market Breadth 1D has given breakout and in weekly market Breadth it is near the Resistance , if we see good volume close in this week we can expect Market will be Bullish for next 2-3 Months .
Follow for more Swing Ideas Like This .
EURNZD Bullish Breakout Watch: High & Tight Flag SetupWe’ve got an interesting setup on the EURNZD—not necessarily a Grade A trade in my playbook, but definitely one worth keeping on the radar.
Currently, price is holding at a key level of structure, but instead of reversing, it’s consolidating sideways, forming a channel / high & tight flag pattern.
👉 If we see a confirmed bullish breakout, this setup could offer a powerful trend continuation opportunity with massive profit potential to the upside.
If you have any questions, comments, or want to share your trading ideas, please do so below!
Akil

A descending channel/bullflag reveals itself on btcusdThe pole looks more obvious on longer timeframe charts but the flag/ channel itself is best illustrated on the 1day time frame. In fact there is a much longer pole than the one shown here on the monthly chart, but I didn’t go with that one because the flag on the monthly is more of a horizontal channel than the descending channel shown here on the 1day chart. *not financial advice*

GOLD XAU/USD UpdateGold is trading around 3685 after pulling back from recent highs. The market is consolidating but the bigger picture still shows momentum building. A sustained push higher could open the way toward the 3800 breakout zone.

GBPUSD | BoE Signals Exhaustion in Sterling RallyLast week we posted a bullish idea on Cable. That view has now played out, and we believe GBPUSD looks exhausted. The technical picture suggests another leg lower is forming — potentially completing a double zigzag structure.
The latest Bank of England meeting gave markets little reason to extend the pound’s rally. The BoE held rates steady at 4%, but the tone was far from constructive. While two members pushed for a cut, the majority stressed lingering inflation pressures, especially in services and food. This cautious stance effectively keeps policy restrictive, limiting the scope for GBP strength.
At the same time, the central bank slowed the pace of its quantitative tightening programme, reducing annual gilt sales from £100bn to £70bn, and scaling back long-dated bond disposals. This was read as a signal of unease around market functioning. In practice, it tilts expectations towards a softer BoE down the line — a backdrop that does not support sustained GBP demand.
On the technical side, Cable has broken lower from its ascending channel, with RSI showing room to extend further down. Momentum is shifting away from the bullish camp, and price action is now leaning towards a downside continuation.
Scenarios:
If the break below the ascending channel holds, momentum could carry GBPUSD toward the 1.3100 area.
If buyers reclaim the channel, short-term relief is possible, but the macro backdrop still caps upside.
Takeaway: The BoE’s cautious tone and slower QT reinforce the case that GBPUSD upside is exhausted. Watch the channel break — it’s the key inflection for the next leg lower.

GBPUSD | Consolidation Above 1.35 – Breakout or Breakdown?Macro Hook:
Sterling turned higher after the BoE’s hawkish lean in early August. Since then, Cable has been driven by two forces: UK’s sticky inflation (slowing the BoE’s path to cutting rates) and softer US data (feeding expectations of Fed cuts and a weaker dollar). Yesterday’s softer US PPI hinted at easing price pressures upstream, and today’s Core CPI will decide whether that dovish Fed story holds or gets challenged.
Technical Lens:
The breakout from the descending channel created an impulse leg higher, and price is now consolidating in a corrective flag above the 1.35 handle. The 20/50 MAs remain supportive, showing trend momentum is still in play as long as 1.35 holds.
Scenarios:
If Core CPI comes in line or softer → USD stays pressured, Cable could break the corrective channel to the upside and continue its September climb.
If Core CPI surprises hot → Fed cut bets may be pared back, boosting USD and risking a Cable drop under 1.35 back toward old resistance/now support.
Catalysts:
US Core CPI today — sticky vs soft outcome will shape Fed cut pricing.
UK CPI mid-Sept — could confirm whether inflation remains sticky enough to delay BoE easing.
Fed FOMC later this month — tone and dot-plot guidance key for USD direction.
Takeaway:
1.35 is the decision point. Hold above, and the bullish impulse stays alive. Lose it, and the correction deepens — especially if US inflation surprises on the hot side.

ETHUSDT 4h
CRYPTOCAP:ETH might be ready to pop!
Entry: $4,869
Target: $6,136
Consolidation looks like a spring ready to launch 🚀
Keep eyes on the breakout!
DYOR & NFA
#ETH #Crypto

CRUDE OIL (WTI): Strong Bullish Confirmation?!
Update for my yesterday's idea for WTI Crude Oil.
The price retested a recently broken structure and we see a
strong bullish reaction to that today.
A bullish violation of a resistance line of a falling wedge pattern
indicates a strong buying pressure.
I think that the market will continue growing and reach 64.65 resistance soon.
❤️Please, support my work with like, thank you!❤️
I am part of Trade Nation's Influencer program and receive a monthly fee for using their TradingView charts in my analysis.

ETHEREUM (ETHUSD): Bullish Trend Continues
I see a nice bullish confirmation on Ethereum after a recent pullback.
The price formed a double bottom pattern and violated its neckline
and a resistance line of a falling wedge pattern.
With a high probability, the market will go up.
Goal - 4741
❤️Please, support my work with like, thank you!❤️
I am part of Trade Nation's Influencer program and receive a monthly fee for using their TradingView charts in my analysis.

Bitcoin BTC price analysis FOMC Fed rate🚀 CRYPTOCAP:BTC price is rising, while altcoins remain silent.
What happens tomorrow when the Fed announces its new rate? 🤔
📊 Expectations:
98% believe in a -0.25% cut
2% expect -0.5%
and no one believes it will stay unchanged at 4.5%
That’s why the market has already priced this in. But tomorrow, once the official decision comes — everything could flip ⚡️
📉 The chart looks like chaos to most, but a "trained eye" sees harmony: candles moving level to level.
🔑 Key zones for OKX:BTCUSDT :
Upper channel boundary: $117,800 – $118,000 (only breakable on massive volumes).
September is statistically weak. It opened at $108K, that’s the “zero point”. Logical scenario — dip to $102K.
😬 Worse scenarios:
$96,500
GAP close at $91,600 (but you’ll roast us for this one 😂).
❓Your take: By the end of September, will #Bitcoin be above $108K or below?
______________
◆ Follow us ❤️ for daily crypto insights & updates!
🚀 Don’t miss out on important market moves
🧠 DYOR | This is not financial advice, just thinking out loud.
