Bitcoin range: 110k defended, 111.9–114k caps the upside__________________________________________________________________________________
Market Overview
__________________________________________________________________________________
BTC is consolidating above 108.7–109.0k after the pullback from ATH, capped under 111.9–114.0k. Short-term momentum is improving while 6H/12H remain corrective.
Momentum: 📈 Neutral-to-slightly bullish above 110k, but capped by 111.9–113.5k; 6H/12H still in a corrective trend.
Key levels:
- Resistances (HTF/MTF) : 111.9–113.5k (W/720 pivots), 114.0k (240 PL→R), 120.0k (W PH).
- Supports (HTF/MTF) : 110.0–110.2k (recent shelf), 108.7–109.0k (720 PL cluster), 107.3k (240 PL).
Volumes: Very high on 2H/1H/30m/15m; normal on 1D → credible rebound, not yet HTF-validated.
Multi-timeframe signals: 1D in NEUTRAL BUY above 108.7k; 12H/6H/4H trending down (sell-the-rips below 111.9–113.5k); STTF (2H/1H) improving on volume.
Risk On / Risk Off Indicator context: SELL (moderate risk-off) → contradicts the intraday bounce, so be cautious until 114.0k is reclaimed.
__________________________________________________________________________________
Trading Playbook
__________________________________________________________________________________
Compressed range: favor opportunistic executions at the edges; wait for confirmed breaks.
Global bias: Neutral-to-slightly long above 110k while 108.7k holds; swing invalidation on 1D close below 108.7k.
Opportunities:
- Defensive buy on 110.0–110.2k retest; target 111.9k then 113.5k if break confirms.
- Tactical sell on rejection at 111.9–113.5k; target 110.0k then 108.8k.
- Breakout buy if 12H/1D close >114.0k; target 117.4k.
Risk zones / invalidations:
- Loss of 108.7k on HTF close invalidates longs, opens 107.3k then 95.3k if weakness extends.
- Acceptance >114.0k invalidates most shorts, exposing 117.4k.
Macro catalysts (Twitter/News):
- Fed leaning to a 25bp cut (Sep 17 FOMC) with a bull steepener → supports dip buys if ISM/Jobs confirm.
- Gold at record (>3,500$/oz), softer USD, Asian equities broadly positive → mild tailwind for risk.
- Policy divergence (ECB dovish, BOJ cautious) + geopolitics → potential capping below 113.5–114.0k.
Action plan:
- Long Plan: Entry 110.0–110.2k / Stop 109.6k / TP1 111.4k, TP2 111.9k, TP3 113.5k (≈1.8–2.5R).
- Short Plan: Entry 112.0–113.0k on rejection / Stop 113.7k / TP1 110.0k, TP2 108.8k, TP3 107.3k (≈1.6–2.2R).
__________________________________________________________________________________
Multi-Timeframe Insights
__________________________________________________________________________________
Overall, timeframes are compressing: HTF resilient, MTF corrective, STTF recovering on strong volumes.
1D: Holding above 108.7–109.0k; acceptance >114.0k would open 117.4k then 120.0k.
12H/6H/4H: Lower highs/lows, favor sell-the-rips below 111.9–113.5k; rejection there likely retests 110.0k then 108.8k.
2H/1H/30m/15m: Strong-volume rebound; as long as 110k holds, a squeeze toward 111.9k then 113.5k is possible; losing 110k points back to 108.8k.
Key confluences: Multi-TF support 108.7–109.0k; ceiling 111.9–113.5k with 114.0k as decision level → compressed structure favors an imminent move.
__________________________________________________________________________________
Macro & On-Chain Drivers
__________________________________________________________________________________
Macro modestly supports dip-buys while background risk-off tempers upside; on-chain is neutral-to-cautious, aligned with the technical range.
Macro events: Markets price Fed cuts with a bull steepener; gold at record (>3,500$/oz), softer USD, Asia broadly green; ECB leaning dovish, BOJ cautious; upcoming US CPI/PMI/ISM and Jobs in focus.
Bitcoin analysis: Ichimoku Tenkan/Kumo as overhead resistance; key pivot 110.4–110.7k; some watch 103–100k on downside; ETFs saw net inflows in August despite -6.5% spot → ongoing institutional demand.
On-chain data: Large transfers (e.g., 7,860 BTC, 6,002 BTC) → potential liquidity/volatility; 6m/CTH cost basis near 107–108.9k as support; STH stress near 113.6k; no broad capitulation (SOPR ~1).
Expected impact: Confluence for a 108.7–113.6/114.0 range; easing bias may help a topside break if volumes persist, otherwise rallies cap below 114.0k.
__________________________________________________________________________________
Key Takeaways
__________________________________________________________________________________
BTC sits between 110k support and 111.9–114.0k resistance, with strong intraday volumes but a risk-off backdrop.
- Trend: neutral-to-slightly bullish above 110k, yet MTF remains corrective.
- Best setup: defensive long at 110.0–110.2k with <109.6k invalidation, or rejection short at 111.9–113.5k.
- Macro: Fed cut path and softer USD support dips, but caution below 114.0k.
Stay nimble: trade the edges and wait for a close >114.0k or <108.7k for direction. ⚠️
FOMC

USDCAD Pullback Toward 1.37900 as Dollar Weakness PersistsHey Traders, in today's trading session we are monitoring USDCAD for a selling opportunity around the 1.37900 zone. USDCAD is trading in a downtrend, with price currently correcting toward this key support/resistance level.
Structure: The broader bias remains bearish, but price is retracing upward after recent lows.
Key level in focus: 1.37900 — a critical area where sellers may look to re-enter and push the pair lower.
Fundamentals: The U.S. Dollar Index (DXY) maintains a bearish tone as Jerome Powell’s recent dovish stance weighs on the greenback. With DXY approaching 97.800 resistance, further downside pressure on USD could reinforce USDCAD weakness.
Trade safe,
Joe.

USDJPY Rebound Faces 148.300 Resistance, Eyes on 146.900 Target!Hey Traders, In today's trading session we are monitoring USDJPY for a selling opportunity around 148.300 zone. USDJPY has been moving lower overall, with price currently correcting toward the 148.300 area.
Structure: The broader bias has been bearish, but recent price action is showing a short-term pullback.
Key level in focus: 148.300 — previously acted as support/resistance.
Next move: Rejecting this zone could resume the bearish move, with 146.900 as a potential target since it aligns with the partial trend and a key support area. A break above 148.300, however, would question the downside bias.
Monitoring how price reacts around 148.300 to see whether sellers regain control or if the correction deepens.
Trade safe,
Joe.

FOMC and Market Reactions – Simple Logic Explained💎MJTrading:
The Federal Open Market Committee (FOMC) guides U.S. interest rates. Their decisions ripple through all major markets, not just the dollar.
🔑 How It Works (Simple View):
- When the Fed signals higher rates, the USD demand rises (investors seek higher returns), while gold, stocks, and crypto often fall because money becomes “more expensive.”
- When the Fed signals lower rates or slows tightening, the USD loses demand, and money flows into assets like gold, stocks, and crypto.
🔍 Why a Rate Cut Weakens the Dollar:
* Cutting rates means borrowing money becomes cheaper.
* Investors earn less return by holding USD in banks or bonds.
* This lowers demand for the dollar, making it cheaper in global markets.
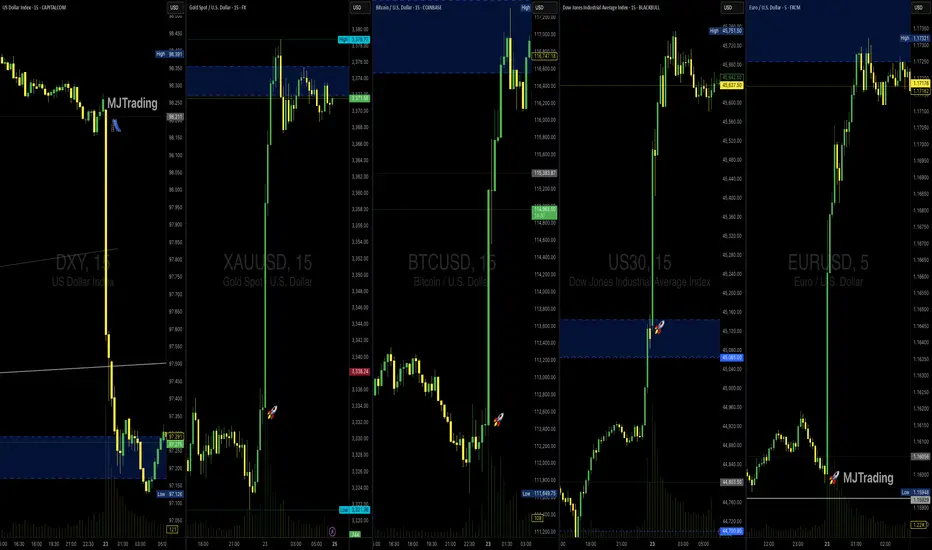
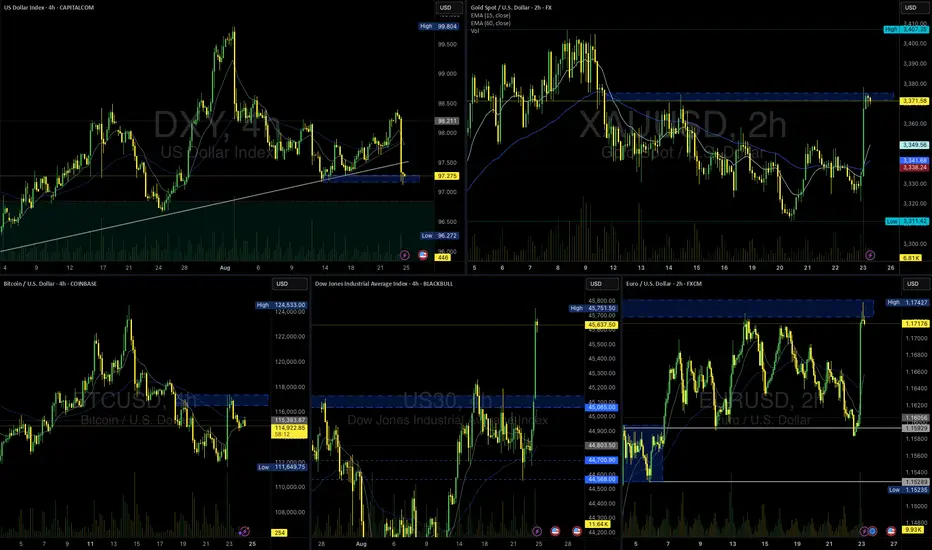
📊 What the Current Charts Show:
CAPITALCOM:DXY (Dollar Index): Sharp drop → less demand for USD.
FX:XAUUSD (Gold): Demand rises as an alternative store of value.
FX:EURUSD : Euro strengthens against weaker dollar.
BINANCE:BTCUSD : Risk appetite returns, lifting crypto.
BLACKBULL:US30 (Dow Jones): Stocks benefit as liquidity shifts from USD into equities.
⚡ The Core Reason – Demand & Supply
Weaker dollar = reduced demand for USD, so supply flows into gold, stocks, euro, and crypto.
🔮 Looking Ahead – Will the Rally Continue?
The rally may extend if the dollar remains under pressure and the Fed stays dovish.
But caution: after the first strong impulse, markets often retrace to test demand zones before continuing.
Next week’s momentum will depend on whether buyers can sustain demand beyond the initial FOMC reaction.
👉 Takeaway for Traders:
FOMC moves aren’t random. They’re driven by where capital finds the best return. Understanding this demand–supply flow helps explain why all charts move together in these moments.
#MJTrading
#FOMC #DXY #XAUUSD #EURUSD #BTCUSD #US30 #Forex #Gold #TradingEducation #Rally
Psychology Always Matters:
FOMC and Market Reactions – Simple Logic Explained💎 MJTrading:
The Federal Open Market Committee (FOMC) guides U.S. interest rates. Their decisions ripple through all major markets, not just the dollar.
🔑 How It Works (Simple View):
- When the Fed signals higher rates, the USD demand rises (investors seek higher returns), while gold, stocks, and crypto often fall because money becomes “more expensive.”
- When the Fed signals lower rates or slows tightening, the USD loses demand, and money flows into assets like gold, stocks, and crypto.
🔍 Why a Rate Cut Weakens the Dollar:
* Cutting rates means borrowing money becomes cheaper.
* Investors earn less return by holding USD in banks or bonds.
* This lowers demand for the dollar, making it cheaper in global markets.
📊 What the Current Charts Show:
DXY (Dollar Index): Sharp drop → less demand for USD.
XAUUSD (Gold): Demand rises as an alternative store of value.
EURUSD: Euro strengthens against weaker dollar.
BTCUSD: Risk appetite returns, lifting crypto.
US30 (Dow Jones): Stocks benefit as liquidity shifts from USD into equities.
⚡ The Core Reason – Demand & Supply
Weaker dollar = reduced demand for USD, so supply flows into gold, stocks, euro, and crypto.
🔮 Looking Ahead – Will the Rally Continue?
The rally may extend if the dollar remains under pressure and the Fed stays dovish.
But caution: after the first strong impulse, markets often retrace to test demand zones before continuing.
Next week’s momentum will depend on whether buyers can sustain demand beyond the initial FOMC reaction.
👉 Takeaway for Traders:
FOMC moves aren’t random. They’re driven by where capital finds the best return. Understanding this demand–supply flow helps explain why all charts move together in these moments.
#MJTrading
#FOMC #DXY #XAUUSD #EURUSD #BTCUSD #US30 #Forex #Gold #TradingEducation #Rally
Psychology Always Matters:
Click on the image to read the caption.
FOMC mins could be rates catalyst if Powell is neutral at JHSTraders are laser-focused on the release of the FOMC meeting minutes, which could prove to be the most significant market-moving event ahead of the Jackson Hole Symposium if Powell offers no insights. With markets already pricing in an 85% chance of a rate cut at the September meeting, the tone and details within the minutes will be crucial. The last FOMC meeting saw a strong division among members, with the decision to hold rates steady hinging on strong jobs data—a data point that was later revised downward, fueling speculation about a potential shift in the Fed’s outlook.
The upcoming minutes offer the Fed an opportunity to clarify its stance, especially in light of the softer jobs numbers and mixed inflation signals. Traders will be watching closely for any signs that the Fed is becoming more dovish, which could reinforce expectations for a September cut, or for hints of caution that might temper those hopes. Ultimately, while Powell’s speech at Jackson Hole will set the broader policy tone, the FOMC minutes tonight may provide the first real clues about how the Fed is weighing recent economic developments and what that means for rate policy in the months ahead.
The market is more dovish than the Fed’s own projections, so any hawkish signals could prompt a repricing. Gold is inversely correlated with the dollar and Fed policy. If Powell is less dovish, gold could see downside, with key support at $3,270 and potential for a move down to $2,934 if the triangle pattern breaks lower. Upside targets, if the pattern breaks higher, are $3,773–$3,785, with a 66% statistical chance of reaching the measured move.
The current price action suggests a symmetrical triangle, which is a neutral pattern but slightly favours continuation of the prevailing trend (bullish in this case). Watch for a break of $3,270 for downside or a move above the triangle for upside momentum. RSI divergence and an ending wedge pattern hint at a possible reversal, so traders should stay alert for shifts following the FOMC minutes and Powell’s speech.
This content is not directed to residents of the EU or UK. Any opinions, news, research, analyses, prices or other information contained on this website is provided as general market commentary and does not constitute investment advice. ThinkMarkets will not accept liability for any loss or damage including, without limitation, to any loss of profit which may arise directly or indirectly from use of or reliance on such information.

XAUUSD – US Session Weekly Close Update - FED NEWS📰 Macro Outlook
The Federal Reserve remains firm on its 2% inflation target while keeping unemployment low.
The US labor market is showing signs of weakness: job supply stagnates, demand falls → higher unemployment risk.
New tariffs could push inflation higher while also slowing down economic growth.
Fed gradually moves away from FAIT, focusing back on a strict 2% inflation goal.
Powell didn’t promise rate cuts, but hinted at possible policy easing in September if economic conditions align.
🔑 Key Technical Levels
Buy Retest Zone: 3343 – 3345
Mid-term Resistance: 3377 – 3380
Target Buy Zone: 3396 – 3400
✅ Primary Scenario (Bullish Bias)
After a strong breakout from the downtrend, price is likely to retest 3343 – 3345 to build momentum.
Holding above this zone opens the path to 3377 and potentially 3396 – 3400.
🔻 Alternative Scenario
A clean break below 3340 with an H1 close could push price lower toward 3325 – 3320 before a possible recovery.
🎯 Trading Plan for the US Session
BUY on retest 3343 – 3345
SL: below 3338
TP: 3377 → 3396 → 3400
Short-term SELL only if strong rejection appears around 3396 – 3400.
⚡ As liquidity thins out toward the weekend, it’s safer to follow the bullish momentum, scale positions wisely, and avoid chasing price near key resistances.

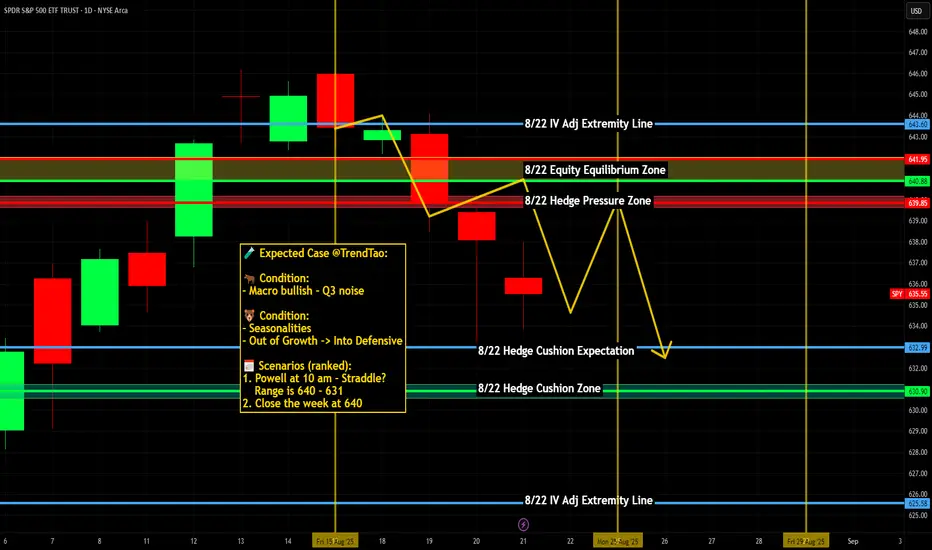
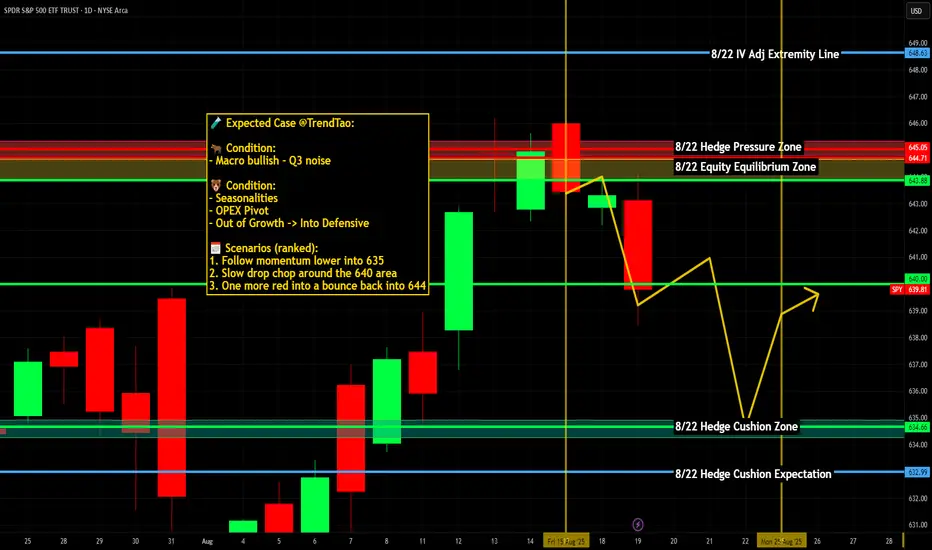
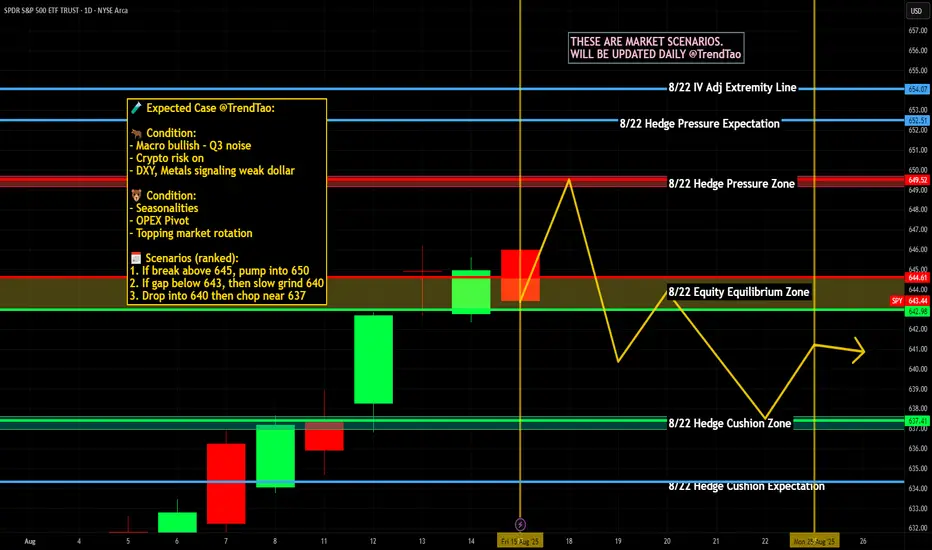
Nightly $SPY / $SPX Scenarios for Friday, August 22, 2025🔮 Nightly AMEX:SPY / SP:SPX Scenarios for Friday, August 22, 2025 🔮
🌍 Market-Moving News
Powell’s Jackson Hole keynote is the main event (10:00 AM ET). Markets want clarity on the path to cuts and any framework tweaks; the Fed’s own calendar lists the speech and KC Fed confirms the Aug 21–23 agenda. $SPY/$TLT/ TVC:DXY are the most sensitive.
Risk tone turned cautious into the speech. Stocks faded Thursday as traders de-risked ahead of Powell; positioning is tight and headline-sensitive.
Dollar firm / gold steady into Jackson Hole. Classic pre-keynote safety bid; futures price a high probability of a September cut, keeping two-way risk for rates and equities.
Global cues: Japan CPI lands overnight; UK retail sales postponed. Japan’s July inflation print hits before U.S. cash open; the U.K.’s July retail sales were pushed to Sep 5, trimming one macro catalyst from the tape.
📊 Key Data & Events (ET)
10:00 AM — Fed Chair Powell @ Jackson Hole (Keynote). Why it matters: Sets near-term curve path and risk appetite; watch $TLT/ TVC:TNX and TVC:DXY → AMEX:SPY reaction.
1:00 PM — Baker Hughes U.S. Rig Count. Why it matters: Energy activity → supply expectations → $CL_F/ AMEX:XLE ; persistent rig drift can nudge inflation expectations. (Released weekly at noon CT/1 PM ET.)
Overnight — Japan CPI (Jul). Why it matters: Yen rates and global FX spillovers; a surprise could ripple into U.S. risk before the keynote.
All day — Jackson Hole Symposium continues. Why it matters: Secondary speakers can color post-Powell reaction as positioning resets.
⚠️ Disclaimer: Educational/informational only — not financial advice.
📌 #trading #stockmarket #SPY #SPX #Fed #JacksonHole #Powell #DXY #TLT #Gold #Energy #RigCount
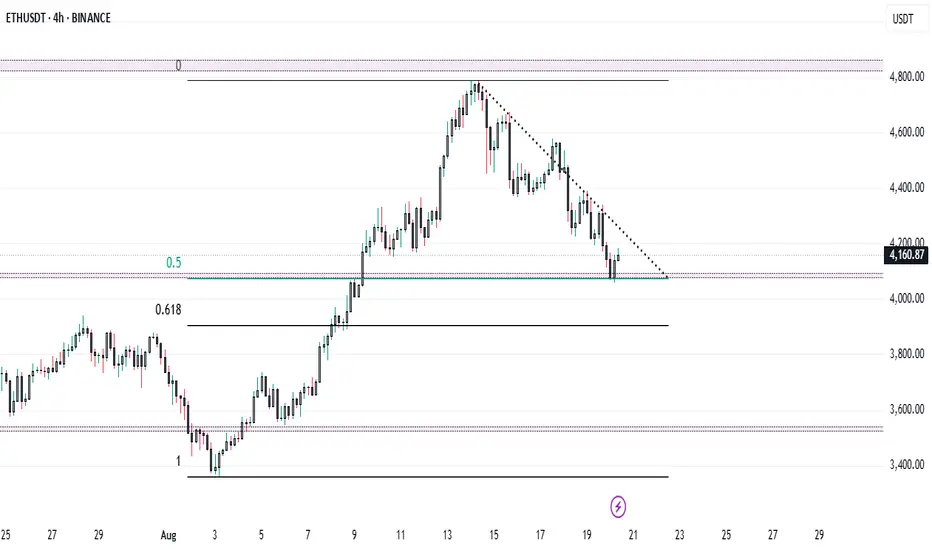
ETH at $4,100 – Can Bulls Defend Key Support Before FOMC..?ETH + FOMC = Volatility Ahead ? 🔥
Ethereum at Make-or-Break Zone: $4,100 Support in Focus!
Ethereum (ETH/USDT) on the 4H timeframe is showing a decisive battle between bulls and bears. After topping near $4,700, ETH has been in a steady downtrend, respecting the descending trendline.
🔑 Key Levels to Watch
* Immediate Support: $4,100 – $4,150 (0.5 Fib retracement)
* Major Support: $3,950 – $4,000 (0.618 Fib retracement)
* Resistance Zone: $4,300 – $4,350 (descending trendline)
* Major Resistance: $4,600 – $4,700 (recent swing high)
📈 Bullish Scenario
✅ A breakout above $4,300 trendline resistance could trigger strong momentum toward $4,500 - $4,600.
✅ Holding $4,100 support will keep buyers in control.
📉 Bearish Scenario
❌ If ETH fails to hold $4,100, expect a deeper retracement toward $4,000 (0.618 Fib).
❌ A break below $3,950 may extend the fall to $3,700 – $3,600.
⚠️ Market Note
📌 Today’s FOMC meeting could heavily impact the crypto market trend.
Expect volatility as Fed commentary on interest rates may guide ETH’s next major move.
⚖️ Conclusion
ETH is at a critical support zone where the next move will define short-term direction.
* Above $4,300 → Bulls regain control.
* Below $4,100 → Bears target $4,000 and lower.
Nightly $SPY / $SPX Scenarios for Wednesday, August 20, 2025🔮 Nightly AMEX:SPY / CBOE:SPX Scenarios for Wednesday, August 20, 2025 🔮
🌍 Market-Moving News
Jackson Hole in focus; dollar firms. Traders lean ~84% odds of a 25bp cut in September; watch TVC:DXY vs. $SPY/ NASDAQ:TLT as Powell risk approaches.
Retail baton passes from HD to LOW/TGT. After HD’s hold-guidance rally, attention shifts to Lowe’s/Target for read-throughs on DIY vs. pro spend and tariff pass-through.
Risk tone jittery into minutes. Tech led a pullback Tuesday; positioning lightens ahead of Fed minutes and Jackson Hole.
📊 Key Data Releases & Events (ET)
7:00 AM — MBA Mortgage Applications (weekly). Prior: +10.9% w/w (8/13). Why it matters: housing demand pulse → rates/affordability → AMEX:XHB and growth tone.
10:30 AM — EIA Weekly Petroleum Status. Prior crude change: +3.036M bbl. Why it matters: oil balance → gasoline/diesel → inflation & AMEX:XLE path.
1:00 PM — U.S. 20-Year Treasury Auction. Typical close: 1:00 ET; also 17-week bill today. Why it matters: term-premium & risk appetite; tails/stop-throughs can shake $TLT/$TNX.
2:00 PM — FOMC Minutes (July 29–30). Watch for: depth of cut debate, tariffs → inflation, labor cooling. Why it matters: reprices path-of-rates across curve and equities.
Earnings (before open): LOW, TGT, TJX, ADI (+ others). Why it matters: U.S. consumer & capex reads; category mix shifts. Lowe’s call 9:00 AM.
⚠️ Disclaimer: Educational/informational only — not financial advice.
📌 #trading #stockmarket #SPY #SPX #Fed #FOMCMinutes #JacksonHole #DXY #TLT #XLE #LOW #TGT #TJX #ADI
Weekly $SPY / $SPX Scenarios for August 18–22, 2025🔮 Weekly AMEX:SPY / SP:SPX Scenarios for August 18–22, 2025 🔮
🌍 Market-Moving News 🌍
🏔️ Jackson Hole (Thu–Sat): Chair Powell headlines the Kansas City Fed symposium—path-of-rates + growth vs. inflation = front-page risk for AMEX:SPY SP:SPX TVC:DXY $TLT.
📝 FOMC Minutes (Wed): Deeper read on July meeting dissents and tariff/inflation views—rate-cut odds in play.
🛒 Retail Heavyweights: Earnings updates from NYSE:WMT NYSE:HD NYSE:TGT NYSE:LOW NASDAQ:ROST = real-time consumer pulse for AMEX:XRT and broader risk tone.
🏠 Housing Check: Starts/Permits + Existing Home Sales frame construction demand and affordability; watch AMEX:XHB and long rates.
📊 Key Data Releases & Events (ET) 📊
📅 Tue, Aug 19
• Housing Starts & Building Permits (8:30 AM)
📅 Wed, Aug 20
• FOMC Minutes (July meeting) (2:00 PM)
📅 Thu, Aug 21
• Initial Jobless Claims (8:30 AM)
• Philly Fed Manufacturing Index (8:30 AM)
• S&P Global Flash PMIs (Mfg/Services) (9:45 AM)
• Existing Home Sales (Jul) (10:00 AM)
• Conference Board Leading Index (10:00 AM)
• Jackson Hole Symposium begins (all day; speeches through Sat)
📅 Fri, Aug 22
• No major U.S. releases (focus: Jackson Hole headlines + positioning)
⚠️ Disclaimer: Educational/informational only — not financial advice.
📌 #trading #stockmarket #economy #Fed #FOMC #JacksonHole #housing #PMI #retailsales #SPY #SPX #DXY #TLT #XHB #XRT
04/08/25 Weekly OutlookLast weeks high: $119,809.82
Last weeks low: $111,917.76
Midpoint: $115,863.79
First net outflow for BTC in seven weeks (-$643m) following the FOMC data release and also month end. Yet again no change by the FED but the chances of Septembers FOMC giving us a rate cut has drastically increased, currently at a 78.5% chance of a 25Bps cut.
Month end usually gives us a pullback/sell-off as larger institutions window dress which often includes de-risking somewhat. We saw this last Thursday combined with the weekends typical lower volume has resulted in quite a significant correction for BTC. Altcoins have down the same as many assets reject from HTF resistance areas, the correction has been on the cards and isn't too worrying on the face of it.
What I would say is August seasonality is generally not a bullish month and so expecting price to rebound and extend the rally would go against historical trends. I could see more of a ranging environment taking place for several weeks before any next leg up is possible.
This week I would like to see where altcoins find support and establish a trading range where some rotational setups tend to present themselves.

Gold Crashes $100 After Hitting Monthly High | What’s Next?In this video, I break down everything that moved the price of gold last week, from the early-week rally toward $3,430 to the sharp midweek drop toward $3,325. We go beyond the surface, diving into what caused the reversal, and how I'm approaching next week’s market using a simple ascending channel on the 4-hour chart.
With major events like the FOMC rate decision, U.S. GDP, PCE inflation, NFP and the August 1 tariff deadline all on the radar, this analysis will help you stay grounded and prepare for volatility.
👉 If you find this content valuable, don’t forget to Boost, Comment, and Subscribe for weekly market breakdowns.
Disclaimer:
Based on experience and what I see on the charts, this is my take. It’s not financial advice—always do your research and consult a licensed advisor before trading.
#goldanalysis, #goldforecast, #xauusd, #goldpriceprediction, #technicalanalysis, #fundamentalanalysis, #tradingstrategy, #forextrader, #priceaction, #fomc, #usgdp, #pceinflation, #goldtrading, #forexeducation, #dollarvsgold, #tariffnews, #chartanalysis, #forexmentorship, #rebuildingthetraderwithin

S&P 500 (ES1): Post FOMC, Buyers Pushing Back To The Highs!In this video, we will analyze the following FX market for July 31 - Aug 1st.
S&P 500 (ES1!)
In the Weekly Forecast for the S&P 500, we highlighted:
- price is bullish, and expected to go higher. It did move to ATH before pulling back.
- the sell side liquidity under the ascending lows would draw price.... which it did.
- the Area of Fair Value below the lows, with the Demand Zone as the potential level where a
a high probability long could setup.... which was spot on!
Did you benefit from the forecast? Let me hear from you if you did, in the comment section.
Enjoy!
May profits be upon you.
Leave any questions or comments in the comment section.
I appreciate any feedback from my viewers!
Like and/or subscribe if you want more accurate analysis.
Thank you so much!
Disclaimer:
I do not provide personal investment advice and I am not a qualified licensed investment advisor.
All information found here, including any ideas, opinions, views, predictions, forecasts, commentaries, suggestions, expressed or implied herein, are for informational, entertainment or educational purposes only and should not be construed as personal investment advice. While the information provided is believed to be accurate, it may include errors or inaccuracies.
I will not and cannot be held liable for any actions you take as a result of anything you read here.
Conduct your own due diligence, or consult a licensed financial advisor or broker before making any and all investment decisions. Any investments, trades, speculations, or decisions made on the basis of any information found on this channel, expressed or implied herein, are committed at your own risk, financial or otherwise.

USD Dollar Index (DXY): Pushing Higher As Forecast!Welcome back to the Weekly Forex Forecast for the week of July 30 - Aug1
In this video, we will analyze the following FX market:
USD Index
In my last USD video, the forecast was for higher prices. Check the related links below to see that video forecast. It played out exactly as analyzed. The +FVG was used to push for higher prices. The FOMC decision to keep the rate unchanged only pushed it further along.
Enjoy!
May profits be upon you.
Leave any questions or comments in the comment section.
I appreciate any feedback from my viewers!
Like and/or subscribe if you want more accurate analysis.
Thank you so much!
Disclaimer:
I do not provide personal investment advice and I am not a qualified licensed investment advisor.
All information found here, including any ideas, opinions, views, predictions, forecasts, commentaries, suggestions, expressed or implied herein, are for informational, entertainment or educational purposes only and should not be construed as personal investment advice. While the information provided is believed to be accurate, it may include errors or inaccuracies.
I will not and cannot be held liable for any actions you take as a result of anything you read here.
Conduct your own due diligence, or consult a licensed financial advisor or broker before making any and all investment decisions. Any investments, trades, speculations, or decisions made on the basis of any information found on this channel, expressed or implied herein, are committed at your own risk, financial or otherwise.

DXY Bulls Ready — Can Powell Spark the Rally?📊 DXY Pre-FOMC Outlook
In my previous analysis released on Monday, I expected the Dollar Index to fill the gap around the 98.60 zone and range below the key red line at 99.429.
Now, with less than 8 hours left until the highly anticipated FOMC rate decision, it’s time to take a closer look at tonight’s event and what it could mean for the markets.
From a purely technical perspective — setting the news aside — the Dollar Index looks ready to break through the crucial 100 level and kick off a strong bullish rally.
However, recent political pressure from Trump urging rate cuts, along with visible tension between him and Fed Chair Jerome Powell, has created uncertainty. If it weren’t for these conflicting signals, I would’ve confidently expected a clean breakout above 100.
As much as I enjoy trading news-driven events, I’ll likely stay out of the market tonight and observe from the sidelines. The setup is tempting, but the dual narratives make it risky.
That said — if you ask for my final take — I believe the stage is fully set for a bullish dollar and a corresponding drop in gold, EUR, GBP, and other major assets.
Let’s see how it plays out. 👀💥

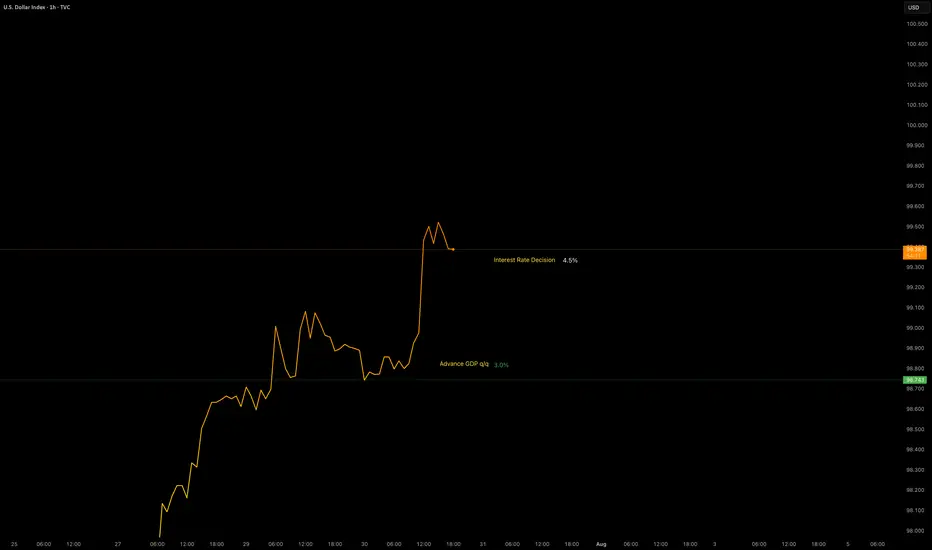
Data Release - Interest Rate DecisionJul 30 2025: Interest Rate Decision (4.5%)
Rates remain unchanged as expected.
OANDA:XAUUSD remains bearish with the help of GDP data.
TVC:DXY remains bullish with the help of GDP data. No major changes in either pairs.
Volatility is increased.
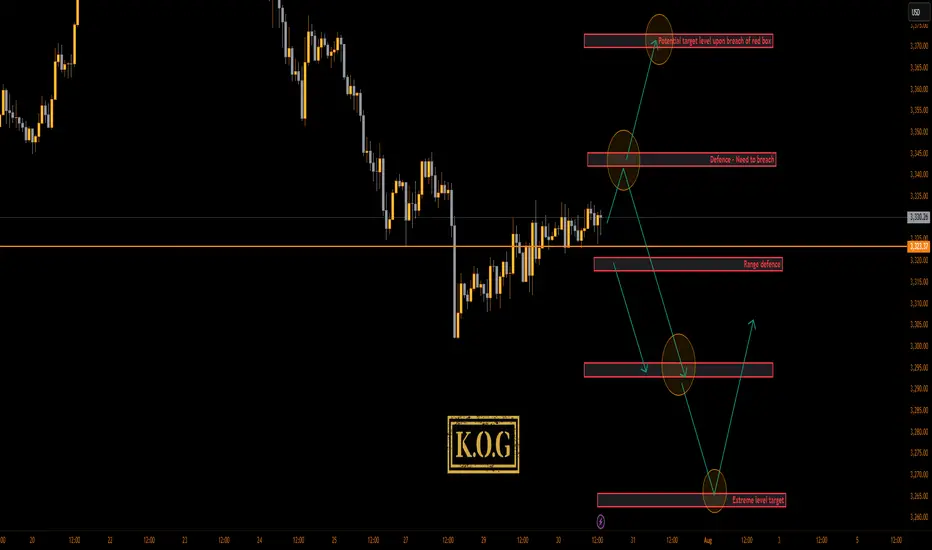
THE KOG REPORT - FOMCTHE KOG REPORT – FOMC
This is our view for FOMC, please do your own research and analysis to make an informed decision on the markets. It is not recommended you try to trade the event if you have less than 6 months trading experience and have a trusted risk strategy in place. The markets are extremely volatile, and these events can cause aggressive swings in price.
It’s been an aggressive month on the markets especially this week which has been testing for traders due to the extended movement on gold. We’ve managed to stay ahead of the game and although we missed the move downside, we’ve capture scalps up and down trading it on an intra-day basis rather than a swing.
Looking at the 4H chart, we can see we have support forming at the 3310 level which is the key level for this week and will need to be broken to go lower. If we can flip the 3334 resistance, price should attempt higher into the 3355-60 region which is where we may settle in preparation for NFP. on Friday This is the level that needs to be watched for the daily close, as a close above will confirm the structure and pattern test which can form a reversal if not breached.
Now, here is the flip! We’re still sitting below the daily red box but we know this break does give a retracement and with sentiment long, it may not be a complete retracement again. Here 3345-50 is the red box to watch and as above, if not breached, we may see a rejection here which will confirm no reversal for higher and, potentially a further decline into the 3270-5 regions for the end of the month and quarter.
Pivot – 3323-6
RED BOX TARGETS:
Break above 3335 for 3338, 3340, 3345, 3347 and 3357 in extension of the move
Break below 3320 for 3310, 3306, 3302, 3297 and 3393 in extension of the move
Please do support us by hitting the like button, leaving a comment, and giving us a follow. We’ve been doing this for a long time now providing traders with in-depth free analysis on Gold, so your likes and comments are very much appreciated.
As always, trade safe.
KOG
LONG ON NZD/USDNZD/USD is at a major demand level.
Dollar is bearish. Economic News this afternoon should assist and pushing this pair up.
Looking to catch 200 pips to the previous high.

BTC – Pre-FOMC consolidation, bullish momentum, key zones__________________________________________________________________________________
Technical Overview – Summary Points
__________________________________________________________________________________
Momentum : Primary uptrend confirmed on all swing timeframes (daily to 1H). Active consolidation below major resistance (119650–120247), no capitulation or massive selling signals at this stage.
Major Supports / Resistances :
Main Supports: 116950, then 114732. Structural invalidation if daily close below 114K or low <110K.
Key Resistances: 119650–120247 (recent block), then 123218. Clean breakout >125K targets next stat zone at 141K.
Volumes : Transactional flows remain healthy, no anomalies or distribution events; normal volumes with a few impulsive bursts. No panic or selling climax detected.
Multi-timeframe behavior : Uptrend alignment from 1D to 2H; short-term divergence (MTFTI “Down” on 30m/15m/5m) indicates only breath/consolidation pre-macro event (FOMC).
__________________________________________________________________________________
Strategic Summary
__________________________________________________________________________________
Global Bias : Medium/long-term bullish bias, confirmed, with no behavioral excess or visible structural weakness.
Opportunities : Pullbacks to major supports (116950–114732) offer strategic accumulation. Potential for adding exposure on clear breakout above 125K with volume confirmation.
Risk Areas : Post-FOMC flushes, anticipated high volatility until Thursday morning, $115–123K range still active. Tactical stop loss below 114.5K, structural recalibration <110K.
Macro Catalysts : FOMC tonight (20:00 Paris): status quo expected, but markets highly sensitive to Powell’s statement. Widened spreads, max volatility expected within the following 2 hours.
Action Plan : Favor patience on breakout, accumulate on retracement, keep stops disciplined. Avoid aggressive scalping until post-FOMC volatility peak fades.
__________________________________________________________________________________
Multi-Timeframe Analysis
__________________________________________________________________________________
1D (Daily): Uptrend confirmed up to dense resistance zone 119800–123200. Solid momentum, no excess on Risk On / Risk Off Indicator or volume. Key Supports: 116950, 114732.
12H/6H/4H: Structured consolidation below 120247–119650. No behavioral warnings; markets strong, healthy liquidity. Accumulation-distribution rhythm without extremes.
2H/1H: Sideways, no sell-off or euphoria; potential consolidation before breakout. Major supports unchanged.
30min/15min: Noticeable short-term divergence (“Down”). Micro bearish setup, possible loss of short-term momentum before FOMC.
Summary: Broadly bullish swing trend with consolidation below resistance, reinforcement possible on breakout; short term fragile until macro moves (Fed) are digested.
Patience is key ahead of FOMC: prioritize accumulation on major pullback, keep stops disciplined, and avoid intraday over-trading unless clear exhaustion signals emerge.
__________________________________________________________________________________
Risk On / Risk Off Indicator: Strong Buy from 1D to 1H, intact sector support, positive structural bias.
ISPD DIV: Neutral across all timeframes: no excess, no behavioral climax.
On-chain/macro: 97% of holders still in profit; market absorbed stress test ($9B sell-off); only moderate euphoria, consistent with late bull phase but not exhausted.
Swing validation if >125K.
Tactical stop <114.5K; full capitulation <110K.
__________________________________________________________________________________

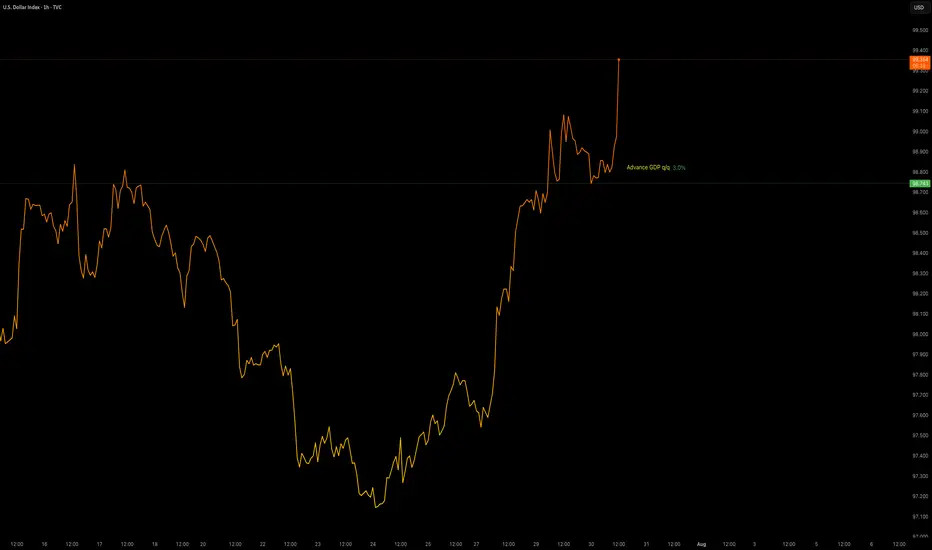
Data Release - Advance GDP q/q (3.0%)Jul 30 2025: ADVANCE GDP q/q (3.0%)
OANDA:XAUUSD sees some downside pressure with positive GDP data.
TVC:DXY gaining strength.
Volatility is increased. This data will be used with Interest Rate Decision later in the day to provide a XAUUSD insight.
Gold’s Biggest Day of 2025: Collapse or New High Incoming?🟡 Gold Pre-FOMC Update | Patience Paid Off
In my previous analysis released on Monday, we highlighted the significance of the 3310 key red level on gold. I mentioned that if we got a daily candle close below this zone, it could trigger further downside.
That scenario didn’t play out — price closed above 3310, and that’s exactly why we stayed out of any short positions. No guessing, no forcing. Just patience.
On the flip side, I also said we need a daily close above 3350 to even consider going long. And as you can see, for the past two days, price has been ranging tightly between 3310 and 3330 — with relatively low trading volume across the board.
After 9 years of optimizing this strategy, one core principle remains unchanged:
🛡️ Capital protection and maximum risk control always come first.
And I can confidently say — those filters are working beautifully. I hope you’re benefiting from this approach too.
Now technically speaking, everything is lining up for a bullish DXY and bearish gold —
But tonight’s FOMC meeting and Powell vs. Trump drama will be the final trigger.
Let’s watch closely. Smart trading is patient trading. 🧠⚖️
🔁 This analysis will be updated whenever necessary.
Disclaimer:This is not financial advice. Just my personal opinion.

DXY Rebound Pulls EURUSD Below 1.16Following the DXY’s significant rebound off a 17-year trendline, the EURUSD has broken below a trendline that connected all consecutive lows of 2025. This opens the door to further bearish risks, with key support levels now in sight.
If the pair closes cleanly below 1.15, 1.1440 and 1.1380, downside extensions could reach 1.12 and 1.11, respectively.
On the upside, a close back above the 2025 trendline and the 1.18 mark could reinstate bullish momentum, potentially lifting the pair toward the 2021 highs between 1.20 and 1.23.
Written by Razan Hilal, CMT
