Bearish continuation setup?GBP/USD is rising towards the resistance level which is a pullback resistance that aligns with the 61.8% Fibonacci retracement and could reverse from this level to our take profit.
Entry: 1.3332
Why we like it:
There is a pullback resistance that aligns with the 61.8% Fibonacci retracement.
Stop loss: 1.3372
Why we like it:
There is a pullback resistance that lines up with the 50% Fibonacci retracement.
Take profit: 1.3260
Why we like it:
There is a pullback support level.
Enjoying your Trad
Forexsetups
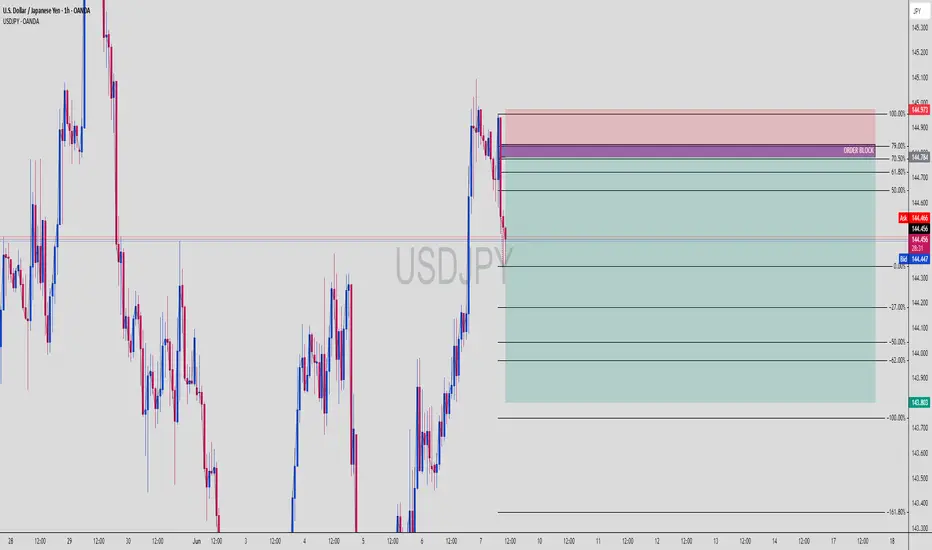
USDJPY Short Setup: OB Rejection + Fib Premium Sell-Off IncomingUSDJPY (1H Chart) | Institutional Short Setup with OB + Fib Confluence
The market is showing clear Smart Money Distribution behavior — with a rejection from a high-confluence zone combining Order Block, Premium Fib Levels, and bearish momentum shift.
🔍 Smart Money Setup Breakdown:
🔻 Bearish Order Block Zone (OB)
Price wicked into OB zone and got instantly rejected
OB located precisely at the 70.5% – 79% premium range
Mark of institutional sell-side interest
📐 Fibonacci Retracement + Premiu
Gold Tap into Order Block, Ready for the Drop?Here’s a surgical bearish setup on XAUUSD, right out of the smart money playbook. Gold has tapped into a premium order block inside the golden zone (between 61.8%–79%) and is showing signs of exhaustion. This could be the beginning of a major sell-off.
🔍 Technical Breakdown:
🔻 Bearish Channel:
Market respecting both internal and external structure — clear downward channel
🟣 Order Block Zone:
Price tapped into the OB nestled between 3,332 – 3,338
➕ Aligns with 70.5%–79% Fib retracement zone (pr
EUR/USD Loading for Takeoff? We got OB + Liquidity Combo.📊 EUR/USD 30-Min Smart Money Breakdown — May 15, 2025
Price is setting up for a high-RRR bullish reversal from a premium Smart Money zone — combining a textbook Order Block, Fibonacci golden zone, and uncollected Buy-Side Liquidity above.
Let’s zoom into this sniper play 🎯👇
🧠 1. The Setup
Recent bullish rally broke structure to the upside
Current retracement taps deep into:
✅ 50–61.8% Fibonacci zone
✅ A confirmed Bullish Order Block (OB)
Price currently pulling back for liquidity before a
Strong Buy on Gold Gold has respected the yellow trendline with multiple touches in the past and todays high impact news pushed gold sweep liquidity till the levels of 1995 which saw the rejection and FVG (Fair Value Gap) which was marked off along with bullish engulfing candlestick pattern formation as my three confirmations.
1.Trendline retest
2. FVG
3. Bullish engulfing
4. Liquidity to the upside
GLong
My current Plan for EUR/USD, GBP/CAD, EUR/HUFThis is my plan for the next few Quarters. My main focus is on the EUR/USD. If price is able to hit the 1.05 level, I will need to decide if I want to place a stop at 1.06 and ride price lower, or exit at 1.05 and move my focus over to the GBP/CAD and EUR/HUF. I might place a tighter stop and see if price is able to maintain the momentum lower on the EUR/USD. The GBP/CAD, I do want to get into a 50k position before price pushes lower. I think this pair is going to take a while to push lower
NZDUSD - DAILY CHARTIts looking bullish, waiting for the NZDUSD - DAILY CHART - to correct and then give us short opportunities.
Note: its my view only and its for educational purpose only. only who has got knowledge in this strategy will understand what to be done on this setup. based on my technical analysis only.
buy low and sell high concept. buy at cheaper price and sell at expensive price.
GBPUSD facing bullish pressure| 12th July 2021GBPUSD is facing bullish pressure as it broke out of the descending trendline resistance. Prices are might pullback and take support on horizontal pullback support in line with 38.2% Fibonacci retracement and 61.8% Fibonacci extension . Prices might push up towards horizontal swing high resistance in line with 50% Fibonacci extension and 127.2% Fibonacci retracement . If prices broke through horizontal pullback support, prices might take support on horizontal pullback support in line with 61.8%
NZDUSD facing bearish pressure|9th July 2021Prices are facing bearish pressure and is facing resistance from horizontal pullback resistance in line with 50% Fibonacci retracement and 78.6% Fibonacci extension . Prices might push down towards 161.8% Fibonacci extension Fibonacci confluence . If prices continue to push up, prices might face resistance from horizontal pullback resistance in line with 38.2% Fibonacci retracement and 78.6% Fibonacci extension . EMA is also above prices, showing a bearish pressure for prices.
Any opinions, new
GBPJPY > Nice Short OpportunityHi Friends,
In this analysis, I am sharing about GBPJPY.
Follow proper risk management and the minimum risk to reward ratio should be 3.
I am new to TradingView So, Do support me and share your views in the comment section.
**Trading is all about strategy. All I have done above is Technical Analysis
EURCAD potential for further upside! | 11th June 2021EURCAD is facing bullish pressure from ascending trendline support in line with 50% Fiboancci extension and 78.6% Fibonacci retracement . Prices might push up towards horizontal swing high resistance in line with 127.2% Fibonacci extension and 78.6% Fibonacci retracement . If prices push down further, prices might take support on horizontal swing low support in line with 50% Fibonacci extension and 61.8% Fibonacci retracement . MACD is also showing a bullish signal with the signal line below the
AUDCAD further drop incoming | 11th June 2021AUDCAD is currently hovering above 1st resistance in line with 61.8% Fibonacci retracement and 78.6% Fibonacci extension . If prices break through 1st resistance, a further drop is expected towards horizontal overlap support in lie with 50% Fibonacci retracement and 50% Fibonacci extension . If prices reverses from 1st resistance, prices might face resistance from 127.2% Fibonacci retracement and 78.6% Fibonacci extension . MACD is also showing a bearish crossover, showing a bearish pressure for
NZDCHF facing bearish pressure, potential for further downside!Prices are facing bearish pressure from horizontal pullback resistance in line with 100% Fibonacci extension and 50% Fibonacci retracement . Prices might push down towards horizontal swing low support in line with 50% Fibonacci extension . If prices continue to push up, prices might face resistance from horziontal swing high resistance in line with 127.2% Fibonacci extension and 61.8% Fibonacci retracement . Ichimoku cloud is also above prices, showing a bearish pressure for prices.
Any opinion