GBP/JPY Price Outlook – Trade Setup📊 Technical Structure
OANDA:GBPJPY GBP/JPY remains supported after rebounding strongly from the 205.19–205.65 support zone, with buyers defending this level and keeping the bullish structure intact. Price continues to trade above the short-term trendline, with momentum favouring further upside as long as the support area holds.
The chart shows a bullish continuation pattern:
Support zone: 205.19 – 205.65
Resistance zone / target area: 207.75 – 208.20
As long as the cross stays above 205.19, dips into support are likely to attract buyers, with upside potential extending toward the 207.75–208.20 resistance band. A decisive 4H close below 205.19 would invalidate the bullish structure and expose the 204.82 region.
🎯 Trade Setup
Idea: Buy dips into support, targeting a move toward the 208.00 resistance zone.
Entry: 205.65 – 205.20
Stop Loss: 204.82
Take Profit 1: 207.75
Take Profit 2: 208.20
Risk–Reward Ratio: ≈ 1 : 2.54
Bias remains constructively bullish while price holds above 205.19–205.65 on a closing basis.
A 4H close below 205.19 would signal weakening bullish momentum.
🌐 Macro Background
According to FXStreet, GBP/JPY is trading below the year-to-date peak as demand for the Japanese Yen picks up on renewed expectations of BoJ tightening and intervention risk. Japanese officials continue signalling readiness to counter excessive JPY weakness, adding some intraday pressure to the cross.
Japan / BoJ:
BoJ board member Noguchi reiterated that policy could tighten gradually if activity and prices develop as expected.
Japan’s Services Producer Price Index continues to signal that inflation is close to the 2% target, reinforcing expectations of a December rate hike.
Intervention speculation remains elevated as authorities monitor rapid JPY fluctuations.
United Kingdom / GBP:
The UK budget delivered a larger-than-expected fiscal buffer, supporting the British Pound.
However, rising bets for a Bank of England rate cut next month create a policy divergence with the BoJ’s hawkish stance, limiting aggressive upside potential.
Overall, the mix of BoJ tightening expectations and GBP fiscal support creates two-way volatility, but GBP/JPY remains biased higher while the support zone holds.
🔑 Key Technical Levels
Resistance zone: 207.75 – 208.20
Support zone: 205.19 – 205.65
📌 Trade Summary
GBP/JPY maintains a bullish continuation structure above the 205.19–205.65 support band. As long as this foundation remains intact, the setup favours buying dips with upside targets at 207.75–208.20, where previous supply may reappear. Traders should monitor BoJ commentary, intervention risk, and upcoming Tokyo CPI data, as these factors could increase volatility.
⚠️ Disclaimer
This analysis is for reference only and does not constitute trading advice. Trading involves significant risk, and proper risk management is essential.
Fundamental Analysis

7 votes for a rate cut on December 10?!As we approach the last monetary policy meeting of the year, scheduled for Wednesday, December 10, uncertainty remains high. The CME FedWatch tool now suggests a dominant probability of a 25-basis-point rate cut, but this probability can shift significantly from one day to the next depending on the lagging macro data that will be released before the Fed meeting on Wednesday, December 10.
The reason is simple: the decision no longer depends solely on macroeconomic data, but also — and above all — on the balance of power within the FOMC, the Federal Reserve’s deliberative body. For a rate cut to be approved, at least 7 votes out of the 12 voting members are required. Yet the Committee appears today deeply divided, both in its diagnosis and in its monetary policy preferences.
Economic data: a necessary but not sufficient factor
The upcoming PCE inflation figures, the Fed’s preferred inflation measure, will play a crucial role. If price dynamics remain under control, this would strengthen the argument for monetary easing. Moderate growth and signs of softening in the labor market also support such a move.
But despite these signals, the context remains ambiguous: several Committee members believe that disinflation is not yet firmly anchored, or that the risks of a rebound remain too high. Hence the lingering caution, even in the face of a market probability clearly leaning toward a cut.
A fragmented FOMC: the real source of suspense
It is truly the internal composition of the FOMC that makes the outcome of the meeting so uncertain. The Committee has rarely been so heterogeneous in its positions. The profiles fall into three groups:
1. The dovish camp, favoring swift easing.
Some members clearly support a cut, or even a larger adjustment. They believe inflation is slowing enough to reduce pressure on the economy.
2. The hawkish camp, opposed to an imminent cut.
For them, the Fed must remain vigilant, keep rates high, and avoid loosening policy too early at the risk of reigniting inflationary pressures.
3. The central camp, cautious, hesitant, and likely decisive.
These “neutral” or “slightly dovish” members will ultimately swing the vote.
Today, the distribution of opinions shows that only a few votes could tip the balance. Chair Jerome Powell, typically a consensus figure, has himself been notably cautious, which further complicates the reading of internal dynamics.
An open decision, despite market signals
In summary, even if the CME FedWatch assigns a majority probability to a rate cut on December 10, the political reality inside the FOMC calls for restraint. It is not just a matter of economic data but a delicate balance between divergent views within the institution.
For now, only one thing is certain: the slightest macroeconomic release and the slightest statement from a Fed member will immediately impact expectations. The final decision will be played out in the complex arena of the internal vote, where every voice will count.
DISCLAIMER:
This content is intended for individuals who are familiar with financial markets and instruments and is for information purposes only. The presented idea (including market commentary, market data and observations) is not a work product of any research department of Swissquote or its affiliates. This material is intended to highlight market action and does not constitute investment, legal or tax advice. If you are a retail investor or lack experience in trading complex financial products, it is advisable to seek professional advice from licensed advisor before making any financial decisions.
This content is not intended to manipulate the market or encourage any specific financial behavior.
Swissquote makes no representation or warranty as to the quality, completeness, accuracy, comprehensiveness or non-infringement of such content. The views expressed are those of the consultant and are provided for educational purposes only. Any information provided relating to a product or market should not be construed as recommending an investment strategy or transaction. Past performance is not a guarantee of future results.
Swissquote and its employees and representatives shall in no event be held liable for any damages or losses arising directly or indirectly from decisions made on the basis of this content.
The use of any third-party brands or trademarks is for information only and does not imply endorsement by Swissquote, or that the trademark owner has authorised Swissquote to promote its products or services.
Swissquote is the marketing brand for the activities of Swissquote Bank Ltd (Switzerland) regulated by FINMA, Swissquote Capital Markets Limited regulated by CySEC (Cyprus), Swissquote Bank Europe SA (Luxembourg) regulated by the CSSF, Swissquote Ltd (UK) regulated by the FCA, Swissquote Financial Services (Malta) Ltd regulated by the Malta Financial Services Authority, Swissquote MEA Ltd. (UAE) regulated by the Dubai Financial Services Authority, Swissquote Pte Ltd (Singapore) regulated by the Monetary Authority of Singapore, Swissquote Asia Limited (Hong Kong) licensed by the Hong Kong Securities and Futures Commission (SFC) and Swissquote South Africa (Pty) Ltd supervised by the FSCA.
Products and services of Swissquote are only intended for those permitted to receive them under local law.
All investments carry a degree of risk. The risk of loss in trading or holding financial instruments can be substantial. The value of financial instruments, including but not limited to stocks, bonds, cryptocurrencies, and other assets, can fluctuate both upwards and downwards. There is a significant risk of financial loss when buying, selling, holding, staking, or investing in these instruments. SQBE makes no recommendations regarding any specific investment, transaction, or the use of any particular investment strategy.
CFDs are complex instruments and come with a high risk of losing money rapidly due to leverage. The vast majority of retail client accounts suffer capital losses when trading in CFDs. You should consider whether you understand how CFDs work and whether you can afford to take the high risk of losing your money.
Digital Assets are unregulated in most countries and consumer protection rules may not apply. As highly volatile speculative investments, Digital Assets are not suitable for investors without a high-risk tolerance. Make sure you understand each Digital Asset before you trade.
Cryptocurrencies are not considered legal tender in some jurisdictions and are subject to regulatory uncertainties.
The use of Internet-based systems can involve high risks, including, but not limited to, fraud, cyber-attacks, network and communication failures, as well as identity theft and phishing attacks related to crypto-assets.

Fundamental Market Analysis for November 27, 2025 USDJPYThe yen firms on two overlapping forces: markets lean toward a gentler U.S. rate path next year, and Japan preserves the prospect of further normalization of monetary settings supported by wage agreements and stickier domestic prices. As U.S. Treasury yields edge lower, the relative appeal of dollar assets versus the yen decreases, pressuring the pair.
The risk of official comments from Japan’s financial authorities on the exchange rate also discourages aggressive dollar buying at elevated levels. The market remains sensitive to verbal signals and to willingness to prevent excessive volatility. Attention stays on Japanese government bond yields: a narrower U.S.–JGB yield premium reinforces downward pressure on USDJPY.
Holiday-thinned U.S. liquidity and month-end rebalancing can magnify reactions to news. In this setup, the pair retains scope for a corrective pullback if there are no fresh firm signals from the U.S. side and Japanese data remain neutral, with ongoing progress on inflation and wages supporting the yen over the medium term.
Trading recommendation: SELL 156.050, SL 156.350, TP 155.150

EURUSD above 1.1600Yesterday, EURUSD continued its strong performance and, after the expected pullback, managed to break above the 1,1600 level.
Today is Thanksgiving in the U.S., and the markets will be closed, which suggests lower volatility and limited price movement.
The main objective remains a break above the previous high to confirm the continuation of the uptrend.

EURUSD 2H – Breakout + Retest Continuation PlanFX:EURUSD
Price has broken structure to the upside and is now approaching a key reaction zone. A controlled pullback toward the 1.1550–1.1560 entry zone would confirm demand and provide a cleaner continuation setup toward higher liquidity.
As long as price remains above 1.1505, bullish structure remains valid.
Key Scenarios
✅ Bullish Case (Primary Bias)
Hold above 1.1550–1.1560
→ 🎯 Target 1: 1.1620
→ 🎯 Target 2: 1.1670–1.1680 major liquidity target
❌ Bearish Invalidation:
Break and close below 1.1505 stop loss zone flips structure bearish.
Current Levels to Watch
Support: 1.1550 / 1.1505
Resistance: 1.1620 / 1.1670–1.1680
⚠️ This analysis is for educational purposes only — not financial advice.

EURUSD 15m — Breakout + Retest Setup | Bullish ContinuationFX:EURUSD
Price has formed a clean V-shaped recovery and broke above the previous structure range, confirming a bullish continuation bias. Market is now approaching a minor supply zone, and a controlled pullback toward the entry zone at 1.15511–1.15800 would offer the best risk-to-reward setup.
If price holds above structure and retests cleanly, continuation toward the higher liquidity zone is expected.
Key Scenarios
✅ Bullish Case 🚀
Retest entry zone (1.15511–1.15800)
→ 🎯 Target: 1.16680–1.16850 (major liquidity sweep area)
📌 Best entry style: Retest confirmation / wick trap / bullish engulfing
❌ Invalidation / Stoploss:
Below 1.15050 — if broken, bullish structure is invalid.
Levels to Watch
Type Price
Target 🎯 1.16680–1.16850
Entry Zone 🟩 1.15511–1.15800
Stop Loss ❌ 1.15050
⚠️ This analysis is for educational purposes only — not financial advice.

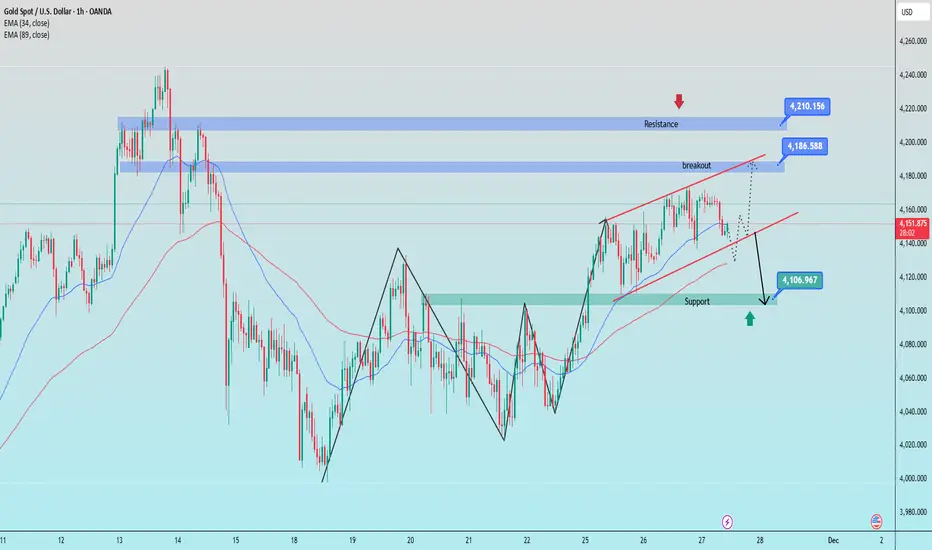
Gold is still moving sideways and waiting for a breakout1. Trendline Structure
Ascending Channel (red)
Upper trendline: price has been repeatedly rejected at the upper boundary → strong dynamic resistance.
Lower trendline: recently pierced slightly → indicates weakening buying pressure and increased correction risk.
2. Key Resistance
4,186 – 4,210: Strong supply zone + confluence with the upper trendline.
This is a zone that price will struggle to break without strong volume.
→ If price breaks above and successfully retests → the next target is the 4,210 area.
3. Key Support
4,105 – 4,110: Major support zone, confluence with EMA & the 0.5 Fibonacci level.
→ High probability that buyers will step in around this area.
4. Overview
Major Resistance: 4,186 – 4,210
Major Support: 4,105 – 4,110
Short-term Trend: weakening, leaning toward a corrective move.
Key Signal: a break below 4,140 → confirms a drop toward the support zone.
Bullish Scenario: only activated if the price reclaims 4,186.
BUY GOLD : 4107 - 4109
Stoploss : 4097
Take Profit : 100-300-500pips
SELL GOLD : 4209 - 4211
Stoploss : 4221
Take Profit : 100-300-500pips
TRADING PLAN XAUUSD 22/11/251. Main Market Context for Today
Jobless claims came in better than expected → USD strengthens, but gold did not drop — it continued to move sideways → the market is in accumulation and waiting for a breakout.
Today’s priority strategy is range trading:
Lower range: 4130–4135
Upper range: 4170–4175
Once price breaks clearly out of either range → switch to trend-following (pursuit) trading.
2. Range-Trading Plan (Primary Strategy for Today)
(A) Buy at the Lower Range – 413X Zone
Buy area: 4130–4135
SL: 100 pips
TP: 100 pips
Reason: This is the main demand zone and aligns with the ascending trendline shown on your chart.
➡️ Strategy:
Wait for price to “sweep” the lows → show confirmation → then take a quick BUY trade.
(B) Sell at the Upper Range – 417X Zone
Sell area: 4170–4175
Reason: Strong supply zone with repeated reactions.
➡️ Strategy:
Wait for a rejection candle (pin bar / bearish engulfing) → then SELL.
3. Current Reaction Zone – 414X
This is the zone price is currently testing.
Do not enter immediately; just observe:
If price bounces strongly from 414X → target is to retest 417X
If 414X breaks → price will likely retest 413X → better BUY entries there.
4. Deeper BUY Zones (If Price Breaks Downward)
Here are the levels you mentioned, organized clearly:
BUY Zone
4110–4108
4102–4100
4096–4094
→ These are deeper liquidity zones below the main range, activated only if gold breaks below 413X.
5. SELL Zones if Price Breaks Upward (Above 417X)
SELL Zone
4202–4200
4192-4195
4183–4180
→ These are upper supply retest zones, activated only after price breaks above 417X.
6. Main Scenarios for Today
Scenario 1 – Expected Sideway (Highest Probability)
Price moves within 413X – 417X, bouncing between the range limits.
→ Trade the range (scalp/intraday).
Scenario 2 – Break Below Range
If 4130 breaks → price will head to 4110 → 4100 → 4094
→ BUY at deeper zones.
Scenario 3 – Break Above Range
If 4175 breaks → price will aim for 4183 → 4194 → 4200–4202
→ SELL at higher zones.
✅ One-Line Trading Summary
Trade primarily within the 413X–417X range (buy low – sell high). If the range breaks, switch to trend-following using the deeper BUY zones or higher SELL zones provided above.

Bullish trendCAPITALCOM:GOLD is consolidating the 4160-4170 as a very strong resistance. If it crosses. The next stop is around 4200. If it bounces back we can see 4140 as a support.

Buy after a pullback. Target price: 4200.From the daily chart perspective, gold has now returned above the moving average band, indicating a recovery in short-term bullish sentiment. While the sustainability of the rally remains to be seen, technical patterns suggest that prices may further test the resistance level of 4170-4180. If this level is broken, the next key resistance level to watch is the upper edge of the range at 4200-4210.
It's worth noting that due to the Thanksgiving holiday in the latter half of this week, market activity has slowed, potentially increasing the risk of abnormal price fluctuations due to insufficient liquidity. Range-bound trading may be the most reasonable scenario at present.
From the 4-hour chart, gold is expected to maintain a high-level consolidation pattern in the short term. The key support level to watch is the 4130-4120 area, which is also where the 5-day and 10-day moving averages intersect and can serve as a short-term dividing line between bullish and bearish trends.
The first resistance level is at 4180-4190. Only after a successful breakout can the space to reach the 4200 level be opened, but this may require the support of positive fundamental factors.
In summary, given the special market environment during the holiday, the recommended strategy is to primarily buy on dips, but strict position control is necessary to mitigate the risk of sudden fluctuations. Key short-term resistance is expected in the 4180-4200 area, while key short-term support is around 4130. Overall, caution is advised, and investors should be wary of the risks associated with market manipulation in a low-liquidity environment.
Trading Strategy: Buy on dips to 4140-4150, with a stop-loss at 4130 and a target of 4200.
I will adjust the strategy flexibly based on market fluctuations and update the information in the channel.

US MARKETS CLOSED TODAY - THANKSGIVING🚨 US MARKETS CLOSED TODAY - THANKSGIVING 🦃
Current Price: $4,150 - $4,156 📊
Yesterday's Close: $4,130
Monthly Performance: +3.94% ✅
Yearly Performance: +57.69% 🔥
Status: 🟡 HOLIDAY - THIN TRADING
🎉 MAJOR BULLISH NEWS! DEUTSCHE BANK UPGRADES FORECAST! 📈
BREAKING: Deutsche Bank raised its 2026 gold price forecast to $4,450/oz from $4,000, citing stabilizing investor flows and persistent central bank demand. The bank now expects a $3,950-$4,950 range next year
This is HUGE news for gold bulls! Major institution showing strong confidence in gold's future!
📊 IMPORTANT: TODAY'S MARKET CONDITIONS
🦃 Thanksgiving Holiday Schedule:
Gold will NOT be traded on November 27, 2025 due to U.S. Thanksgiving holiday
What This Means:
❌ US markets CLOSED all day
⚠️ Very thin liquidity globally
⚠️ Wide spreads expected
⚠️ Price gaps possible
✅ Good time to review positions
Friday (Nov 28):
Markets open but shortened hours
Very low volume expected (Black Friday)
Many traders still on holiday
💎 DEUTSCHE BANK FORECAST DETAILS
The Upgrade:
Deutsche Bank's new average forecast for 2026 stands at $4,450/oz, up from previous $4,000/oz. Bank anticipates gold to trade within range of $3,950 to $4,950 per ounce in 2026, with possible high near $4,950/oz - approximately 14% above current December 2026 futures prices
Why They're Bullish:
Key drivers: resilient investor demand, strong central-bank buying, limited supply response. Third-quarter supply-demand data supports continued central bank bid, with inelastic demand from central banks and ETF investment diverting supply from jewelry market. Overall growth in demand outpaces supply
Gold's unusually wide trading range in 2025—the largest since 1980—underpins constructive outlook for 2026
📈 CURRENT TECHNICAL ANALYSIS
Market Structure: BULLISH CONSOLIDATION 🟢
Gold trading near two-week highs above $4,170 after recent rally. Consolidating gains before next move.
Key Development:
Gold shrugging off Tuesday's small dip and pushing to multi-day highs above $4,170 per troy ounce. Move higher comes as US Dollar loses steam, even though US Treasury yields trying to rebound
Support Levels 🔵
Support 1: $4,130 - $4,140 (Yesterday's close - Immediate)
Support 2: $4,059 - $4,100 (Strong zone)
Support 3: $3,977 (55-day SMA)
Support 4: $3,886 (October 28 low)
Support 5: $3,750 (50% Fib retracement)
Resistance Levels 🔴
Resistance 1: $4,170 - $4,173 (Current highs)
Resistance 2: $4,245 (November 13 peak)
Resistance 3: $4,254 - $4,280 (Major barrier)
Resistance 4: $4,380 - $4,381 (All-time high - October 17)
📊 TECHNICAL INDICATORS
RSI: Heading toward 60 (Bullish momentum building) 🟢
ADX: Holding above 19 (Trend slowly gaining strength) ✅
Moving Averages: All pointing UP - Bullish alignment ✅
For now, momentum still leans bullish: Relative Strength Index heading toward 60, and with Average Directional Index holding above 19, underlying trend looks like it's slowly gaining strength
🎯 TRADING STRATEGY FOR THANKSGIVING WEEK
TODAY (Wednesday - Thanksgiving):
⚠️ DO NOT TRADE!
Reasons:
Markets closed
Zero liquidity
No meaningful price discovery
High risk of gaps
Best Action:
Review your positions
Plan for Friday/next week
Take the day off!
FRIDAY (Black Friday - Nov 28):
Trade with EXTREME Caution!
On November 28, XAUUSD may continue to rise, but price reversal still possible. Key support and resistance levels expected at $4,059.90 and $4,254.97
Strategy:
Wait for normal hours to resume
Use smaller position sizes
Expect wider spreads
Watch for gaps from Thursday close
NEXT WEEK (December Trading):
Back to Normal - Key Levels:
BULLISH Scenario (65%):
IF holds above $4,130-$4,140
Target: $4,245 → $4,280 → $4,380
Entry: Pullback to $4,140-$4,150
BEARISH Scenario (35%):
IF breaks below $4,100
Target: $4,060 → $3,977
Entry: Break and retest of $4,100
🌍 FUNDAMENTAL OUTLOOK
BULLISH FACTORS ⬆️⬆️⬆️
✅ Deutsche Bank Upgrade - Major vote of confidence!
✅ Analysts predict gold may reach $4,456-$4,509 by end of November
✅ Central banks purchased 634 tonnes YTD, WGC expects 750-900 tonnes for 2025
✅ Fed Rate Cut Expected - December odds rising
✅ Dollar Weakness - DXY losing momentum
✅ Demand > Supply - Structural bull market
✅ ETF Inflows - First net buying in 4 years
✅ Geopolitical Tensions - Safe-haven support
Key Quote:
Central banks planning record high gold allocations. Gold positioned as "ultimate protection against black swan tail risk events." ETFs returned to net accumulation in 2025 after four years of outflows
Risk Factors ⬇️
⚠️ Profit Taking - After 57% yearly gain
⚠️ Technical Overbought - Short-term
⚠️ Holiday Volatility - Thin markets
⚠️ Strong US Data - Could delay Fed cuts
💡 WEEK RECAP & OUTLOOK
This Week's Performance:
Current XAU/USD exchange rate: $4,155.98. Over past year, XAU/USD changed by 57.69%, trading within 52-week range of $2,583.49 to $4,381.60
Gold rose to $4,138.45 on November 25, up 0.07% from previous day. Over past month, gold's price risen 3.94%, up 57.22% compared to same time last year
November Performance:
✅ Recovered from $3,886 low
✅ Now at $4,150+ (Multi-week highs)
✅ +3.94% for the month
✅ On track for analysts' $4,456-$4,509 target
🔮 FORECAST & TARGETS
End of November (3 Days):
Expected: $4,200-$4,300 range
Target hit probability: 70%
December 2025:
Range: $4,150-$4,400
Target: Retest all-time high $4,381
2026 Targets (Deutsche Bank):
Average: $4,450/oz
Range: $3,950-$4,950
Potential High: $4,950 (+19% from current)
Long-term (Other Analysts):
Some forecasts: $5,000+ by late 2026
Ultra-bullish: $6,000+ by 2027-2028
🏆 PROFESSIONAL ANALYSIS SUMMARY
Gold is in a STRONG POSITION entering the holiday period. The Deutsche Bank upgrade is a major institutional endorsement of the bull market.
The Big Picture:
Technical: Bullish trend intact, consolidating at highs
Fundamental: Demand > Supply, Central bank buying strong
Sentiment: Major banks turning more bullish
Positioning: Healthy after recent consolidation
Key Insight:
Gold's upward trajectory is structurally supported rather than merely cyclical
This means the rally has LEGS - it's not just speculation, it's backed by real supply/demand fundamentals!
💪 TRADING PSYCHOLOGY - HOLIDAY EDITION
Take a Break!
Markets are closed, you should be too! Use today to:
Spend time with family 🦃
Review your trading journal
Plan for December
Recharge your mental energy
Remember: The best trade is sometimes NO trade!
🎯 POST-HOLIDAY TRADING PLAN
Friday (Nov 28):
⚠️ Avoid trading (thin liquidity)
Watch for any gaps
Let market settle
Monday (Dec 2):
Resume normal trading
Watch $4,140 support
Target $4,245 if bullish
Key Levels to Watch:
Above $4,170: Bullish → Target $4,245+
Below $4,130: Caution → Support at $4,100
📊 SUPPORT/RESISTANCE SUMMARY
Critical Support: $4,130-$4,140
Strong Support: $4,100, $3,977
Weak Resistance: $4,170, $4,200
Strong Resistance: $4,245, $4,280, $4,380
Breakout Level: $4,245 (Opens $4,380 retest)
Breakdown Level: $4,100 (Triggers correction)
🔔 THANKSGIVING MESSAGE
Happy Thanksgiving! 🦃
Whether you're trading gold or not, take time today to be grateful. The markets will be here tomorrow, next week, and next year. But today is for family, friends, and reflection.
Three Things to Be Grateful For in Trading:
Opportunity - Markets give us chances every day
Learning - Every trade teaches us something
Community - We're all in this together!
Enjoy your day! 🙏
⚠️ FINAL REMINDERS
For Today:
Markets CLOSED ❌
No trading possible
Relax and recharge 🦃
For Friday:
Shortened hours
Very low volume
Trade with extreme caution
Smaller positions
For Next Week:
U.S. third-quarter GDP data may influence gold prices
Back to normal volume
December rate decision approaching
Year-end positioning begins
📈 YEAR-END OUTLOOK
December Catalysts:
Fed rate decision (Dec 17-18)
Year-end positioning
Q4 GDP data
Holiday season (thin trading Dec 24-Jan 1)
2026 Setup:
With Deutsche Bank's $4,450 target and bullish structure, gold entering 2026 with strong momentum!
🦃 Happy Thanksgiving from the Trading Desk!
📱 Enjoy the holiday - markets resume Friday
💎 Stay blessed and grateful
🙏 See you next week for December trading!
#Gold #XAUUSD #Thanksgiving #DeutscheBank #BullMarket #GoldForecast #HappyThanksgiving #MarketHoliday #2026Outlook #TradingBreak

NZD: Don't trust the flightless bird rallyHello traders
I have seen this Thanksgiving week movie many times. Low volumes/illiquidity meets future positioning.
The USD December rate cut has been priced in for a few days now.
The RBNZ indicated that it MAY be the end of the easing cycle.
Australian CPI remains elevated which eliminates any short term rate cuts.
We are at the beginning of a normalization of Central Bank tightening/cuts which in my opinion is still due to the COVID-19 pandemic/elevated inflation/USA trade policy hangover.
The technical picture is clear.
NZD has been WAY below the 200/100 day MA death cross for some time now. The pair has just bumped up against the 50 day MA. The pair has also been oversold.
AUD is exactly the opposite
NZD 10Y yield is at 4.37
AUD 10Y yield is at 4.49
USD yield is hovering around 4.00
Gold was rejected at the 4171 level.
Investors are constantly chasing ROI and although the USD yield is below the Antipodeans' yield, it may change in a heartbeat if the December FOMC rate cut is "hawkish" since the US Supreme Court decision on the tariffs is still pending. Yes, I have said it a million times.
To drive the point home, take a look at a BRICS country, South Africa. beautiful country with so much potential.
ZA 10Y is 8.58. However the country is still plagued by high unemployment, struggling with generating electricity, not a highly trusted vehicle for international investment but one can certainly consider investing a fraction of available capital in the high earning bonds.
Long story short, I have entered into a long AUD/NZD position.
Please do your own research and best of luck.
Happy Thanksgiving.

XAU/USD Price Outlook – Trade Setup📊 Technical Structure
OANDA:XAUUSD Gold (XAU/USD) eases lower after failing to break above the 4,168–4,175 resistance zone, with sellers defending this area and keeping price capped. The market structure has shifted into a short-term bearish setup, with waning bullish momentum and repeated rejection at resistance.
The chart presents a bearish continuation pattern:
Resistance zone: 4,168 – 4,175
Support zone / target area: 4,104 – 4,110
As long as price remains below 4,168, rallies toward the resistance zone are likely to attract sellers, with downside potential toward the 4,110–4,104 support band. A decisive 4H close above 4,175 would invalidate the bearish structure and open the way toward 4,183.
🎯 Trade Setup
Idea: Sell into resistance, targeting a move toward the 4,110 support zone.
Entry: 4,168 – 4,175
Stop Loss: 4,183
Take Profit 1: 4,110
Take Profit 2: 4,104
Risk–Reward Ratio: ≈ 1 : 4.49
Bias stays bearish while price holds below 4,168–4,175 on a closing basis.
A 4H close above 4,175 would signal buyers regaining control.
🌐 Macro Background
According to FXStreet, gold eased from a two-week high as improved global risk appetite and hopes for a Russia–Ukraine peace framework prompted some profit-taking in safe-haven assets. Thin Thanksgiving liquidity also encouraged short-term selling flows.
Despite this pullback, dovish Fed expectations continue to weigh on the USD:
-Durable Goods Orders rose only 0.5%, slowing from the prior month.
-Initial jobless claims fell to 216K, a seven-month low.
-Chicago PMI dropped sharply to 36.3, showing deeper contraction.
Fed officials reinforced expectations of a December rate cut:
-John Williams said rates could fall without hurting inflation goals.
-Christopher Waller noted the labour market is weak enough to justify easing.
-Stephen Miran stated that the economy requires large rate cuts to reach neutral policy.
This dragged the USD Index to a one-week low, providing underlying support to gold.
However, rising optimism regarding Russia–Ukraine negotiations boosted risk sentiment and limited safe-haven demand, aligning with the bearish technical rejection at resistance.
🔑 Key Technical Levels
Resistance zone: 4,168 – 4,175
Support zone: 4,104 – 4,110
📌 Trade Summary
Gold turned lower after repeated rejection at the 4,168–4,175 resistance zone, signalling a short-term bearish continuation pattern. As long as this zone caps the upside, the setup favours selling rallies into resistance with downside targets at 4,110–4,104.
Dovish Fed expectations keep gold supported on deeper dips, but improved risk sentiment and peace-talk optimism align with short-term selling pressure.
⚠️ Disclaimer
This analysis is for reference only and does not constitute trading advice. Trading involves significant risk, and proper risk management is essential.

BTCUSD — Bullish Above 82,725 With Long-Term Target at 141,300BTC remains bullish as long as price holds above the key support at 82,725. This zone is the base of the current structure, and maintaining it keeps the long-term target at 141,300 in play. In a bearish scenario, price cannot break above the key support zone; any move toward it while trading below is only a corrective bounce. Holding above 82,725 supports continuation toward 93,723, 103,830, and ultimately 141,300,

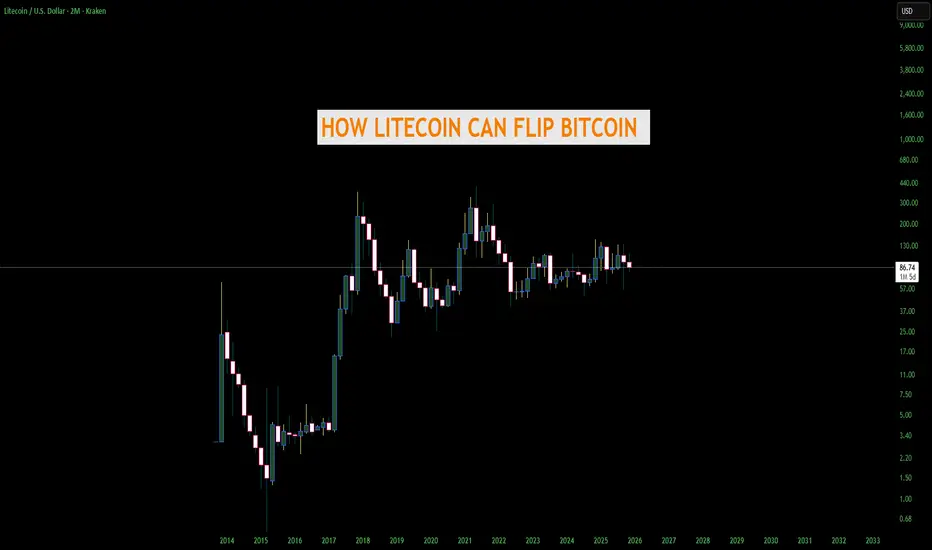
THE DAY LITECOIN FLIPS BITCOIN AND BECOMES #1 - AND HOWGrok helped me with this but regardless this is a great read. Not financial advice
1. Bitcoin fees explode again (> $50–$200 per transaction)
LTC stays under 5¢ and 4× faster → merchants & users flee to “digital silver” for actual payments
-Historical precedent: May 2017 & Dec 2017 fee madness → LTC pumped from $4 → $375 in weeks; repeated in May 2021 → $410 ATH
2. Bitcoin blocks stay full for months (Ordinals / Runes / BRC-20/ and now unlimited SPAM clog the chain again)
People rediscover Litecoin as the cheap, fast, on-chain alternative that actually works for daily spending
-Historical precedent: 2023–2024 Ordinals era → LTC quietly 3×–4× while BTC was practically unusable for small amounts
3. Major nation/state bans or heavily restricts Bitcoin mining or self-custody
LTC is smaller, less of a political target → miners add Scrypt rigs, capital rotates
-Historical precedent: China 2021 mining ban → Litecoin hashrate and price both spiked hard in the following months
4. A confirmed 51% attack or large double-spend actually happens on Bitcoin
Trust in BTC’s immutability shatters overnight → Litecoin (merged-mined with Dogecoin) suddenly has higher combined attack cost and looks safer
-Historical near-miss: 2018–2019 51% attack fears on smaller chains sent LTC up +150% in pure rotation plays
5. Credible quantum-break announcement or real progress scare (2026–2030 timeline moves up)
Litecoin’s MWEB addresses are already quantum-resistant + dev team can soft-fork faster than Bitcoin’s politics allow
-Historical precedent: 2023–2024 quantum FUD alone gave privacy coins and quantum-ready projects 3–10× pumps
6. Litecoin ETF (e.g., Canary Capital's) faces post-launch outflows or SEC-mandated tweaks due to BTC ETF dominance, while Bitcoin ETFs pull in record inflows
BTC ETFs become the unchallenged "institutional safe bet," capping BTC's retail upside → sidelined investors, retail traders, and altcoin funds rotate into the now-proven LTC ETF as the "next logical step" for legacy alts (with Canary/Grayscale already live and showing strong early volume)
-Historical precedent: ETH ETFs in 2024 saw initial outflows vs. BTC's inflows → ETH still 2–3×'ed on rotation; SOL's 2025 ETF launch pumped despite similar early teething issues
7. Lightning Network suffers major centralization scandals, hub failures, or routing collapses
People remember Charlie Lee’s original pitch: simple, fast, cheap, on-chain money with no layer-2 headaches
-Historical precedent: 2023–2025 Lightning UX complaints repeatedly drove spikes in LTC daily transaction volume and price
8. Bitcoin loses the “first-mover narrative” to a new nation-state adoption
Example: a major country (Brazil, Argentina, Indonesia, etc.) announces it will use Litecoin instead of Bitcoin for remittances or reserves because LTC is 4× faster and 100× cheaper.
-Precedent: El Salvador 2021 BTC adoption pumped Bitcoin; a “Litecoin country” would do the same or more for LTC.
9. PayPal, Venmo, Cash App, or Stripe re-activates Litecoin for instant zero-fee withdrawals/deposits
They all supported LTC years ago and dropped it only because of 2018 bear market. One click to flip it back on → instant 50–100 million new users.
-Precedent: PayPal adding BTC in 2020 → +300 % pump in weeks; LTC would explode harder because it’s actually usable on their rails.
10. Dogecoin merges fully with Litecoin (merged-mining → full auxiliary chain)
-Precedent: DOGE pumps in 2021 dragged LTC up 4–6× every single time. A real technical merger would be 10× stronger.
11. Major exchange or custodian loses billions in Bitcoin (think FTX 2.0 but only BTC exposed)
Users rush to self-custody the one big coin that still has sub-$0.01 fees and 2.5-minute confirmations → Litecoin.
-Precedent: FTX collapse 2022 → LTC was one of the only coins people could actually withdraw fast and cheap.
12. SEC or European regulator classifies Bitcoin as a “security” or “commodity with special rules” but explicitly says Litecoin is a commodity/currency
Institutions that were forced to sell BTC rotate the exact same thesis into LTC overnight.
-Precedent: XRP SEC case resolution in 2023 caused instant 3× pump; same mechanics.
13. Bitcoin Core development stalls or splits again (Blocksize Wars 2.0)
Big-blockers and users frustrated with ossification move money and hashrate to the chain that kept Charlie Lee’s original “faster, lighter” vision alive.
-Precedent: 2017 Bitcoin Cash hard fork → LTC price went parabolic as the “peaceful middle ground.”
14. Global remittance giants (Western Union, MoneyGram, Wise) quietly switch backend rails to Litecoin
They already tested LTC in 2017–2019. A single press release announcing “instant global transfers for pennies” using Litecoin would add billions in real volume.
-Precedent: Ripple/XRP partnerships in 2018 caused 10× pumps even when adoption was tiny. Real adoption would be insane for LTC.
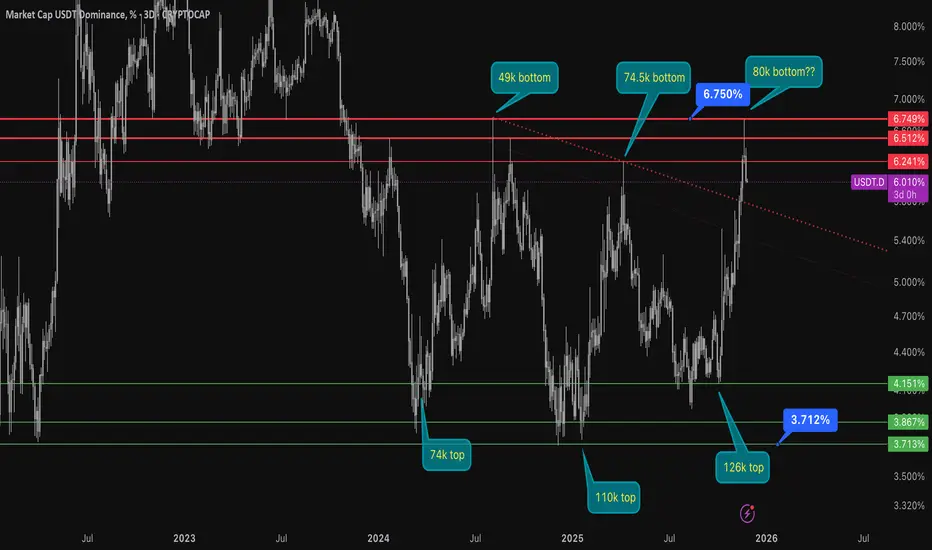
usdt.d rejecting: playing the range or breakoutusdt.d rejected the critical 6.75% area and therefore is still in that range its been for two years now. Im looking at a potential breakout to the upside for a bearish confirmation, or a revisit to the 5% areas. I would like it to continue playing the range and test the green low 4% area / high 3% area.
p2 to previous ideaas the top (likely) was october 6th, by that theory that would mean a bottom on the week of october 6th 2026. would roughly align with the days before the next halving as a bottom target, which isnt precise yet to use this theory. as we rejected the trendline, from 2017 top connected with the first ath of 2021, three times now it looks like that was the ath for btc. I was off by a few days tho with the october 6th top as my range began on october 20th and ends in november. for a potential bottom area I would target 20k to 35k (+ or - a few thousand).

Momentum to the upside continuesMomentum to the upside continues in the S&P 500. The next objective to the upside is 6870.

WARNING! 22 States Already In Recession.What the map is actually saying
This map claims that as of October 2025, 22 states are either:
Already in recession (red)
At high risk of recession (also red)
“Treading water” (yellow — basically flat growth)
Only the green states are shown as still expanding.
What this really means
This is a state-level business cycle indicator. States can slip into recession long before the national data officially confirms a U.S. recession.
Why? Because:
State economies depend heavily on specific industries (energy, tech, manufacturing, tourism).
Those sectors can crash regionally without the whole country being in recession—yet.
So a cluster of red states = early warning signal.
The big takeaway
When half or more of the states show contraction, historically, the national recession follows within months.
It means:
Job growth is stalling.
Local tax revenues are falling.
Credit conditions are tightening.
Businesses are cutting spending.
Consumers are slowing down.
In simple terms:
When enough states catch pneumonia, the U.S. national economy gets sick. You have been WARNED!
GTFO and STFO!
THANK YOU for getting me to 5,000 followers! 🙏🔥
Let’s keep climbing.
If you enjoy the work:
👉 Boost
👉 Follow
👉 Drop a solid comment
Let’s push it to 6,000 and keep building a community grounded in truth, not hype.

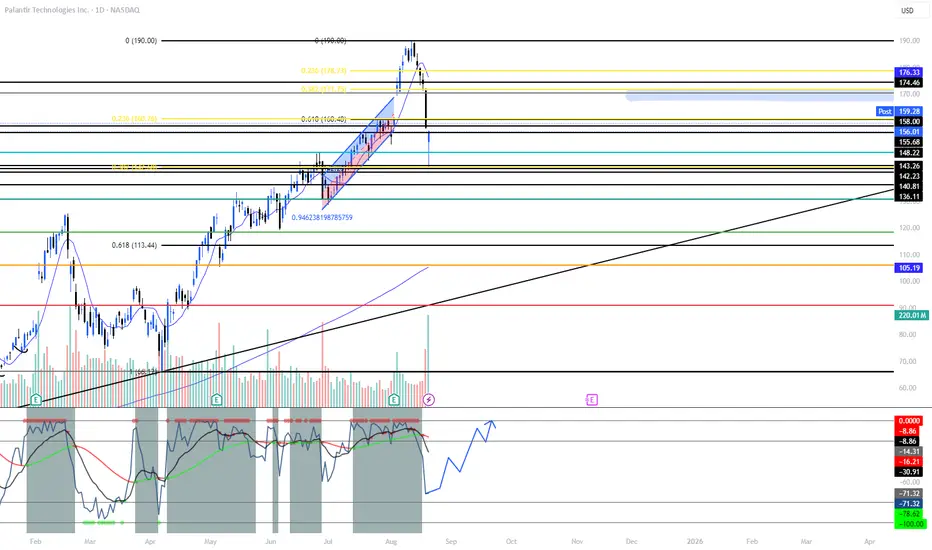
PLTR: This Drop ≠ February — Setup for 200+PLTR’s August dip looks nothing like February’s correction. In Feb, price unwound ~30% after insider-sale headlines + gov-spend fears and flushed to the 0.618 retrace, breaking key MAs. This time, the selloff paused at shallow fibs (0.236–0.382), held stacked support ($156 → $148 zone), and buyers stepped in before any trendline/50-DMA break. The catalyst is mostly valuation chatter, not fundamentals. With structure intact, a quick V-shape reclaim is on the table if we clear resistance levels in sequence.
What I’m watching
- Hold above $156 and build higher lows over $158 → momentum base.
- Trigger: reclaim $171.75 (0.382), then $178.7 (0.236) to re-ignite trend.
- Acceptance back over $186–$190 (prior ATH area) opens the 200s.
Why this isn’t Feb
- Depth: Feb = deep 0.618 wash; Aug = shallow 0.236/0.382 tag.
- Structure: Feb broke MAs/trend; Aug holds channel + MAs.
- Narrative: Feb = fundamental risk headlines; Aug = valuation noise while demand pipeline stays active.
Price Targets
- 171.50
- 178.70
- 186 - 190
- 205
- 217 - 235
Not financial advice.
Micron just keeps moving - long at 235.48MU is a stock I forget about easily and am always mad when I rediscover it and wish I had been trading it. Memory prices are up 160% in the last MONTH and in a market gasping for good earnings, it's a safe bet they will deliver in the near term, at least.
It caught my eye because it is one of only a handful of mega cap stocks that is trading above its 20, 50 and 200d MAs. I think that despite its "overvaluation", mega cap is mega for a reason. They have the earnings to justify their mega status.
MU is in a really strong uptrend right now that began in early September, but is short term under a lot of pressure over the last couple of days. This has created a situation that has produced a winning trade in 2 days or less 13 of the last 15 times it has occurred, and the 2 times it didn't produced wins of 2.1% and 2.5% that just took longer (17 and 5 trading days, respectively) but on a per day held basis, even those handily beat the market.
I am looking for a quick rebound trade here, hopefully one of the one or two day variety. If longer, I will add if necessary and sell tactically until the original lot is sold profitably.
As always - this is intended as "edutainment" and my perspective on what I am or would be doing, not a recommendation for you to buy or sell. Act accordingly and invest at your own risk. DYOR and only make investments that make good financial sense for you in your current situation.

MERL Correction LoadingWhat Goes Up Must Come Down. Waiting for one of the major resistances to hit and then short the correction towards VAH.

NetApp (NASDAQ: $NTAP) Stock: Q3 Beat, Shares SlideNetApp Inc. (NASDAQ: NASDAQ:NTAP ) fell over 4% in early trading despite posting Q3 CY2025 results that exceeded expectations. Shares opened at $108.92 as investors focused on softer forward revenue guidance rather than the quarter’s operational strength. While the company delivered solid margin performance and raised full-year EPS guidance, growth signals remain modest, creating a mixed reaction.
Q3 revenue grew 2.8% year over year to $1.71 billion, beating estimates by 1.1%. Adjusted EPS reached $2.05, up from $1.87 last year and an 8.8% beat against consensus. Management reaffirmed full-year revenue expectations of $6.75 billion and lifted full-year EPS guidance to $7.90 at the midpoint. Operating margin expanded to 23.4%, improving 2.6 percentage points and reflecting tight cost controls. Free cash flow margin held steady at 4.6%, reinforcing stability.
NetApp’s previous Q2 GAAP results also showed progress. GAAP EPS rose to $1.51 from $1.42, while revenue climbed 2.8% to $1.705 billion. For the upcoming quarter, the company guided revenue to $1.615–$1.765 billion and EPS to $2.01–$2.11, slightly below market expectations. Full-year projections call for revenue between $6.625 and $6.875 billion and EPS between $7.75 and $8.05.
Long-term trends highlight consistency rather than acceleration. NetApp delivered a 3.7% revenue CAGR over five years and 4.3% over the past two years. Analysts expect 4.4% growth next year, signaling stability but limited upside. However, profitability remains a clear strength. The company averaged 19.3% operating margin over five years and continues to improve efficiency.
EPS growth remains robust, with a five-year CAGR of 12.5% and two-year growth of 14.9%. NetApp’s disciplined execution supports strong earnings even as revenue growth stays modest.
Technical Outlook:
NTAP is testing key support at $108. A breakdown and close below this zone could open room toward the $84 ascending trendline. Resistance sits at $135, where bullish momentum must reclaim control.
