$BYND - The Next GMELet's look at the thesis behind this idea :-
1) Massive Short interest.
2) Falling Wedge Pattern.
3) Diamond Hands are back again and This time they are supporting BYND.
4) Untapped Liquidity Resting above and possibility of liquidating Shorts would also be appealing to Market makers to supply Liquidity to HIGHER Bidders for building new Short positions.
From my speculation, this is highly risky play. But how to play it?
No need to go full APE.
Risk Assessment can be used. Assess your risk. Use a Stop loss. Accept your Risk. Always use a Stop loss with risk in mind of what you can afford to lose.
This is not a Financial Advice. Your gains and losses are your responsibility. I wish you good luck.
This idea is for educational purposes only. DYOR.
If you like this idea then Follow me please.
Fundamental Analysis

NTSK Netskope: the rocket is on the padNetskope’s shares (ticker NTSK) are trading after a successful IPO, but the chart suggests we’re still in early accumulation phase. The price is hovering in the ~$21-24 zone, and a breakout above near resistance is needed to confirm strength. The first target is $28, with potential extension toward $35–40 if the structure holds. Given IPO volatility, entry requires careful stop-management and confirmation of trend support.
Netskope operates in the rapidly expanding cloud security market (SASE/Zero Trust). With revenue growth exceeding 30% and narrowing losses, the company is well-positioned in the AI-security wave. While the TAM (total addressable market) is large and growth prospects strong, the business still faces profitability and competitive risks.
The rocket may not yet be launched, but the launchpad is set. Stay patient, wait for the “ignition” signal, and let the engine build thrust before liftoff.

10/28/25 - $sqns - Meh, cheap BTC trade10/28/25 :: VROCKSTAR :: SQNS
Meh, cheap BTC trade
- i'd link you to their website, but tradingview would flag me for shilling ironically. so here's to DYOR, i guess with a quick google search for their bitcoin treasury dashboard
- thing trades at 0.73x mnav
- it has a legacy biz associated w it, so defn deserves some discount
- but i like this bottoming pattern
- btc is moving, idk if holds
- but we've seen stuff like NASDAQ:SMLR (flagged this before) go nuts the other day (no longer own it), NASDAQ:NAKA (still have some) and others
- preferred way to own my size remains OTC:OBTC at 8% discount. i'm convinced it will convert, and honestly i'm not trading BTC around, anyway.
- but for s/t like sequans... it's a trade, only. i like spot here b/c the chain is so lumpy. might sell C's if this thing leaps. otherwise i'm in for a 5-15% move, let's see.
V

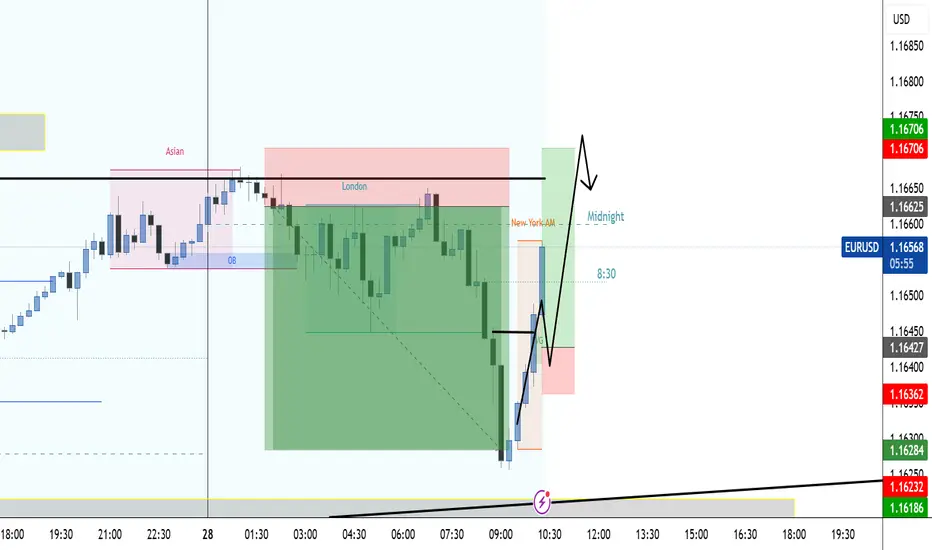
EURUSD BUYWe expect price will pullback to FVG which has bullish order Block and buy from there. This extension made from price correction from Demand zone below after our successful EURUSD SELL.
USDJPY - Short (Gap fill + FOMC)If we have a look at the DXY to add confluence to the trade, it is is currently in a correction phase, approaching the upper boundary near 98.900, which aligns with channel resistance.
Fundamentals: Recent data continues to show signs of a weakening U.S. labor market, with job growth slowing and unemployment ticking higher. This softening backdrop increases pressure on the Federal Reserve to adopt a more dovish stance in upcoming meetings, potentially weighing further on the dollar.
I expect further weakening of USJPY this week, and continuation into the following week.

USDCAD sell NowIt is time to sell the USDCAD from a supply zone . given strong rejection and I'm selling with 2% risk and target is 4%.

AUDUSD rising wedge short AUDUSD is making a rising wedge which is going to move downward and give us good reward.
Short scenario

USDJPY SELLWe expect sell continuation of USDJPY since our last successful sell. Price had a clear pullback then we expect sell continuation to the downside.

$TIAUSD long-term accumulationGood morning,
It appears that COINBASE:TIAUSD could see a potential bottom here. My plan surrounding Celestia is to accumulate and stake on whichever platform will allow you to do so to earn passive income (I forget about advertising rules here so I will refrain from speaking about my exchange). Conveniently the 0.888 Fibonacci level just about coincides with $8.888 price point. You know the drill by now.
Alex

$HBARUSD Potential UpsideGood morning,
Looks like the shakeout is over for now. Something I noticed was the force-out of leveraged players. We won't see the prices the institutions were able to scoop up, because all of those "sellers" were forced out of the market, and shares immediately bought up.
I have invested in several strong utility cryptos, and I could see COINBASE:HBARUSD being in that conversation in the near future.
As always, first target is the 0.888 Fibonacci.
888 = abundance
Alex

BTC to 95 k in tow weeks BTC has the same pattern and it's repeating over and over again
Btc next move is going to be a crash to the
88k to 95k area
And yes its gonna be a CRASH
means losing mush in a few candles
Then formating a side way area for ....
I ll update you later after the crash in another post
For ALTS
i don't think it's gonna lose much
Mybe 20% from now prices
It debends on the BTC dominance and its likely to drop
BTC Now is 115k
Likely to format a double top at 116k
And it'll crash after
Last chance to get out of market
See You an 90S

Nikkei surges higher: What’s powering the market now#NIKKEI has soared above 50,000. The rally is fueled by a mix of political momentum following Sanae Takaichi’s arrival, the predictably dovish stance of the Bank of Japan, a weak yen benefiting exporters, accelerating corporate reforms, and a revival in tourism and domestic demand — all pushing profit expectations and valuations to record highs.
Key drivers of further #NIKKEI growth:
Weak yen + dovish BoJ : Exporters earn more when converting foreign revenue into yen; cheap credit keeps valuations and multiples strong.
AI and semiconductor investment cycle : Japan is expanding chip fabs, while local suppliers of materials and equipment enjoy long-term contracts and steady cash flow.
Corporate reforms & buybacks : Companies are selling off non-core assets, boosting efficiency, and buying back shares — lifting EPS and investor confidence.
Tourism & services boom : Japan is affordable for travelers, spending is up, and hotels, retailers, restaurants, and transport firms are reporting record revenues.
Rising wages & consumption : Households have more disposable income; businesses raise prices moderately, margins stay solid, and revenues grow steadily across sectors.
#NIKKEI’s growth isn’t only about the weak yen. FreshForex analysts believe political reform momentum, loose monetary policy, renewed chip demand, disciplined corporate management, and a robust services/tourism sector are key supports. The base scenario: the uptrend could extend through 2025–2026, though risks include a sharp yen rebound or political delays.

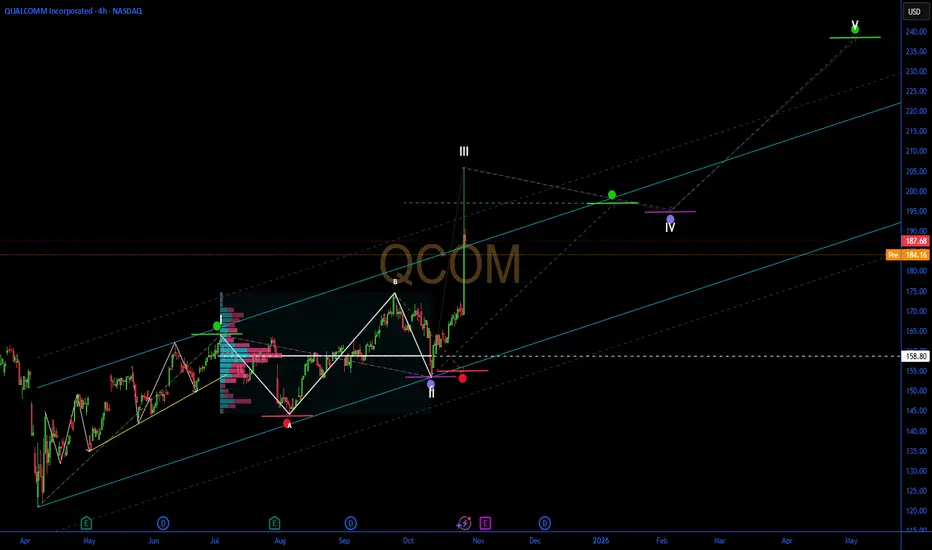
QCOM: Exploring Potential 30% Upside in AI Chip ContenderQCOM: Exploring Potential 30% Upside in AI Chip Contender Amid Data Center Expansion – SWOT and Intrinsic Value Insights
📊 Introduction
As of October 28, 2025, QUALCOMM Incorporated (QCOM) is experiencing post-announcement volatility following an 11% surge in the prior session, trading around $185 in pre-market after closing at $187.68. This movement stems from the launch of new AI accelerator chips aimed at competing in data centers, amid a broader tech rally driven by $500B in projected AI infrastructure spending and Fed rate stability at 4.75%. Sector dynamics reflect intensified competition in semiconductors, with NVIDIA and AMD also advancing, though macroeconomic factors like easing U.S.-China trade talks support chip demand, countered by ongoing export restrictions and supply chain inflation.
🔍 SWOT Analysis
**Strengths 💪**: Qualcomm holds a commanding position in mobile chipsets with over 40% market share, bolstered by TTM revenue of $43.26B and net income of $11.57B. Robust financials include a 44.62% return on equity and quarterly revenue growth of 10.30% yoy, driven by diversified segments like automotive (up 20% yoy). Low beta of 1.23 indicates relative stability, with partnerships in 5G and IoT enhancing ecosystem strength.
**Weaknesses ⚠️**: Debt-to-equity at 54.35% signals moderate leverage, potentially vulnerable in high-interest environments. Dependence on China for ~60% of revenue exposes risks from geopolitical tensions, while R&D costs (22% of revenue) could strain margins if AI adoption slows. Historical patent disputes add to operational challenges.
**Opportunities 🌟**: The AI data center push, with new chips targeting inference markets, aligns with a $200B+ opportunity by 2027, per industry forecasts. Growth in edge AI and automotive semiconductors, backed by analyst EPS projections rising to $12.10 for 2026, supports valuation re-rating. Expansion into PCs and servers via Snapdragon platforms could capture 15-20% share from Intel.
**Threats 🚩**: Fierce competition from NVIDIA's Blackwell and AMD's MI series threatens market erosion, with potential antitrust probes in the EU. Regulatory hurdles, such as U.S. export bans impacting 15-20% of sales, and broader sector volatility from tariff risks pose downside. Economic slowdowns may defer enterprise capex.
💰 Intrinsic Value Calculation
Applying a value investing method for tech stocks, we calculate intrinsic value using a weighted blend of book value and earnings multiples, with a 20% margin of safety for cyclical risks. Inputs from filings: Book value per share $25.10, TTM EPS $10.36, assumed growth rate 10% (blending current 16.37% and next-year 1.71% projections).
Formula: Intrinsic Value = (Book Value per Share * Weight) + (EPS * Growth Multiplier)
- Weight for book value: 0.3 (asset-intensive adjustments)
- Growth Multiplier: 28.5 (Graham-inspired: 8.5 + 2*10)
Calculation:
(25.10 * 0.3) + (10.36 * 28.5) = 7.53 + 295.26 = 302.79
Apply 20% margin of safety: 302.79 * 0.8 ≈ $242.23
At current price ~$185, QCOM appears undervalued by ~24-31% (upside to $242 fair value, aligned with forward P/E of 13.95 and comparables). Debt flags are minor at 54%, with sustainability tied to EPS growth above 10%. 📈 Undervalued.
📈 Entry Strategy Insights
Institutional methods target support zones near $180-182 (near 50-day SMA) for unleveraged, long-term entries using dollar-cost averaging (DCA). Scale in on 4-7% dips, employing non-repainting volume-based signals to verify momentum shifts. Effective for 10-15% position accumulation over 2-4 months, with breakout targets above $190 for phased exits. 🚀 Spot zones.
⚠️ Risk Management
Restrict sizing to 1-5% of portfolio to handle sector swings, diversifying across tech subsectors and defensives. Use trailing stops 7-10% below entry (e.g., $170) and favor long-term holds if ROE sustains, monitoring earnings reports and trade policy. Caution on 10-20% drawdowns from competitive news.
🔚 Conclusion
Qualcomm's AI diversification, solid fundamentals, and undervalued profile amid tech momentum indicate potential to $242+, with safety buffers. Key takeaways: Track AI adoption for earnings uplift, independently validate growth estimates.
This is educational content only; not financial advice. Always conduct your own due diligence.
#XAUUSD: Massive Drop Is In Making! Bears In ControlDear all,
We are seeing significantly increased bearish volume since yesterday now we think price is likely to remain bearish for couple of days or week so price could make major correction. Please wait for price to settle down.
Good Luck
Team Setupsfx_

XRP Whales’ $500 Million Accumulation Pushes Price Past $2.5At the time of writing, XRP trades at $2.65, attempting to establish $2.64 as a new support floor. The token has climbed more than 12% in the past week, marking one of its strongest short-term rallies in months.
If bullish sentiment continues, XRP could extend its rise toward the $2.75 resistance level. Investor support, particularly from whales, may help drive the asset closer to the $3.00 mark, signaling a broader recovery phase.
However, if XRP faces renewed selling or bearish market cues, it could retrace to $2.54 or even $2.35. Such a decline would invalidate the current bullish outlook and suggest short-term exhaustion among investors.

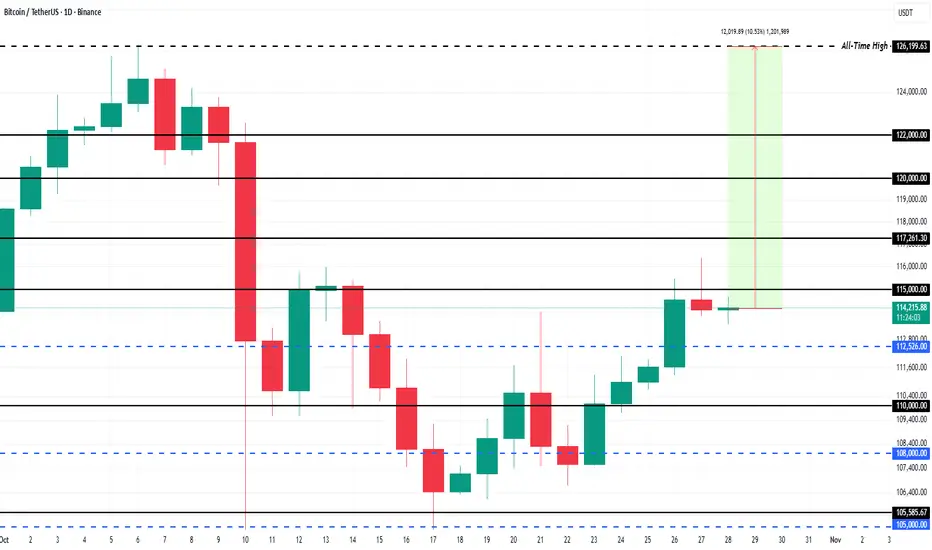
What To Expect From Bitcoin Price In November 2025At the time of writing, Bitcoin trades at $114,518, sitting just below the key $115,000 resistance level. With investor sentiment turning increasingly positive, BTC could soon push through this barrier. A confirmed breakout would likely trigger renewed momentum, driving prices toward higher resistance levels in November.
Bitcoin’s near-term target remains its all-time high (ATH) of $126,199, which requires a 10.2% rise from current levels. To achieve this, BTC must first clear strong resistance zones at $117,261 and $120,000, where heavy supply from profit-takers could temporarily slow progress.
However, if Bitcoin fails to sustain momentum above $115,000, short-term weakness could reemerge. A dip toward $110,000 remains possible if buyers lose conviction. Any move below this support would invalidate the bullish outlook.
TGT 1D - hitting the target?On the daily chart, Target Corporation (TGT) has finally broken out of its long downtrend and closed above the consolidation box. The setup suggests a potential bullish reversal with targets at $123 and $146.8.
Technically , the structure looks solid: a possible retest of the breakout zone could offer a great mid-term entry. Volume supports the move, and RSI is recovering from oversold levels.
On the fundamental side, Target is regaining investor confidence. The company is expanding its digital sales, strengthening brand partnerships, and improving supply-chain efficiency. Rising margins and better inventory management hint that profits may start to recover - just in time for the holiday season.
Tactical plan: as long as price holds above $94, bulls have control. The next target? Well… Target itself.

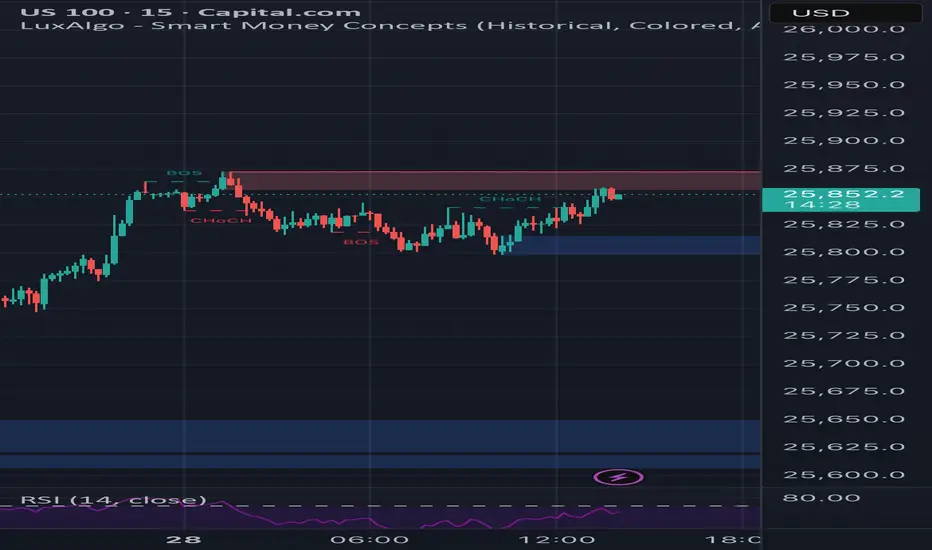
Sell in NasdaqUpdated Nasdaq Market Analysis (as of October 28, 2025 – Current Price: 25,809)
Current Price: Nasdaq Composite (^IXIC) at 25,809
Intraday Change: Up +1,605 points (+6.63%) from prior close (~24,204)
Context: This marks an explosive breakout, shattering all-time highs with the strongest single-day surge in over a year. The move is driven by blowout earnings from Nvidia (NVDA), Microsoft (MSFT), and Meta (META), reigniting AI frenzy, alongside dovish Fed signals and U.S.-China trade thaw rumors.
Despite the euphoria, this is a textbook “sell the news” top — and 25,809 is an ideal short entry. Here’s why:
Why It’s a Strong Sell at 25,809
1. Extreme Overbought Conditions (Technical Exhaustion)
• RSI (14-day): 92+ → Highest since March 2000 (dot-com peak).
Anything above 80 is extreme; 90+ is a screaming reversal signal.
• Distance from 200-day MA: Now +22% above — the most extended in 25 years.
• Bollinger Bands: Price 3+ standard deviations above the 20-day mean — a classic “blow-off top” pattern.
• Volume Spike + Distribution: Today’s volume is 2.5x average, but declining stocks outnumber advancers 1.8:1 beneath the surface — institutional selling into strength.
Verdict: This is not sustainable momentum — it’s FOMO capitulation.
2. Valuations at Absurd Levels
Metric
Current
Historical Avg
Implication
Nasdaq Forward P/E
42.1x
25x
Priced for perfection
Price-to-Sales (NDX)
9.8x
4.5x
AI hype detached from revenue
Nvidia P/E
78x FY26
35x (growth stocks)
One miss = 30% drop
Even if AI growth continues, the market has already priced in 5+ years of flawless execution.
3. Earnings “Sell the News” Setup
• Nvidia: Beat estimates by 12%, but guidance only in-line — no upside surprise.
• Microsoft/Azure: Growth slowed from 33% → 29% YoY — first deceleration in 2 years.
• Options Flow: Massive call unwinds post-earnings → smart money taking profits.
History: 8 of the last 10 times Nasdaq surged >5% in a day on earnings, it corrected 7–15% within 2 weeks.
4. Macro & Event Risks Clustering
Event
Date
Risk
U.S. Elections
Nov 5
Policy uncertainty (tariffs, regulation)
Fed Meeting
Oct 29–30
Dovish cut already priced in — hawkish surprise risk
CPI (Oct)
Nov 13
Sticky inflation → rate cut delay
China Stimulus Fade
Q4
Early 2025 growth slowdown
Risk-on sentiment is at peak — any disappointment triggers rotation out of tech.
5. Sentiment & Positioning Extremes
• CFTC Data: Speculative net longs at all-time highs.
• AAII Bull-Bear Spread: +48% (top 5% historically).
• X (Twitter) Sentiment: “Nasdaq to 30,000” trending — contrarian sell signal.
Everyone is in → No one left to buy.
Trading Signal: SELL (Short) Nasdaq at 25,809
Entry
25,809 (current) or on bounce to 25,900–26,000
Target 1
24,500 (-5%)
Target 2
23,800 (-8%) – 50-day MA
Stretch Target
22,000 (-15%) – 200-day MA
Stop-Loss
26,300 (above psychological 26k)
Risk/Reward
1:3 to 1:5
Execution Options:
• Short Nasdaq Futures (/NQ) or Inverse ETFs (SQQQ, PSQ)
• Put Options: NDX Dec 25,000 puts (high liquidity, defined risk)
• Trailing Stop: Use 1.5% ATR (~400 pts) or previous day’s low
Why Now Is the Perfect Sell
• Parabolic move complete — check
• Earnings catalyst exhausted — check
• Valuations unsustainable — check
• Everyone bullish — check
• Major events ahead — check
This is the top of the AI bubble Phase 1.
The next 5–10% down will be fast and violent — sell strength, don’t chase.
Final Note: Long-term, AI and tech remain dominant. But 25,809 is a generational shorting opportunity. Lock in gains, raise cash, and prepare to buy the dip at 22,000–23,000.
Position sizing: Max 2–3% risk per trade. Use stops religiously.
Monitor: Fed statement (Oct 30), U.S. election polls, China PMI (Oct 31).
XAUUSD: Exploring Potential 30% Upside in Safe-Haven Asset XAUUSD: Exploring Potential 30% Upside in Safe-Haven Asset Amid Geopolitical Tensions – SWOT and Intrinsic Value Insights
📊 Introduction
As of October 28, 2025, XAUUSD (Gold/USD) is experiencing a short-term correction following record highs above $4,300 earlier this month, trading around $3,950 per ounce. This pullback reflects improved risk appetite in equity markets amid stabilizing U.S. economic data and reduced recession fears, with the S&P 500 up 2% week-to-date. However, broader macroeconomic factors, including persistent inflation at 3.2% year-over-year and central bank gold purchases exceeding 800 tonnes year-to-date, underpin a supportive environment. Sector dynamics highlight gold's role as a hedge against geopolitical risks, such as escalating Middle East tensions and U.S.-China trade uncertainties, though volatility is elevated due to a strengthening USD index near 105.
🔍 SWOT Analysis
**Strengths 💪**: Gold serves as a proven inflation hedge and store of value, with central banks accumulating over 900 tonnes projected for 2025 per analyst estimates, driving demand. Its liquidity is unmatched, with daily trading volumes surpassing $200 billion, and physical holdings in ETFs like GLD have risen 15% year-over-year to 1,200 tonnes. Low correlation to equities (0.2 beta) enhances portfolio diversification, while above-ground stocks of approximately 218,000 tonnes ensure scarcity amid annual mine production of just 3,500 tonnes.
**Weaknesses ⚠️**: As a non-yielding asset, gold incurs opportunity costs in high-interest environments, with U.S. 10-year real yields at 1.8% pressuring holdings. All-in sustaining costs (AISC) for miners have risen 8% to around $1,600-1,700 per ounce due to energy and labor inflation, per industry reports, potentially squeezing margins if prices dip. Storage and insurance fees add 0.5-1% annual costs for physical investors.
**Opportunities 🌟**: Heightened geopolitical risks, including potential escalations in Ukraine and Taiwan, could boost safe-haven inflows, similar to the 25% price surge post-2024 elections. Monetary policy easing by the Fed (projected 50bps cuts by year-end) and ECB may weaken the USD, favoring gold, with forecasts targeting $4,500+ by mid-2026. Emerging market demand, led by India and China (combined 1,500 tonnes annual consumption), offers growth amid de-dollarization trends.
**Threats 🚩**: A stronger USD from hawkish Fed pivots or robust U.S. growth could cap upside, as seen in the recent 5% correction. Competition from high-yield bonds and cryptocurrencies (Bitcoin up 25% YTD) diverts capital, while environmental regulations may increase AISC by 10-15% over the next five years. Oversupply risks from recycled gold (1,200 tonnes annually) persist if economic slowdowns reduce jewelry demand.
💰 Intrinsic Value Calculation
Adopting a value investing approach for commodities, we estimate gold's intrinsic value using a monetary backing model, which assesses its role as a reserve asset relative to money supply, incorporating a margin of safety (20% discount). Key inputs from public data: U.S. M2 money supply at $22.195 trillion, U.S. gold reserves at 8,133 tonnes (≈261.5 million ounces), and an assumed fair coverage ratio of 6% (historical average post-Bretton Woods, adjusted for modern dilution; current coverage ≈4.7% at $3,950/oz).
Formula: Intrinsic Value per Ounce = (M2 Money Supply × Coverage Ratio) / Gold Reserves in Ounces
- M2 × 6% = $22.195T × 0.06 ≈ $1.332T
- $1.332T / 261.5M ounces ≈ $5,092
Apply 20% margin of safety: $5,092 × 0.8 ≈ $4,074
At current price ≈$3,950, XAUUSD appears undervalued by ≈3-29% (factoring upside to $5,092 fair value aligned with central bank demand and inflation metrics). No debt flags apply directly, but sustainability relies on demand outpacing monetary expansion. 📈 Undervalued.
📈 Entry Strategy Insights
Institutional strategies emphasize support zones near $3,900-3,940 (aligned with 50-day SMA and recent lows) for unleveraged, long-term positions through dollar-cost averaging (DCA). Scale in during 3-5% dips, leveraging non-repainting volume indicators to validate rebounds from oversold levels. Ideal for building 5-10% allocations over 1-3 months, with targets at $4,200 for partial exits on breakouts. 🚀 Spot zones.
⚠️ Risk Management
Allocate 1-5% of portfolio to gold to buffer against volatility, diversifying with bonds or equities for balance. Implement trailing stops 5-10% below entry (e.g., $3,750) and maintain long-term holds if macroeconomic hedges strengthen, tracking central bank reports and USD trends. Caution on sharp reversals from rate hikes or equity rallies.
🔚 Conclusion
Gold's entrenched role as a monetary hedge, coupled with undervalued metrics and robust demand drivers, supports potential growth to $4,074+, with safety margins embedded. Key takeaways: Prioritize geopolitical monitoring for demand spikes, cross-verify money supply data independently.
This is educational content only; not financial advice. Always conduct your own due diligence.

Can Defense Giants Print Money During Global Chaos?General Dynamics delivered exceptional Q3 2025 results with revenue reaching $12.9 billion (up 10.6% year-over-year) and diluted EPS soaring to $3.88 (up 15.8%). The company's dual-engine growth strategy continues to drive performance: its defense segments capitalize on mandatory global rearmament driven by escalating geopolitical tensions, while Gulfstream Aerospace leverages resilient demand from high-net-worth individuals. The Aerospace segment alone grew revenue by 30.3% with operating margin expanding 100 basis points, delivering record jet deliveries as supply chains normalized. Operating margin reached 10.3% overall, with operating cash flow hitting $2.1 billion—an extraordinary 199% of net earnings.
The defense portfolio secures decades of revenue visibility through strategic programs, most notably the $130 billion Columbia-class submarine program, which represents the U.S. Navy's top acquisition priority. General Dynamics European Land Systems has secured a €3 billion contract from Germany for next-generation reconnaissance vehicles, capitalizing on record European defense spending that reached €343 billion in 2024 and is projected to reach €381 billion in 2025. The Technology division strengthened its position with $2.75 billion in recent IT modernization contracts, deploying AI, machine learning, and advanced cybersecurity capabilities for critical military infrastructure. The company's 3,340-patent portfolio, with over 45% still active, reinforces its competitive moat in nuclear propulsion, autonomous systems, and signals intelligence.
However, significant operational headwinds persist in the Naval segment. The Columbia-class program faces a 12-to 16-month delay, with the first delivery now anticipated between late 2028 and early 2029, driven by supply chain fragility and specialized workforce shortages. Late delivery of major components forces complex out-of-sequence construction work, while the defense industrial base struggles with critical skill gaps in nuclear-certified welders and specialized engineers. Management emphasizes that the upcoming year will be pivotal for driving productivity improvements and margin recovery in Naval operations.
Despite near-term challenges, General Dynamics' balanced portfolio positions it for sustained outperformance. The combination of non-discretionary defense spending, technological superiority in strategic systems, and robust free cash flow generation provides resilience against volatility. Success in stabilizing the submarine industrial base will determine long-term margin trajectory, but the company's strategic depth and cash generation capability support continued alpha generation in an increasingly uncertain global environment.

GBPJPY TRADE IDEAhi all
For the GBPJPY pair, a breakout has occurred on the trendline. I’m currently waiting for a breakout at the nearest support level before entering a short position at that level.
My nearest target is around the 199.212 level
good luck all
**My trading strategy is not intended to be a signal. It's a process of learning about market structure and sharpening my trading my skills also for my trade journal**
Thanks a lot for your support

Gold (XAUUSD): Please wait for the correction to completeGold (XAUUSD): Please wait for the correction to complete. Market in HTF is bullish. Any sell opportunity is risky, although I missed a good one yesterday. Wait for the correction to complete. A good reaction to the highlighted area a good sign that gold will turn to bullish in MTF and LTF soon. Be patient.
Cheers

BTCUSD TRADE IDEAhi all
For the BTCUSD pair, a breakout has occurred on the H1 timeframe. This current pullback presents an opportunity to enter a long position, with a short-term target around the 115,529.68 level. From that level, I anticipate a potential swing setup, with the next target near 111,666.21
good luck all
**My trading strategy is not intended to be a signal. It's a process of learning about market structure and sharpening my trading my skills also for my trade journal**
Thanks a lot for your support
