Gold idea Gold (XAU/USD) is respecting the rising support trend line and continues to push upward. Price is holding above 4215, showing bullish momentum. A breakout toward the resistance zone targets the 4300 level, where the next major reaction is expected.
Fundamental Analysis

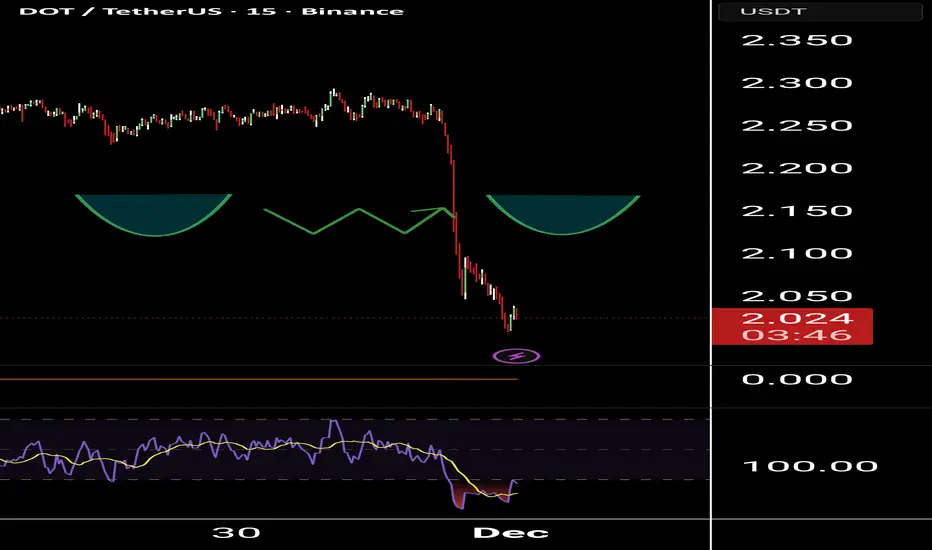
Polka dots Cyber Monday 2025Today polkadot Kissed The All time low $2 when it originally launched. I'm excluding the Black swan event at .6 ish. $2 for anyone who has kept up with this project will know We will hopefully never see these prices again. I hope you guys are able to get some today; as I did!
As always, this is not financial advice. Moreover, I do have a substantial position in this project and still DCA'ing.
Buying opportunities on EURUSDEURUSD closed near 1,1600 and we expect the bullish move to continue.
The main focus remains on next week’s interest rate decision and any accompanying statements, as they could bring increased volatility.
The next resistance level to watch is 1,1650 — a break above it would be significant.
Look for potential buying opportunities on pullbacks.

After the market opens, I will continue to go long on gold!The countdown to the opening of the gold market has begun! Before the market opens, let's review last week's market movements and trading strategies.
Last week's market performance was very stable compared to previous weeks, with an overall upward trend and relatively small intraday pullbacks without significant volatility. This kind of market movement is very favorable for traders. Our trading strategy, from opening to closing, focused on going long on gold for several trading days, with our thinking largely in sync with the market movement, including our prediction that Friday's closing price would be above $4200, which all came true. It's no exaggeration to say that I still have long positions held in my account, bought at $4050. For those who haven't followed me, you can check out my historical perspectives.
As seen from last week's price action, gold is regaining its strength, gradually recovering lost ground and approaching previous highs. The weekly price has rebounded above all major moving averages, and the daily and hourly charts also show strength. Therefore, after the market opens, our strategy will remain primarily long. I plan to enter the market in batches in the $4190-$4210 range, a level with strong support and relatively safe entry.
The above views represent my personal thoughts. If you do not yet have a clear trading strategy or the ability to independently analyze market trends, you are welcome to refer to them! Let's improve together! If the market changes, I will notify you in the channel!

Gold sets to sweep imbalance at 4190’sGold market breaks above 4246 during the Asian open, confirming a fresh breaker structure and reinforcing bullish intent.
With this structural shift, price is now projecting a corrective move to mitigate the imbalance at 4193, before potentially resuming its upward trajectory. follow for more insights , comment and boost idea … y’all

GBPJPY POSSIBLE SHORT!On the weekly timeframe, price action printed equal highs, GJ has been trending upwards for quite some time, it may not be over still but those WEEKLY EH's got my attention, on the 1 hr chart, GJ established a strong break of the previous Higher Low which was around 206.174. Once again, this move on the 1hr may very well just be a pullback but I'll sit on my hands and wait it out on the higher tf's. An Order block that hasnt been mitigated as yet is interesting at 206.536. GBP and JPY have low to medium impact news coming out during the earlier part of the week as well.

XAUUSD: Buy on a pullback to 4190After last Friday’s strong and continuous rally, gold remains firmly in a bullish formation. However, it’s important not to overlook the potential risk of a corrective pullback.
On the 4-hour chart, prices are approaching the previous highs, and gold is currently trading near an upper-wick zone, suggesting increasing selling pressure. At this stage, chasing the upside is no longer an optimal strategy, as the risk of a near-term retracement continues to rise.
A more prudent approach would be to wait for a pullback before re-entering long positions.
From the 1-hour chart, the nearest meaningful support lies in the $4,200–$4,190 zone, which represents both a psychological round-number level and an area close to previous swing highs. If the $4,200–$4,190 support range holds, it would provide an opportunity to resume long positions in alignment with the broader uptrend.
Trading Plan:
Buy: $4,200–$4,190 zone
Take Profit 1: $4,230
Take Profit 2: $4,250
Stop-loss: Adjust based on individual capital and risk tolerance

XAUUSD – LANA PRIORITIZES BUYING ACCORDING TO SWING WAVES AT...XAUUSD – LANA PRIORITIZES BUYING ACCORDING TO SWING WAVES AT THE BEGINNING OF THE WEEK
Fundamental Analysis
The Fed has just announced it will end the QT (quantitative tightening) program from December 1st, accompanied by a target federal interest rate of 3.75–4%.
When the Fed stops QT, the pace of balance sheet reduction slows down, meaning the pressure to withdraw liquidity from the market decreases, which is usually a positive factor for risky assets and gold.
Mechanism:
QE: balance sheet expands, injecting liquidity into the market.
QT: balance sheet contracts, withdrawing liquidity.
The temporary halt of QT leads the market to expect the Fed is being softer with monetary policy, thereby supporting the medium-term upward trend of gold.
In this context, Lana perceives that gold at the beginning of the week still has room to rise, but there will be fluctuations around important liquidity zones.
Technical Analysis
On the H4 chart, the price structure is following an upward Elliott wave, with clear waves (1)–(2)–(3)–(4)–(5). The current upward wave has not yet shown a major reversal signal.
The Swing zone 4190–4195 below is the nearest important bottom, acting as the main short-term support. This is also where Lana prioritizes watching for swing wave buying.
Above, two notable Liquidity zones:
4250–4260: near liquidity zone, potential for fake break/adjustment.
4365–4370: further liquidity zone, coinciding with the old peak, likely a strong profit-taking area if the price continues to expand the upward wave.
Lana's preferred scenario: gold may slightly adjust to the swing zone 4190–4195, then continue to expand the wave to test the upper liquidity zones in turn. However, right at the Liquidity zone, the market is very prone to stop sweeps, fake breaks, so Lana does not encourage chasing Buy at these zones.
Price Zones to Watch
Main Support (Swing & Buy Zone): 4190 – 4195
Resistance / Liquidity Zones: 4250 – 4260
4365 – 4370
Trading Scenario
Buy 4190 – 4195
SL: 4185
TP: 4250 – 4260 – 4365 – 4370

AUDUSD Continues its bullish trend No divergence is visible. The market is clearly making a series of Higher Highs (HHs) and Higher Lows (HLs). AUD is fundamentally strong this week compared to USD, so the best approach is to follow the trend.

S&P 500 Technical & Fundamental Outlook — Week of De 1–5 2025Technical Analysis Summary – SPX Compression Structure
SPX is currently trading inside a contracting price formation, defined by a descending resistance trendline from recent highs and a rising support trendline from the early Q4 low. This structure represents a period of market indecision and volatility compression, where buyers and sellers are positioning before a larger directional move.
Key Observations
The upper trendline marks repeated rejection points — this is a clear overhead supply zone.
The lower trendline shows higher lows forming — underlying demand is still present.
Price is compressing toward an apex, and historically, these structures lead to strong expansion once resolved.
Because of this setup, entries inside the wedge are high-risk and low-reward, as price tends to chop and trap both sides until a breakout or breakdown is confirmed.
Bullish Scenario
A bullish continuation requires:
A clean breakout above the descending trendline
A successful pullback that holds as support (higher low)
Continuation momentum
This would indicate that buyers have absorbed supply and are in control. Upside levels then open toward the previous reaction highs, and momentum buyers may accelerate the move.
Bearish Scenario
A bearish continuation is confirmed by:
A breakdown below the rising trendline
A failed retest of that area from below (lower high)
Increase in downside momentum or volume
This would signal that buyers have lost control of the trend, and trapped long positions above could fuel a deeper correction toward prior support levels.
Conclusion
The SPX is coiling inside a clear compression pattern.
The proper approach is to wait for the market to choose direction, then position after confirmation, not before.
This is a breakout-or-breakdown environment — not a place to trade the middle.The Market Is Rallying — BUT The AI Trade Is Fragile
Stocks rebounded hard this past week after the biggest pullback since April, mainly because:
Markets believe the Fed will cut in December (rate-cut odds jumped to 80%+).
BUT:
Mega-cap AI names remain volatile.
AI profitability narrative is being challenged.
This is the key line in the sand for SPX right now:
AI spending is massive, but profits are not yet confirmed.
That’s the reason NVDA + GOOGL are whipping around so violently.
⚠️ 2. The Narrative Shift You Must Watch
The market is shifting from "AI growth" → "AI returns".
Matthew Maley (Miller Tabak):
“The narrative surrounding the profitability of AI is coming under question.”
Translation for traders:
No longer enough to say “AI spending”.
Now the market wants proof of revenue + margins.
If that narrative worsens → SPX pressure.
This week was a warning shot:
Alphabet mooning on Gemini 3 news → “AI winner” narrative
Meta possibly buying Google chips → hurts NVDA
Semis shook → volatility in the core leadership names
If NVDA becomes an AI CAPEX victim instead of the bottleneck supplier → the entire AI bull leg changes.
📉 3. Bitcoin’s Slide = Waning Risk Appetite
Bitcoin fell from $125k → under $90k.
King Lip (BakerAvenue):
“Bitcoin serves as a risk proxy for equities.”
This matters because:
SPX often peaks when BTC momentum dies.
Risk is shifting from growth/AI → defensives/small caps.
Crypto weakness = risk appetite fading.
📈 4. SPX Context — This Is NOT a Crash, It’s a “Narrative Test”
SPX is +16% YTD heading into a historically strong window.
December is the 3rd-best month since 1950 (avg +1.43%)
Market is still at the ceiling:
SPX is only ~1% below its October ATH
Nasdaq is ~3% off its high
This is not bearish selling.
This is positioning + narrative testing.
🧠 5. What Is Hurting Tech Right Now
Two forces:
A. Timing of monetization
Companies spent hundreds of billions on training + infra.
But when do earnings arrive?
Nobody knows.
Paul Nolte:
“Investors are rethinking how quickly this will hit bottom lines.”
This is the heart of the SPX risk.
B. Tech Debt Issuances
Big AI names issued heavy debt to fund expansion.
This scares valuation models.
When the “future promises” trade meets balance sheet reality → rotations begin.
💵 6. Fed Cuts: The Bullish Counterweight
Traders now price:
80%+ odds of a December rate cut
This is huge because:
Cuts expand breadth in the SPX
Small caps, cyclicals, value names get oxygen
This is the exact reason SMID outperformed this week.
Anthony Saglimbene:
“What I’m watching is if rate cuts bring momentum outside of tech.”
This is literally the rotation we’ve been waiting for.
🏭 7. Macro Ahead — SPX Sensitivity
Next week will hit:
Manufacturing ISM
Services ISM
Consumer sentiment
CRM, DLTR, KR earnings (consumer health)
Holiday retail performance (Black Friday / Cyber Monday)
👉 But note: many core economic releases were delayed or cancelled due to the 43-day government shutdown.
Saglimbene:
“Investors will have to deal with the fog.”
This creates high headline volatility on SPX going into January.
🔑 8. THE REAL TAKEAWAY FOR SPX & NDX TRADERS
This is no longer a hype-cycle AI rally.
You must trade:
Earnings
Margin guidance
Capex-to-revenue timing
🎯 AI → cost center (now)
🎯 AI → profit engine (unknown)
As long as that uncertainty persists,
➡️ volatility in NVDA, AAPL, GOOG, MSFT, META remains
➡️ SPX stays sensitive at the highs
🧨 Trader-Level Summary (no commentator BS)
Bullish forces
Fed rate cut probability exploding higher
Seasonality (December = historically strong)
Market breadth improving beyond megacaps
Bearish forces
Bitcoin risk proxy collapsing
AI spending profitability questioned
Mega-cap tech debt issuance
“Infra first, profits later” fear
🔥 HOW TO TRADE THIS (S&P Focused)
Watch these 3 things every day:
1️⃣ NVDA price action
If NVDA cracks ↓ → SPX loses leadership.
2️⃣ Alphabet’s Gemini 3 momentum
If Gemini models take market share:
→ NVDA supply chain narrative fractures
→ Rotation to CPUs/TPUs → hurting semis
3️⃣ Bitcoin risk proxy
BTC < $90k = risk appetite unwinding
🏁 ONE SENTENCE THAT MATTERS
SPX is still bullish, but leadership is no longer unquestioned — AI profitability and risk appetite are now the drivers, not AI hype.

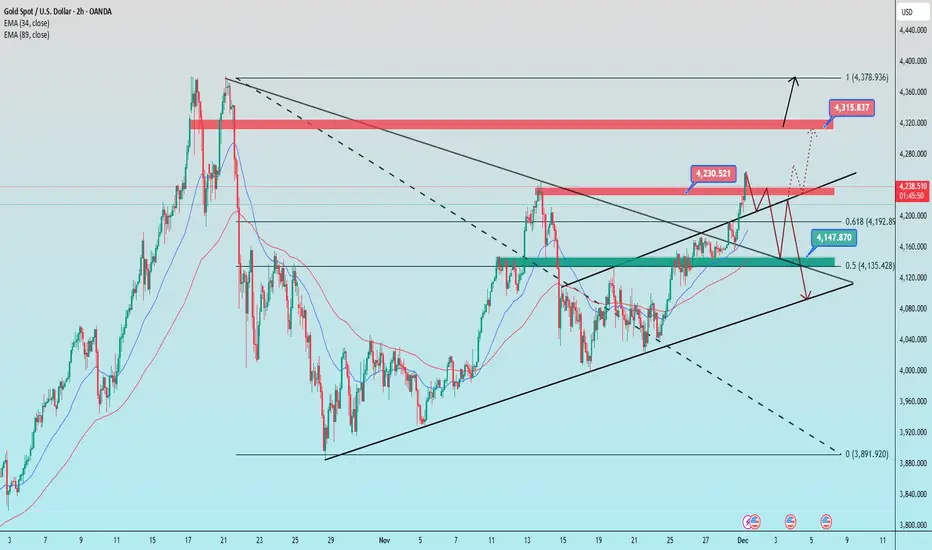
How did gold move in the first week of December? CONCISE & COMPREHENSIVE TECHNICAL ANALYSIS
1. Trend Lines
Ascending trend line (lower black line)
This is the main dynamic support of the current uptrend structure.
The price has bounced off this trend line several times → the short-term trend remains bullish as long as this line is not broken.
Major descending trend line (upper black line)
This is strong dynamic resistance on larger time frames, and the price recently touched this area.
This is an area where selling pressure frequently arises.
2. Support – Resistance
Resistance
4,243–4,245 (red zone):
This is the confluence of the previous peak and the descending trend line → selling pressure appears right in this area.
4,315–4,320 (next major resistance):
If this area is broken, the price will likely head towards 4,375–4,380.
Support
4.147–4.150 (green zone confluence):
Confluence of moving averages, the nearest swing low, and Fibonacci levels → important support that maintains the bullish structure.
4.105–4.120 (lower trendline):
If the price breaks through this area → the short-term trend has the potential to turn bearish.
3. Fibonacci
Fibonacci 0.618 = 4.194
→ Area with a high probability of a rebound if the price corrects.
Fibonacci 0.5 = 4.135
→ Confluence with strong support + trendline → potential buy zone if a deeper pullback occurs.
4. Price Scenarios
Scenario 1 – Continue Upward (Priority)
If the price remains above 4,200–4,215, there is potential for a retest:
➡️ 4,230 → 4,315 → 4,375
Scenario 2 – Downward Correction
If the price breaks through 4,190 and breaks through the green zone of 4,144–4,150, then:
➡️ Risk of a downward movement towards the 4,105–4,120 trend line
📌 Trading Plan
BUY GOLD: 4,148 – 4,250
Stop Loss: 4,138
Take Profit: 100–300–500 pips
SELL GOLD: 4,313 – 4,315
Stop Loss: 4,325
Take Profit: 100–300–500 pip
XAUUSD retesting broken zone — expecting bullish continuation.Gold is in a strong uptrend.
• Price has broken resistance and may retest it as support.
• After retest, the expectation is a bullish continuation.

XAU/USD Price Outlook – Trade Setup📊 Technical Structure
FOREXCOM:XAUUSD Gold (XAU/USD) pulls back toward the 4,220–4,210 support zone after briefly testing the 4,256–4,266 resistance zone, while the broader bullish structure remains intact. Price continues to respect the rising trendline, and buyers are expected to re-enter on dips as long as support holds.
The chart presents a bullish continuation structure:
Support zone: 4,220 – 4,210
Resistance zone / target area: 4,256 – 4,266
While price stays above 4,210, corrective moves into support are likely to attract buying interest, with upside potential toward 4,256–4,266. A 4H close below 4,206 would invalidate the bullish structure and expose the 4,190 region.
🎯 Trade Setup
Idea: Buy dips into support, targeting a move toward the 4,256–4,266 resistance zone.
Entry: 4,220 – 4,210
Stop Loss: 4,206
Take Profit 1: 4,256
Take Profit 2: 4,266
Risk–Reward Ratio: ≈ 1 : 2.52
Bias stays constructively bullish while price holds above 4,220–4,210 on a closing basis.
A break below 4,206 would signal weakening momentum and invalidate the bullish idea.
🌐 Macro Background
According to FXStreet, gold extends gains above $4,200 as expectations for a December Fed rate cut continue to build. Markets now price in an 87% probability of easing at the December 9–10 FOMC meeting, significantly higher than the previous week.
Fed & USD drivers:
Weaker US economic data and dovish remarks from policymakers boost rate-cut bets.
Lower interest rates reduce the opportunity cost of holding gold, supporting upward momentum.
ISM Manufacturing PMI due later today may influence USD volatility—stronger data could weigh on gold temporarily.
Geopolitical factors:
Progress in US–Ukraine peace discussions may limit safe-haven demand.
Trump’s special envoy traveling to Moscow this week keeps geopolitical risk in focus, though the tone remains cautiously optimistic.
Overall, the macro backdrop continues to favor upside for gold while dips remain well-supported.
🔑 Key Technical Levels
Resistance zone: 4,256 – 4,266
Support zone: 4,220 – 4,210
Invalidation level (bulls): 4,206
📌 Trade Summary
XAU/USD maintains a bullish continuation structure above the 4,220–4,210 support area. As long as this zone holds, the setup favours buying dips and targeting 4,256–4,266. Fed rate cut expectations and geopolitical developments continue to provide underlying support for gold, though US data may introduce short-term volatility.
⚠️ Disclaimer
This analysis is for reference only and does not constitute trading advice. Trading involves significant risk, and proper risk management is essential.

XAUUSD | Gold Signal |Dec 1,2025BUY TREND TARGET FOR TODAY 📊
☄️ GOLD (XAU/USD) H1 STRUCTURE BREAKDOWN: BULLS IN CONTROL ☄️
The market has decisively confirmed the trend reversal. After navigating the consolidation phase, the price action has established a strong, clear Bullish structure.
📊Key Observations
🔤Clear BOS: We have seen multiple Bullish Break of Structures (BOS), confirming that buyers are in complete control of the H1 timeframe. The initial structural resistance (4140-4150) has been cleared.
🔤Current Price Action: Price is currently pushing into the prior high liquidity zone (around 4220) and shows strong momentum, now trading near 4250.
🔤Unmitigated FVG: The most critical immediate Demand Zone lies around 4150 - 4160 (FVG/Order Block). This is the key zone the price may return to for mitigation before continuing higher.
📊Trading Outlook
🔤The bias remains STRONGLY BULLISH.
🔤Primary Strategy: Look for BUY opportunities on minor pullbacks or when price revisits the nearest Demand Zone/FVG for correction.
🔤Invalidation: A decisive close below the key structural low (the Order Block below 4150) would signal a CHoCH back to bearish pressure.

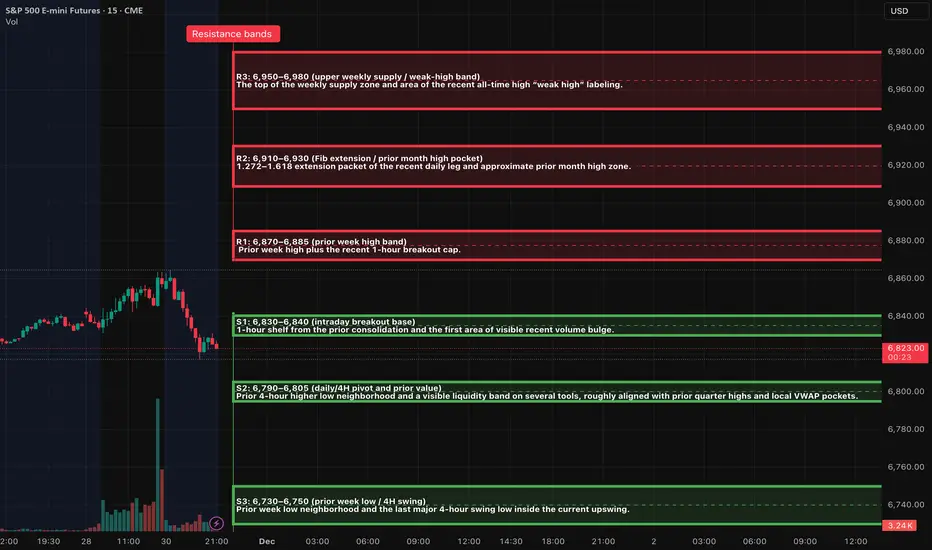
ES (SPX, SPY) Deep Analyses for Upcoming Week (Dec 1st - 5th)Multi-Timeframe Market Structure Analysis
Weekly Trend Overview
The E-mini S&P 500 (ES) continues to reflect a robust bullish trend on the weekly chart, characterized by a series of higher highs and higher lows. The most recent swing low is situated in the mid-6,500s, while prices are currently testing the previous weekly high zone around the high-6,800s, accompanied by a labeled weak high band overhead.
In terms of market positioning, prices reside firmly in the upper half of the annual range, trading within a premium supply band rather than at a discount. Momentum indicators are showing signs of a slowdown, with the weekly oscillator retreating from overbought conditions and gently sloping downward, even as prices hold near their highs. This situation exemplifies early-stage negative momentum divergence, suggesting that while the overarching trend remains intact, any upside progress is now slower and increasingly susceptible to pullbacks.
The structural bull market on the weekly timeframe is still valid, but the current price action falls into a costly zone, placing the onus on buyers to maintain upward momentum.
Daily Trend Analysis
Following a notable decline in November from the all-time high, ES established a higher low around the mid-6,500s, coinciding with a key extension bundle. Subsequently, it rebounded through the mid-6,700s, successfully reclaiming the essential daily midrange. The latest price action reflects a sequence of lower lows (LL), higher lows (HL), and a higher high, signaling a short-term bullish trend within a broader sideways pattern just beneath the recent highs.
The active daily range is delineated between 6,650 and 6,900, with current trading situated in the upper third. The daily momentum oscillator has sharply ascended from oversold territory and sits comfortably in the 60s—nearing overbought conditions but not quite there yet.
The daily trend indicates an uptrend initiated from a higher low, now testing resistance levels. Trend-following participants are positioned long, though late entrants may find themselves crowded near the upper edge of the trading range.
Four-Hour Structural Insights
The 4-hour chart reveals a strong reversal from a low around 6,525, where price structure has formed a clean stair-step of higher highs and higher lows. The latest 4-hour higher low rests in the high-6,700s. The recent impulse leg from this higher low has driven prices into the prior week's high and supply band near the high-6,800s. Observations indicate that candles are narrowing while wicks are extending, typically signaling an impending maturation of the current price leg.
While this remains largely an impulse move rather than a complete correction, the risk-to-reward ratio for entering fresh long positions at these levels appears unfavorable without a corrective pullback.
The 4-hour trend is decidedly bullish, yet this leg is maturing. A retracement toward the last observed higher low band in the high-6,700s would be both typical and healthy for the ongoing progression.
One-Hour Intraday Context
The 1-hour chart indicates a prolonged consolidation phase in the low-to-mid-6,800s, succeeded by a breakout thrust toward the prior week’s high. Recent micro-structural developments show small higher highs with diminished follow-through into the resistance zone. The emergence of upper wicks on the 1-hour candles suggests we're in the later stages of this move which originated from Friday’s New York low.
For intraday traders, entering new positions at this stage carries poor asymmetry. Strategies may involve either capitalizing on a potential exhaustion spike higher or considering buys only after a reset lower.
The intraday price leg is nearing maturity; anticipate either a minor mean reversion back into the breakout base or a final overshoot into the overhead extension band, followed by a more substantial pause.
Oscillator Insights on Weekly and Daily Timeframes
On the weekly front, the oscillator is rolling over from overbought levels, keeping prices near previous highs. While this in itself does not constitute a sell signal, it does imply that any additional advances will likely become increasingly challenging and volatile. Conversely, the daily oscillator remains robust, exhibiting positive momentum and trending upwards, although already sitting at mid-to-high levels. While there remains potential for one more uptick toward resistance, the risk of a sharp downturn looms larger should market news or flows fail to meet expectations.
Bottom Line: The primary timeframe indicators (weekly/daily) maintain a bullish outlook, while the active swings on the 4-hour and 1-hour charts are showing maturity and extension into resistance. The upcoming trading week will likely focus on navigating this late-stage upswing, either through fading exhaustion at the range's peak or by purchasing on controlled dips into well-defined demand zones.
Market Overview: Key Levels and Dynamics
Trend Boundary Analysis: 6,780 Area
The pivotal threshold for discerning between a healthy pullback and a significant trend reversal lies around the 6,780 mark. A sustained daily close below this level—specifically under S2 and near the last daily higher low—would signal a transition from what appears to be a “healthy pullback in an uptrend” to a more pronounced “daily correction.” In contrast, remaining above 6,780 allows for the interpretation of pullbacks as buyable dips into existing demand. However, should the market close below this threshold with consistent acceptance evidenced by multiple 4-hour closes and significant volume, the prevailing sentiment would shift towards anticipating a larger trading range or an early trend change.
Volatility Metrics Overview
The volatility index (VIX) closed at approximately 16.35 on Friday, a considerable drop from the mid-20s earlier in the month, indicating a low-to-moderate equity volatility regime. The options market appears relaxed rather than panicked. The VIX term structure has returned to contango, with the front month trading cheaper than the back month, supporting a risk-on environment without veering into euphoria. On the treasury front, the MOVE index remains elevated at around 69, having retreated from mid-80s spikes earlier in November, signaling that rate volatility has cooled yet remains high compared to pre-2022 standards.
The recent readings suggest that the fear that overshadowed the mid-month selloff has largely been priced out. Both equity and rate volatility have begun to mean-revert, typically favoring range trading and a more orderly trend rather than severe sell-offs. However, it’s important to note that the current state makes protective measures inexpensive, hinting that abrupt corrections could emerge unexpectedly.
Options Positioning Dynamics
The total put/call ratio is hovering around 0.70 for the latest session, suggesting a slight tilt towards puts relative to longer-term averages. The equity put/call ratio stands at about 0.44, indicating a bullish, call-heavy sentiment among traders, predominantly in single-name options. The 10-day moving average of the put/call ratio is roughly 0.92, slightly below neutral, indicating some short-term complacency, although not excessively stretched.
The SKEW index has stabilized around 143, down from the 160s a year ago but still above the traditional baseline of 120-130. This points to an inclination for tail hedging that is present but not extreme. Given the mid-teen VIX levels and a neutral total put/call ratio combined with a low equity put/call ratio, it is reasonable to deduce that dealers are likely not heavily short gamma at current spots. They may be positioned closer to long or flat gamma within the 6,750-6,900 range, which generally dampens intraday volatility and suggests a tendency toward mean-reversion. Conversely, movement outside this band—specifically above 6,950 or below 6,730—could alter the gamma positioning and pave the way for more significant directional shifts.
Market Breadth and Internal Strength
The S&P 500 concluded the week with a modest 0.5% gain on Friday, reflecting small gains throughout the month, while the Nasdaq faced a 1.5% decline, primarily driven by weakness in large technology stocks. The S&P 500 remains above both its 50-day and 200-day moving averages, having reclaimed the 50-day line last week after an earlier dip, suggesting renewed market participation beyond just a few mega-cap stocks.
Sector performance varied notably, with technology facing headwinds throughout November—most notably from AI-linked companies—while sectors such as energy, consumer cyclicals, and certain areas of healthcare and financials saw positive movements towards month-end. Despite an earlier warning from indicators like the McClellan Oscillator suggesting internal weaknesses, the recent rebound has begun to improve breadth. However, concerns linger that this rally might be more fragile than typical broad-based advances, given its rotational and choppy nature.
Credit and Funding Landscape
The high-yield index (HYG) hovers around 81, near recent highs, indicating generally favorable credit conditions as it has progressively climbed through November. High-yield spreads are tightening relative to recent standards, reinforcing a “risk-on” attitude within credit markets. There are no apparent signs of acute funding stress; previous operational disruptions in futures markets were not indicative of systemic issues.
Currently, credit markets are not signaling alarms. As long as HYG remains above approximately 79, equity dips are more likely to be viewed as buying opportunities rather than triggers for widespread liquidation.
Sentiment and Investor Positioning
In the latest AAII survey, the bull-bear spread stands at around -11%, indicating a modest bearish sentiment, with bears outnumbering bulls by approximately 11 percentage points—below the historical mean of +6%. Conversely, the low equity put/call ratio suggests that traders are actively pursuing upside positions in individual equities.
In summary, while survey data points to cautious investor sentiment, options markets illustrate a preference for call buying and a diminishment of fear. This dichotomy often results in uneven uptrends with the potential for sudden pullbacks when complacency is inevitably challenged.
Global Risk Sentiment and Cross-Asset Overview
In the cryptocurrency sector, Bitcoin has stabilized around 90-91k following a significant correction earlier in the month, with modest recovery observed in the past week. This development underscores a risk-on atmosphere among investors.
Macro and data-calendar context
• The coming week (Dec 1–5) is busy but not as pivotal as the mid-December CPI/Payrolls
• Key events:
• Monday: ISM Manufacturing and construction spending.
• Tuesday: JOLTS job openings.
• Wednesday: ADP employment and ISM Services, plus several PMI and industrial-production figures.
• Thursday: Challenger job cuts, weekly jobless claims, and trade balance.
• Friday: Critically, the delayed PCE and core PCE inflation data for September, pushed back by the recent government shutdown.
• Fed communication: The Fed is effectively entering its pre-meeting quiet period; Powell’s upcoming speech is one of the last major remarks before the December meeting.
Macro narrative: Markets are leaning heavily toward another Fed rate cut in December and a benign inflation path.  Given that, negative surprises in PCE or labor data could trigger a sharp repricing.
The late-November rally appears to be a recalibration of positioning and sentiment following a mid-month scare within the tech sector, rather than a direct response to any significant data shock. This week's major macroeconomic event is Friday's PCE report; other data releases are expected to influence intraday fluctuations rather than alter the overarching trend.
Scenario Analysis and Probabilities
These scenarios represent probabilistic outcomes rather than certainties.
Primary Path — “Controlled Grind with Dip-Buying” (Approximately 50%)
As we enter Monday, expect a modest pullback from Friday's late gains, with overnight Globex trading projected to fluctuate between 6,820 and 6,880. Early in the week, the market may test support levels S1 (6,830–6,840) or potentially S2 (6,790–6,805), ultimately leading to renewed attempts to breach resistance at R1 and possibly R2. By the week’s end, prices are anticipated to oscillate within a broad range of 6,790–6,930 ahead of Friday's PCE announcement, with only temporary moves outside this zone.
Confirmation Criteria: This path will be validated if we observe rejections below the 6,780 level holding firm on a closing basis, accompanied by repeated failures of sellers to maintain downward pressure beneath S2.
Bear-Extension Path — “Deeper Reset Before Year-End” (Approximately 30%)
This scenario is triggered by a failed breakout above R1/R2 early in the week, coupled with a significant intraday reversal and a decisive 4-hour close beneath S2 and potentially S3. Initial price action may feature a spike into the 6,910–6,930 range followed by swift sell-offs, leading to a rapid retreat back through S1 and S2, particularly if the PCE data comes in above expectations or labor statistics surprise on the upside, prompting a re-assessment of potential Fed rate cuts.
Target Area: The initial aim would be the 6,650–6,700 region (near S4), with the possibility of a complete reversal down toward the more robust 6,620–6,650 band.
Confirmation Criteria: Continuous acceptance below approximately 6,730 on a 4-hour basis, combined with a daily close under the 6,780 threshold, would indicate a return to the narrative of a higher low for November.
Bull-Surprise Path — “Breakaway Into New Highs” (Approximately 20%)
This scenario is set in motion by a clear 4-hour and subsequent daily close above R2 and R3, driven by exceptionally benign PCE numbers and a supportive stance from the Federal Reserve. Initial price action should reflect minimal pullback in the early part of the week, steadily climbing past R1 and R2, ultimately resulting in a trend day that aggressively squeezes shorts above the 6,950 mark.
Target Area: The market will likely gravitate toward the extension zone of 7,050–7,100.
Confirmation Criteria: Sustained trading above 6,930 without significant reversals, robust market breadth, and a VIX that remains comfortably anchored in the mid-teens or lower will serve as key indicators for this bullish outlook.
Two A++ setups for the week
A++ Setup 1: Rejection short from R2
Fade spike into 6,910-6,930; Entries, SL, TPs
Entry zone: 6,890–6,900 on the first clean 1-minute pullback after the 5-minute lower high.
Initial stop: Above the rejection high plus a small buffer; planning number ~6,935. That is about 35-45 points of risk if filled near 6,895-6,900; refine to the actual 15-minute wick when it forms.
TP1: 6,830-6,840 (S1 / breakout base). From a 6,895 entry, that is roughly 55–65 points, giving at least 1.3-1.5R with the conservative stop and significantly more if the wick is tighter.
TP2: 6,790-6,805 (S2 demand pocket).
TP3 (runner): 6,730-6,750 (S3), only if tape is heavy (e.g., PCE or data shock).
A++ Setup 2: Continuation long from S2
ES Long (A++) - Buy reclaim of 6,790–6,805; Entries, SL, TPs
Entry zone: 6,805-6,815 on the first 1-minute higher-low after the 5-minute confirmation.
Initial stop: A few points below the spike low; planning number ~6,780, which gives about 25–35 points of risk.
TP1: 6,870-6,885 (R1 / prior week high band). From a 6,810 entry, that is roughly 60–75 points, delivering comfortably more than 2R with the planned stop.
TP2: 6,910-6,930 (R2 extension band).
TP3 (runner): 6,950-6,980 (R3 / upper weekly supply) if PCE and flows are supportive.
Good Luck !!!
Potential EU BuysThe current 15M price action is bullish. I would look for lower timeframe confirmation once price sweeps the trendline liquidity, and taps the 15M supply zone. I would then expect price to take out the swing high. If price takes out the swing high before pulling back to our zone, the trade would be invalidated.
Trade Safe -Remzy

Gold Bulls Triumph — Watch Resistance Near 4250 IntradayBoosted by weekend geopolitical tensions, gold opened higher today, although the upside has been relatively limited. In terms of data, the key economic releases are concentrated from Wednesday to Friday, while today and tomorrow will be driven mainly by sentiment. Market focus should remain on the progress of the Russia–Ukraine peace talks. If negotiations move smoothly, it could temporarily suppress bullish momentum in gold, though rising rate-cut expectations may offset part of the impact. Ultimately, this week’s direction still depends on Wednesday’s data and the major releases that follow.
Technically, the daily chart continues to show a bullish structure. However, as prices approach the 4250 level, selling pressure is likely to increase. Without significant news catalysts, gold may continue to consolidate within the 4170–4250 range, waiting for data-driven momentum to break out.
For intraday levels, key support lies in the 4186–4178 zone, while resistance sits at 4240–4258. If gold directly surges into the 4250–4260 region, pay attention to the 4216–4208 support zone during any pullback triggered by profit-taking.
Overall, the trading approach remains unchanged — buy on dips continues to be the primary strategy.

ETH 2,422.84 — price not yet reached at time of publication 🏷 Capital Sector. Price Slice.
🏷 December 1, 2025
🏷 ETH 2,422.84 — price not yet reached at time of publication
🏷 BPC 10
🏷 Screenshot:
Time has split space—and revealed a price slice where capital has already affixed its seal.
This level is not a guess. Not a probability. It is a Covenant —a binding commitment inscribed by institutional flows.
ETH 2,422.84 —a coordinate embedded in the market’s architecture long before its visual manifestation.
While the masses search for signals, the sectors remain silent… yet already in motion.
— The Architect
🏷 Interactive Reference Guide: BPC — The Bolzen Price Covenant

Gold/Silver Ratio - Monthly Close on Bear FlagExpect higher moves in Silver as it hits new ATHs, i expect gold to have a sympathy rally alongside Silver, however the break in the gold/silver ratio to the downside (silver outperforms) would signal a higher % move in Silver to follow.

Is USD starting to turn around?Hello traders
We are 9 trading days away from the FOMC rate decision.
The probability of a rate cut is at 87% according to the CME FedWatch tool.
Since this cut is well priced into the market, the unknown is the FOMC dot plot.
There is uncertainty about the US labor market and inflation because of the Government shutdown.
I am highlighting only price action in this idea. I have purposely chosen a short time frame to finalize my decision within the next couple of hours.
The prudent action will be to wait for the 3 hour candles to close.
It is also month end, so there will be more volume traded.
Please do your own research.
Best of luck

GOLD 4HSHORT
Price is pressing into a broad resistance shelf after forming a rounded top and is already reacting lower from that area; a short near the current level with risk parked above the prior swing high targets the highlighted downside objectives within the existing corrective structure.
Chart Sentiment Analysis
Market Structure & Price Action
The chart is displaying a series of higher highs and higher lows, indicating strong bullish market structure. This price action suggests that buyers are in control, with each pullback finding support at progressively higher levels. The ascending pattern of peaks and troughs demonstrates sustained buying pressure and institutional accumulation.
📈 Future Price Movement Implications:
The reversal pattern appearing after an uptrend suggests potential exhaustion of buying pressure. While the overall structure remains bullish, this pattern warns of possible trend weakness. A break below key support levels could confirm a shift from higher highs/lows to lower highs/lows, signaling a structural change in market sentiment.
Technical Sentiment Overview
The analysis shows moderate-to-strong technical conviction with 78% confidence. The chart displays recognizable pattern characteristics with Weakening momentum tendencies. While the setup has merit, traders should remain alert to potential false signals and manage risk accordingly. The technical picture suggests directional bias but may require confirmation from additional price action.
Chart Status
Trend Uptrend
Momentum Weakening
Volume Average
Key Observations
The prior impulsive climb has stalled into a wide supply band with price curving over rather than accelerating higher.
Projected pathing on the chart anticipates a series of lower lows and lower highs, suggesting sellers are expected to take control after this distribution phase.
Entry Zone Analysis
✅ OPTIMAL ENTRY ZONE
Current candles are trading inside a pre-marked resistance zone with clear invalidation just above the recent peak, giving a defined stop while downside room extends to multiple mapped support targets.
Risk Factors:
•
Primary trend on this timeframe is still up, so any downside move may be corrective rather than a full reversal.
•
A decisive breakout and sustained hold above the resistance band would negate the short thesis and could trigger a squeeze.
Entry, Stop Loss & Take Profit
Entry Point
4,224.830
Stop Loss
4,318.131
AI-calculated based on chart structure
Take Profit 1
4,131.53
1:1 RR • Win 5.0/10 to break even
Take Profit 2
4,038.23
1:2 RR • Win 3.3/10 to break even
Take Profit 3
3,944.93
1:3 RR • Win 2.5/10 to break even
Take Profit 4
3,851.63
1:4 RR • Win 2.0/10 to break even
Educational Notes
•
Rounded tops often emerge after extended advances when buyers gradually lose enthusiasm; price transitions from strong higher highs to a more horizontal, choppy structure before rolling over.
•
When shorting into resistance, aligning stop loss just beyond the prior swing extreme provides structure-based risk control while allowing normal intraday noise inside the zon

Natural Gas - New 52 Week High? Natural Gas appears to be setting up another bullish move this week.
A sweep of its 52 week high seems very likely.
If this sweep of the massive March 2025 high pivot occurs there is a very high probable day trade short scalp opportunity.
I'm watching the next inventory report on Thursday very closely.

