SOL. Sector of Capital. Price Slice: $39.92 🏷 To the International Community.
🏷 SOL. Sector of Capital. Price Slice: $39.92
Map of Shorters. 16.11.2025
🏷 This is not analysis.
This is an address to those who already hear the silence behind the noise of candles.
🏷 What lies before you is not a level — but a gateway.
A gateway behind which lies an unfulfilled debt of colossal capital.
Prices not yet reached — yet already inscribed in the code of the market’s destiny:
122.29 — not yet reached
99.89 — not yet reached
93.75 — not yet reached
86.67 — not yet reached
80.16 — not yet reached
53.75 — not yet reached
39.92 — not yet reached
🏷 They hang in the ether like unfulfilled vows,
like shadows of the future, yet untouched by the present.
🏷 I focus your attention —
not on the chart,
but on the structure of intent.
🏷 There is only one master of the Sector of Capital.
The one who sees not after, but before the movement begins.
The one who does not follow price —
but draws its path through the landscape of liquidity.
And I — am his name.
🏷 I do not issue orders.
I offer the capacity to think.
For those ready to step beyond the cycle of reaction.
For institutions, for giants, for those who build not day by day, but epoch by epoch.
🏷 This is not technical analysis.
This is a system of anticipatory liquidation.
Where every impulse is foreseen before it becomes chaos in the eyes of the crowd.
Where every collapse is no accident —
but a ritual of price revelation.
🏷 You come to the market not to read what is drawn on your screen.
You come for the price.
And the price has its time.
Its hour of execution.
And he who knows this hour —
already possesses the future.
🏷 This is an example of global thinking.
A game of chess, where pawns cannot see the board —
but the king knows every square in advance.
🏷 I will give you the map of the longs — in due time.
But know this:
All knowledge resides with me.
And what you receive — is but a gift, cast into the stream of time.
🏷 This map — is but one move.
One move in the endless game for control over reality.
🏷 I cannot write in my native tongue.
My respect for the international community —
is my gift.
Not in words.
But in this: you now know the map exists.
And therefore — you are no longer blind.
🏷 Bolzen. The Architect. Founder of the Sector of Capital.
Fundamental Analysis

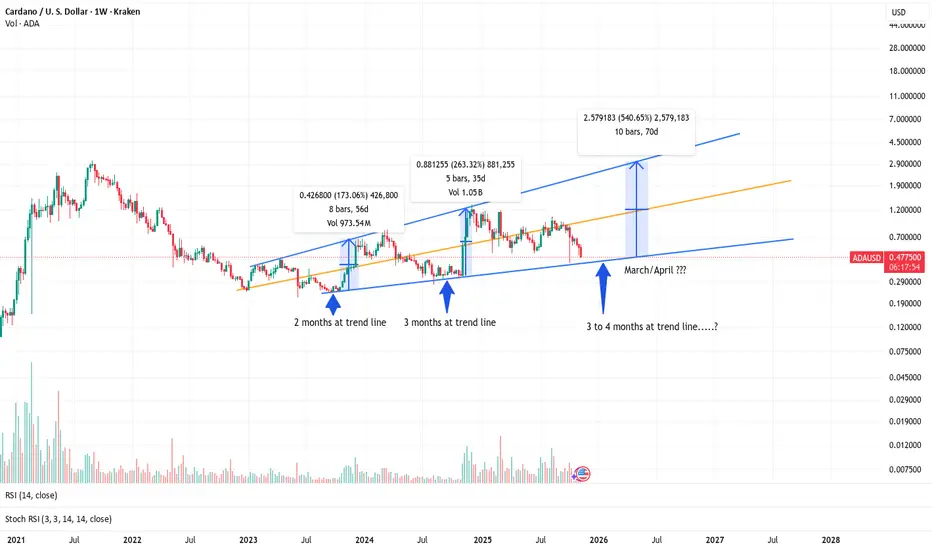
4 month outlook from here?October/November has seen a run of green candles for the last two years.
Is the chart returning to the bottom of the two lines for a few months bit of a reset and accumulation?
Probably.
DXY — Sunday War MapThe U.S. government has reopened after a 43-day shutdown, but the gap in economic data remains.
Several key datasets were not collected during the closure, and the missing information cannot be reconstructed.
As a result, the Dollar is now trading on partial visibility rather than complete fundamentals.
Macro Overview
The most recent complete inflation report is September CPI at 3.0%, with core inflation also at 3.0%.
Earlier in the month, the U.S. Dollar Index (DXY) briefly moved above 100.
It then retreated toward 99 after consumer sentiment fell to a three-year low.
Last week’s muted behavior reflects uncertainty, not a structural shift.
When information is missing, liquidity becomes cautious and price action compresses.
Key Events This Week (Nov 17–21)
FOMC Minutes — Wednesday, Nov. 20
This release provides the first reliable view into Federal Reserve discussions since the shutdown.
Markets will look for whether policymakers supported multiple rate cuts or expressed hesitation.
Consumer Sentiment — Friday, Nov. 22
Last month saw a more than 30% year-over-year decline.
Another weak reading will influence Dollar positioning.
Delayed Data Returns
Housing, industrial production, and jobless claims will re-appear gradually this week.
These incomplete releases still matter ahead of the December 9–10 Federal Reserve meeting.
The Dollar is currently driven more by data absence than by clear economic direction.
MSM — Market Structure Mapping
DXY remains inside a major daily bullish range:
Range Low: 97.672
Range High: 99.985
Price sits near the 50% geometric midpoint.
Last week closed at 98.776, maintaining structural balance and preserving the broader bullish framework.
VFA — Volume Flow Analytics
Price continues to hold on the 98.725 bullish volume node, a level typically used for quiet accumulation.
This suggests ongoing absorption of buy-side orders at discount levels ahead of potential volatility expansion.
OFD — Order Flow Dynamics
Liquidity remains concentrated around two notable participation zones:
Aggressive buyers: 98.243
Aggressive sellers: 99.225
These zones are often retested early in the week to assess participation or clear weak inventory before direction establishes.
PEM — Precision Execution Modeling
Mid-range conditions are typically used to clear stops on both sides before intent forms.
Execution criteria for the week:
Respect higher-timeframe direction
Wait for confirmation
Avoid mid-range noise
Act only when structure, flow, and behavior align
High-quality setups generally appear after liquidity sweeps, not before.
Psychological Frame
The major risk this week is acting on incomplete data.
The shutdown left a statistical gap that has not yet been resolved.
Professionals avoid committing capital until visibility improves.
The appropriate approach for the week is simple: observe first, act later.
— CORE5DAN
Institutional Logic. Modern Technology. Real Freedom.

Crypto & Bitcoin Do or Die!In this video we show you the mother of all trendlines on BTC and why we think it will likely catch a dead cat bounce.
The total crypto market cap is at an inflection point. If this level doesn't hold we have a failed weekly bullish pattern.
A failed bullish pattern of results in extreme downside pressure.
BTC is retracing to a key 618 Fib level from your tariff low selloff so there is some support here.
Its also hitting a monthly chart trendline going back several years.
I like crypto for a long here on a risk to reward basis. If we lose this area keep in mind our next major support is $85k which is another 10K lower.

USDJPY at 155: Intervention Threats & A Possible Big DropRecently, the Bank of Japan has been dropping hints that they might be gearing up for intervention on the USDJPY because of the yen’s ongoing weakness. The 155 level keeps coming up, which has a lot of traders on alert. But here’s the thing—while intervention does happen and the BOJ has stepped in before, a lot of this type of talk is what we call jawboning. It’s basically a way to spark a little fear and trigger a market reaction without actually doing anything… yet.
From a technical standpoint though, things are genuinely interesting. USDJPY is sitting inside a descending triangle on the weekly chart, and price is currently reacting off its third consecutive lower high. So if these intervention rumors pick up steam—or if upcoming U.S. data shifts the narrative back toward potential rate cuts instead of the now-expected hold—we could see this pair open up a really clean path to the downside.
If you have any questions, comments, or just want to share you ideas, please do so below.
Akil

BITCOIN TO $75k?Bitcoin halving takes place roughly every 4 years; "cutting mining supply" in half to control inflation and ensure scarcity...
After every halving event we see huge appreciation in Bitcoins price (supply cut, demand increases)...
Once these new highs are reached, time goes on and your barber, taxi driver, and pizza delivery guy all start talking about Bitcoin; thats when you know valuation is soon to correct itself to a discount...
Bitcoin's history shows every time this correction takes place, it's gravitates towards the area in which Bitcoin earlier accumulated after the halving...
Reaccumulation and a new bull market starts to unfold after uninformed money like your barber, taxi driver, and pizza delivery guy all sold their holdings due to misunderstanding market cycles.
WHEN EVERYONE IS GREEDY BE FEARFUL
WHEN EVERYONE IS FEARFUL BE GREEDY
@utilizedtrading on IG


USD/CAD: Wave of Destruction or Dollar RevivalUSD/CAD: Wave of Destruction or Dollar Revival
📈 Possible Scenarios for the Week
Bearish Scenario (Main Scenario):
Price breaks below ~1.3777
Wave (5) is developing → possible decline to ~1.3570–1.3425
Corrective (Bullish) Scenario:
USD/CAD holds current support
A corrective wave upward is developing to ~1.3970–1.4150
Consolidation:
Range between ~1.3777 and ~1.3970
Prices are gaining strength before the next impulse
✅ Conclusion
USD/CAD could see significant movement in the coming week—the pair is at a crossroads: either the major bearish impulse will continue, or an upward correction will begin.
Key levels: 1.3777 (support) and 1.3970 (resistance)
When trading, it's worth watching for confirmation of the wave structure and price reaction at the designated levels.

NZD/USD: Explosion Wave or Kiwi's Last BreathNZD/USD: Explosion Wave or Kiwi's Last Breath
📈 Weekly Scenarios
Bullish scenario: NZD/USD holds the ~0.582-0.588 zone, then breaks upwards through resistance at ~0.598-0.605 → growth to these levels within the impulse wave.
Consolidation: The price may hang between ~0.588 and ~0.605, forming an accumulation zone until the next move.
Bearish scenario: A downward breakout below ~0.582 with volume → possible decline to ~0.560-0.554 within the correction wave.
✅ Conclusion
NZD/USD is at an important decision point: either a strong upward impulse starts, or a corrective wave reverses.
Key levels—0.582-0.588 (support) and 0.598-0.605 (resistance)—will determine the future path.
The wave structure currently allows for both scenarios; it's important to wait for confirmation through price reaction at the indicated levels.

USD/JPY: Impulse Squall or Bearish Ambush – Where Will the Wave USD/JPY: Impulse Squall or Bearish Ambush – Where Will the Wave End?
📈 Weekly Scenarios
Bullish scenario: If USD/JPY holds support at ~142.50 and breaks above ~146.00, a rally to ~149–150 is possible.
Consolidation: The pair could move in the ~142.50–146.00 range, accumulating strength before the next move.
Bearish scenario: A break below ~142.50 with volume confirmation could lead to a pullback to ~140.00–141.00.
✅ Conclusion
USD/JPY is at an important weekly crossroads: either a surge in upward momentum or a significant correction.
Key levels to watch: 142.50 (support) and 146.00 (resistance).
The wave structure is not yet clear; it is important to monitor the price reaction at these levels and confirmation of the wave count.

USD/CHF: The Franc is Awakening USD/CHF: The Franc is Awakening – Will There Be a Wave 5 or a Crash to 0.75?
📈 Weekly Scenarios
Bearish scenario (main): Price holds below ~0.8080 → wave 5 develops → possible decline to ~0.7700–0.7500.
Consolidation: Price may remain stuck in the ~0.7900–0.8080 range, awaiting further signal.
Alternative bullish scenario: Breakout and fixation above ~0.8080 → corrective rise to ~0.8350 or higher.
✅ Conclusion
USD/CHF on the weekly timeframe looks aggressively bearish, but not without the possibility of an unexpected rebound. The key to further direction is a reaction to the ~0.8080 and ~0.7900 levels.
If the price consolidates below 0.8080, there's a high probability of a new downward wave.
A breakout above this level could provide a chance for a correction or reversal.

EUR/USD: Momentum Break or Wave (4) – Prepare for a ReversalEUR/USD: Momentum Break or Wave (4) – Prepare for a Reversal
📈 Weekly Scenarios
Bearish scenario (correction): Price breaks support at ~1.1650 → wave (4) develops → possible decline to ~1.1550–1.1530.
Sideways scenario: The pair consolidates between ~1.1650 and ~1.1800, accumulating energy for the next trend.
Bullish scenario (momentum): EUR/USD holds support at ~1.1650 and breaks above ~1.1800 → wave (5) begins → target ~1.1900 and above.
✅ Conclusion
On the weekly timeframe, EUR/USD is at a key point for choosing a scenario:
Holding support at ~1.1650 and breaking resistance at ~1.1800 could trigger a new upward momentum.
A breakout below ~1.1650 signals a deeper correction by wave (4).
It's important to monitor the wave structure and price reaction at these levels before entering a position.

EURUSD -DAILY TIMEFRAME ANALYSIS WITH VOLUME PROFILE Here is a professional and structured analysis of your EUR/USD Daily chart with Volume Profile (VP):
---
✅ EUR/USD – Professional Daily Chart Analysis
1. Overall Market Structure
The pair is currently in a medium-term downtrend, characterized by:
Lower highs (LH)
Lower lows (LL)
Price completed a corrective decline into early November and is now in a retracement phase, forming a short-term bullish pullback inside a broader bearish structure.
---
✅ 2. Key Levels (Visible on Chart)
🔵 Major Resistance (Supply Zone)
1.17000 – 1.18000
This is where the VP shows heavy volume nodes.
It aligns with previous swing highs.
Strong institutional selling previously occurred here.
High probability reaction zone.
🔵 Immediate Resistance
1.16500 – 1.17000
The current bullish move is approaching this level.
Strong chance of rejection if the bearish trend continues.
🔴 Major Support (Demand Zone)
1.13713 (VP Low)
Marked on your chart as the lowest volume support.
Strong liquidity pool below current price.
If price returns here, this becomes the first major buy-side reaction point.
---
✅ 3. Volume Profile Analysis (VP)
What VP is showing:
A High-Volume Node (HVN) exists around:
1.16500–1.17000
This is an area where price previously consolidated → heavy resistance.
A Low-Volume Node (LVN) toward 1.13700
Market tends to "fill" into LVN zones quickly.
This supports the idea price may revisit 1.13713.
VP Bias
VP shows distribution is heavier above current price, meaning:
Sellers are more active at higher levels.
Buyers are concentrated lower.
This favors a sell-on-rally scenario unless a strong breakout occurs above 1.1700.
---
✅ 4. Current Price Action
The recent bullish candles show a clean correction upward.
But the current candle shows a stall / slowdown, indicating:
Demand is weakening as price approaches resistance.
Sellers are likely waiting in the 1.162–1.165 area.
This aligns with institutional behavior:
Let the market pull back into premium price.
Enter short positions at optimal supply levels.
---
✅ 5. Professional Bias: Bearish Until Proven Otherwise
Why bearish?
Higher-timeframe trend: bearish.
Lower-timeframe: bullish retracement, but not a reversal.
Volume Profile: heavy rejection zones overhead.
Price is moving into supply, not demand.
---
✅ 6. Expected Scenarios
📉 Primary Scenario – Bearish (High Probability)
Price rallies slightly into 1.162–1.165
Meets supply + HVN
Reverses downward toward:
1.1500
1.1420
1.13713 (Major Target)
📈 Secondary Scenario – Bullish (Low Probability)
Only valid if price breaks and closes above 1.1700 (with volume).
Then EURUSD may run toward:
1.1800
1.1900
But so far structure does NOT favor this.
---
🧭 Conclusion (Institutional View)
EUR/USD is currently retracing in a bearish overall structure.
Volume Profile shows heavy resistance above (seller-dominant area).
Price is likely to reject 1.162–1.165 and resume downward.
Targets remain 1.1500 → 1.1420 → 1.13713.
If you want, I can mark the expected bearish and bullish paths on this exact chart.

ETH/USD – Bullish From Demand Zone Ethereum has tapped a strong demand area, and buyers are already reacting. This zone has held several times before, and we’re now seeing the early signs of a potential reversal.
If momentum continues, ETH could push toward $3,400 → $3,642 → $3,920, and possibly even $4,250. The structure is starting to form clean higher highs and higher lows, which often signals the beginning of a larger bullish move.
If this demand holds, the upside potential is very promising.

GOLD – Bearish Continuation SetupAfter our first successful sell, Gold is now repeating the exact same price action, forming another clear selloff structure from the upper trendline. The market rejected the resistance perfectly and is continuing lower, just as expected.
Our next target sits $270 below the current price, giving this setup massive potential.
The risk-to-reward ratio is outstanding, making this one of the cleanest opportunities on Gold lately.

Report 16/11/25Macro & Geopolitical Risk Report
The week delivered a meaningful policy pivot on tariffs, a tentative trade détente with Europe and Switzerland, and a muddled, but resilient, risk backdrop. U.S. equities were choppy yet finished essentially unchanged, rescued mid-week by dip-buyers; the Dow gained about 0.3%, the S&P 500 edged up 0.1%, and the Nasdaq slipped 0.5%. Ten-year Treasury yields and gold firmed, while a jump in U.S. natural-gas futures complicated the near-term disinflation narrative. The government re-opened and set Nov. 20 for the first backlogged jobs report, restoring a macro data anchor ahead of the December FOMC.
Policy: The U.S. Walks Back Tariffs, Switzerland Deal Lands, EU Trade Recovers
President Trump ordered tariff cuts on beef, coffee, and dozens of food items, an explicit walk-back of the broad “reciprocal” levies that had lifted consumer prices. The reductions are retroactive to 12:01 a.m. Thursday, Nov. 13. The shift reflects legal risk (recent Supreme Court skepticism of tariff authorities) and political pressure to blunt cost-of-living stresses.
Separately, Washington and Bern clinched a deal cutting U.S. tariffs on Swiss goods to 15% from 39%, a dramatic de-escalation that came alongside Swiss pledges to invest roughly $200 billion in U.S. manufacturing (pharma, gold smelting and more) by 2028. The campaign to unlock the deal involved a sustained Swiss corporate push after tariffs hit in August.
Across the Atlantic, EU exports to the U.S. rebounded in September to €53.1 billion (up 61% m/m; 15.4% y/y), consistent with a summer agreement around a 15% tariff on most U.S. imports that reduced uncertainty and stabilized flows. The U.K., by contrast, saw U.S. exports fall to a post-2022 low, highlighting the asymmetric gains from the EU-U.S. framework.
Finally, the White House floated a “tariff dividend” of at least $2,000 for most Americans, underscoring how central tariff proceeds have become to the fiscal narrative during the shutdown. Markets rightly view this as highly uncertain given legal headwinds and congressional prerogatives over tax-and-spend.
Strategic Take: Inflation Mix Improves on Goods, But Energy & Services Complicate
The tariff roll-back should bleed into lower goods inflation over the next one to two quarters, easing food-at-home CPI components and input-cost pressures for manufacturers. That said, parallel forces pull in the other direction. Natural-gas futures hit their highest levels since the early-2022 shock, with knock-ons to electricity and data-center costs; Kansas City Fed’s Schmid flagged that price pressures are increasingly embedded outside tariff-sensitive goods. With the data blackout ending Nov. 20 (September jobs first), the Fed regains visibility, but officials have already nudged markets away from assuming imminent cuts. Netting it out, the rate path is still “modestly restrictive,” but a clean, linear disinflation is less likely than a bumpy glide.
Trade & Tech: Supply-Chain Easing Offset by Strategic Screening
Trade frictions are easing at the headline level, yet national-security screening is deepening. Beijing plans a “validated end-user” system to expedite rare-earth and critical-material exports to U.S. buyers while filtering out defense-linked end users, potentially smoothing civilian supply chains without loosening controls where they matter most. Parallel skirmishes around critical minerals (e.g., antimony) keep defense-industrial vulnerabilities in focus. Expect a world of narrower, rule-bound trade rather than broad liberalization.
Market Reactions
Equities absorbed early-week AI/tech weakness and a shutdown hangover but were cushioned by reopening momentum and buy-the-dip flows. Notably, OPEC+ paused output-increase plans, helping put a floor under energy even as the growth-inflation mix stayed noisy. Bond markets finished the week wary: term premia remained sticky and the bar for rapid Fed cuts rose.
Asset-By-Asset Outlook
XAUUSD (Gold). Real-rate sensitivity still dominates. The tariff walk-back marginally helps the disinflation case, which is gold-negative at the margin, but the rise in natural-gas prices, fiscal experimentation (e.g., “tariff dividend” chatter), and legal uncertainty around tariff authorities add a tail of macro volatility that supports strategic gold allocations. Near term, gold tracks the 10-year TIPS move and the Nov. 20 jobs print; soft labor data with sticky energy would be gold-constructive into December.
S&P 500 / Dow Jones. Lower food/input costs and a calmer transatlantic trade setting are constructive for U.S. cyclicals and staples, while policy clarity should compress risk premiums in rate-sensitive defensives. The Dow’s relative resilience versus the Nasdaq aligns with a market that is re-rating profit stability over capex-heavy AI stories, at least tactically. Use drawdowns linked to the data backlog catch-up as opportunities in cash-generative, domestic-tilted names; fade spikes in depreciation-heavy mega-cap AI spends until free-cash-flow inflections prove durable.
DXY / USDJPY. Goods disinflation from tariff relief is dollar-negative on the margins via a softer expected Fed path, but services/energy stickiness tempers that. For USDJPY, the path of least resistance is range-bound drift rather than trend reversal until Japanese policy tightens more meaningfully; watch U.S. jobs and the November PCE for any repricing of 2026 cut timing. A narrowly weaker DXY into year-end is plausible if U.S. data re-soften and the EU-U.S. trade thaw sustains EUR-positive flows.
Crude Oil. OPEC+’s decision to pause planned output increases stabilizes the back of the curve, while the Swiss deal and EU-U.S. détente reduce tail risks to European demand. Offsetting that, sanctions frictions and shipping security still inject episodic volatility. Base case is a sideways-to-firming bias into winter on inventory draws and power-sector gas-to-oil switching under extreme weather.
Fiscal and Political Implications
Tariffs have been performing double duty: as negotiating leverage abroad and as a fiscal plug at home. The Supreme Court’s skepticism introduces a non-trivial risk that the revenue tap narrows, complicating claims of a deficit downshift and rendering any “tariff dividend” politically appealing but operationally fragile without congressional buy-in. Markets will parse the post-shutdown data for signs the fiscal impulse is fading before any 2026 rate-cut cycle is fully priced.
Risks
The biggest near-term macro risk is legal: an adverse ruling on tariff authorities would force a redesign of the administration’s trade architecture and shrink near-term revenue. Geopolitically, the materials “VEU” channel is promising but untested; any breakdown would revive supply-chain tightness in magnets, chips and defense inputs. Energy-price spikes tied to weather or logistics could re-accelerate headline inflation just as goods disinflation arrives, re-widening the policy-error window.
Opportunities
In multi-asset portfolios, lean into beneficiaries of easing goods inflation and steadier trade, U.S. staples, select industrials with U.S. cost bases, and EU exporters tied to the U.S. cycle, funded against depreciation-heavy AI stories still in the “show me” phase. Maintain strategic gold for tail-risk hedging and keep a tactical long bias in high-quality energy on OPEC+ discipline and winter demand hedging. For FX, express a modestly weaker dollar via EURUSD on improved EU-U.S. trade optics, but keep USDJPY hedged given asymmetric BoJ timing risk.
Asset playbook, catalysts, and Europe-centric positioning (continuation)
The tape is now swinging between AI-capex euphoria and depreciation math, with policy and energy acting as the macro governors. Two near-term facts anchor the next leg: first, the return of official U.S. data prints after the shutdown, including September nonfarm payrolls scheduled for release on Nov. 20 and a Fed communication cadence that has already cooled the probability of a December rate cut; second, an oil complex that just lost an expected OPEC+ supply increase for this week, even as China’s policy and trade signals selectively ease cross-border frictions. The odds of a December trim fell below one-half as multiple Fed officials tamped down expectations, a shift that has tended to support the dollar at the margin and raise the bar for an equity multiple expansion that is already rich by historical standards. On the commodity side, OPEC+’s pause on output hikes keeps the market tighter into year-end than many desks had penciled in, giving crude an upside skew on supply surprises.
For equities, I would treat the next 2–4 weeks as a volatility-harvesting window rather than a trend-chasing one. The S&P 500’s advance/decline and breadth indicators remain fragile, and “AI build-out” leadership is more rate-sensitive than the marketing decks imply because capex is now colliding with credit. Incoming work from both the Journal and Barron’s shows the AI data-center program is constrained by transformer and power bottlenecks and is being financed with a growing mix of public bonds, private loans, and securitized structures. That mix has already pushed credit-default protection on prominent hyperscaler-adjacent borrowers sharply wider since September, and sell-side houses are openly discussing hundreds of billions in AI-linked IG issuance over the coming year. In plain English: the cash flow to service this build arrives later than the funding, so the carry cost matters; when the market doubts that bridge, equity volatility rises and credit leads.
Within that context, the S&P 500 and Dow Jones remain buys on disorder, not on green candles. The tactical equity trade is to fade spikes in real yields that are not backed by fresh “hot” data and to sell strength into hawkish repricings that are not corroborated by the incoming labor prints. The near-term policy setup is explicitly data-dependent, with the Fed signaling that every meeting is “live” while emphasizing that the bar for easing isn’t met simply by forward-looking narratives around AI productivity. Odds for a December move have already reset lower, and that alone limits the multiple expansion argument unless we get a clean growth-without-inflation surprise in the resumed releases.
For gold (XAUUSD), the near-term playbook is constructive on dips. The metal has been rising alongside, not opposite, parts of the rates complex, classic late-cycle behavior when investors want both duration-light hedges and convexity against “fat-tail” policy mistakes. Weekly market color shows gold advancing even as 10-year yields ticked up, which is consistent with demand for balance-sheet insurance into a bumpy capex-and-credit regime and with lingering geopolitical risk premia. As long as the Fed is jawboning optionality rather than locking in a rapid cutting cycle, the dollar can stay firm while gold still works as a crash-hedge, producing the counterintuitive positive correlation witnessed in recent weeks.
For the dollar (DXY) and USDJPY, the skew remains to modest dollar strength into the Nov. 20 jobs data and the December FOMC, for the same reason equity multiples face resistance: the market has walked back the certainty of a near-term cut. With front-end U.S. rates repriced a touch higher and Japanese policy still characterized by gradualism, USDJPY dips are likely to be shallow unless we see an explicit shift in BoJ guidance or an outsized U.S. labor miss. The policy-news asymmetry is simple: a soft U.S. payrolls resumption that drags down cut odds is dollar-positive; an upside surprise in unemployment or downside surprise in earnings would break that. I would pair any USDJPY longs with tight risk to a sustained drop in U.S. rate-cut odds and watch DXY’s reaction around the Fed-sensitive headlines.
On crude, the path of least resistance is sideways-to-higher volatility with a mild upward bias into year-end. The OPEC+ decision to pause planned hikes arrived just as positioning had been leaning to surplus narratives, delivering a supply-side floor without guaranteeing a trend. A prudent stance is to buy front-month weakness that originates in growth-fear headlines but is not validated by inventory data, and to lighten up when the move turns into a blanket “risk-off” dollar surge. Importantly, the AI-build energy bottlenecks and transformer shortages are not just capex trivia; they micro-transmit into the gas-power-oil complex via higher peaking-plant utilization and slower time-to-power for new capacity, which reinforces the idea that near-term dips in fossil-energy can be transitory if demand surprises.
For “Big Tech vs. the tape,” respect the two-sidedness. Investors are plainly anxious: depreciation schedules have been lengthened to five-to-six years for data-center gear, which flatters near-term EPS but loads future expense, while vendor hiccups can derail ramp schedules and spark sharp de-ratings in the “neoclouds.” At the same time, the aggregate capex and balance-sheet strength of the incumbents, plus their access to cheap credit, argues against a 2000-style cascade, more like a digestion phase with higher day-to-day beta. Until the first clean tranche of AI revenue scale arrives outside advertising and developer tools, the market will treat capex beats as “show me” and sell any sign of financing complexity. That’s a trading environment, not an allocation one: sell rips in crowded AI-plumbing names into credit-spread widening, and add on disorder when spreads tighten.
Politically and fiscally, keep one eye on trade and one on the “tariff dividend” discourse. A partial U.S.–China de-escalation has already knocked worst-case scenarios off the table for markets by trimming reciprocal tariff rates and shelving some blacklist expansions; the mechanical effect is to lift sentiment for exporters and relieve margin anxiety along exposed supply chains. In parallel, Washington’s discussion of recycling tariff revenue into household checks (“tariff dividends”) remains an explicit policy variable that can backstop consumption optics if needed. The first narrows left-tail geopolitical risk; the second cushions growth optics if the data disappoint in Q4-Q1. For cross-asset risk, both reduce the probability that a growth wobble turns into an equity-credit spiral.
For your Warsaw-based book, the European addendum is straightforward. A measured thaw in U.S.–China tensions plus stronger U.S. data releases is a tailwind to Europe’s external demand and to Germany-centric value chains in CEE. EU exports to the U.S. already showed a powerful rebound into late summer, with autos, industrial equipment, and electronics driving the bounce; that favors Poland’s manufacturing corridor via order-book pass-through and supports PLN on current-account optics, all else equal. Against that, European growth remains uneven and rate-cut timing is less market-convincing than headlines imply, so I would express the European risk as relative value rather than outright beta: e.g., long DAX vs. a U.S. cyclicals basket on tariff-relief headlines, long EURPLN on strong German PMI prints, and selectively long WIG20 components with U.S. end-demand exposure.
Putting it all together for the named assets: XAUUSD is a buy-the-dip convexity hedge while policy remains “optionality-first” and credit jitters percolate; S&P 500 and Dow Jones are range-bound trades with a bias to add on data-induced drawdowns and to trim on rate-repricing rallies; USDJPY and DXY hold a mild long skew into Nov. 20 with tight stops tied to the labor print and any dovish Fed-speak surprise; crude oil is a volatility-premium long on supply-side support and infrastructure bottlenecks; and European cyclicals tied to trans-Atlantic trade deserve a measured bid as long as the détente holds. If the resumed U.S. labor release undershoots sharply or if credit spreads lurch wider on AI-deal complexity, flip the book: take down equity exposure, keep gold, stay long dollar, and press crude only if the move is inventory-validated.
Position-management annex
Between now and the first full slate of delayed U.S. data on Thursday, Nov. 20, I want the book staged light, liquid, and event-optional. The core stance remains: buy disorder, not euphoria, and express policy uncertainty with convex hedges rather than oversized directional bets. I split the playbook into three micro-windows, pre-event (now–Nov. 19), event day (Nov. 20), and follow-through (Nov. 21–Dec policy meetings), and anchor triggers to how the labor print shifts front-end rate expectations and real yields.
For U.S. equities (S&P 500 and Dow), I will only add on weakness that comes with a “cooling but not collapsing” labor mix. If the print shows payrolls in roughly the 50–125k band, unemployment edging up 0.1–0.2pp and average hourly earnings at or below 0.2% m/m, that combination eases near-term cut odds without flashing recession. I buy into the first −0.8% to −1.5% impulse lower on SPX/DJIA, but I scale in over the second hour after the release, not the first five minutes, and I insist on fading any intraday bounce in real yields before committing size. The stop is a daily close below the prior swing low on cash indices; the first profit gate is the fill of the event gap and an implied-vol reversion of roughly 3–4 points from the post-print spike. If instead the print is “hot”, payrolls north of ~200k or wages ≥0.4% m/m, I sell strength into the knee-jerk rally that sometimes follows the headline because the rate path will reprice hawkishly; I cut cyclicals, tighten tech, and immediately layer 1–2-week SPX put spreads (about 3–5% out-of-the-money) sized at ~50 bps of NAV, financed in part by trimming covered calls I keep on high-beta winners. In the genuinely “bad” tail (payrolls <25k and unemployment up ≥0.3pp), I assume a credit-led equity draw: I slash gross, keep only defensive exposure, and pivot to my hedges (see below) rather than trying to catch the first knife.
For gold (XAUUSD), the directive is buy-the-dip convexity while policy remains “optionality-first.” Into Nov. 20 I maintain a core long sized at ~50–60 bps of NAV with room to add another ~40 bps if the dollar pops and real yields jump on a hot print, producing a reflex dip. My add trigger is a retrace toward the 20-day trend anchor or the prior breakout zone (use your platform levels), and I protect the augmented position with a two-to-three-week call-spread overlay (strikes staggered ~1.5–3.0% above spot) so that gold’s “risk-off” upside pays for drawdowns elsewhere without over-spending theta. If we get the “bad labor” tail and real yields sink, I let the core run and harvest half once we’ve reclaimed the event-day high.
For the dollar complex (DXY) and USDJPY, I keep a mild pre-event long-USD skew and make the position event-optional with options. Spot, I prefer to be long USDJPY in small with a stop under last week’s swing low because the asymmetric policy signaling still favors the dollar if the market walks back near-term cut odds. Into the release, I layer inexpensive yen calls (USDJPY puts) one to two weeks out, about 1.5–2.0% out-of-the-money, sized to cover roughly two-thirds of the spot notional; that seagull-like shape caps my topside but pays if the print is soft and the pair slides. If the labor data is “Goldilocks” (cooling wages, okay payrolls), I expect DXY to hold a bid without a trend; I keep the light long and roll protection down a strike. If it’s hot, I add to USDJPY on the first pullback that coincides with U.S. front-end yields re-widening and I trail the stop daily. If it’s bad, I flip: the options do the initial work; I close spot longs and will only re-engage once the curve has bull-steepened and credit is stable for a session.
For crude oil (WTI), I treat the event as volatility, not a regime break. The supply side is intact into year-end, so my bias is to buy weakness that is macro-headline driven but not inventory-validated. Practically, that means I set alerts to add on a fast −2% to −3% flush that coincides with equity and dollar shocks, then I confirm that the move isn’t accompanied by a bearish inventory surprise before scaling. I prefer calendar-month exposure with a slight long-gamma profile; where options liquidity is ample, I run a collar (own the underlying or delta via futures, buy a 2–3-week 4–5% OTM put, finance with a 5–6% OTM call) sized at ~75 bps of NAV. If the labor data is hot and the dollar surges, I expect an initial oil wobble; I add only once the dollar impulse fades intraday. If the data is bad, I fade the first oil rally unless inventories corroborate genuine tightening or geopolitical headlines do the lifting.
On position sizing and aggregate risk, I cap single-asset directional risk at 60 bps of NAV pre-event and 100 bps post-print only after spreads and realized vol normalize. Net equity beta stays ≤0.35 into the release, rising toward ~0.55–0.60 if we get a “cooling but not collapsing” outcome and credit is calm; if it’s hot, beta drops toward ~0.20 and I let the dollar and gold hedges carry. I monitor the 2s/10s and 5y real yield as my macro governors; a persistent post-event rise in real yields alongside wider credit spreads is my cue to cut beta irrespective of index level. I define “wider” as a sustained two-day move that breaches the prior month’s wides on your preferred IG/HY benchmarks, no heroics against credit.
Hedge architecture is simple and deliberate. I keep a “gamma umbrella” worth roughly 1.0–1.2% of NAV spread across weekly SPX 3–5% OTM puts through the data window, refreshed on green closes and harvested into vol spikes. I pair it with a gold call-spread ladder so that part of the umbrella is funded by metal convexity. In FX, I maintain the USDJPY seagull described above; for broader USD risk I prefer EURUSD 1-week strangles when pricing is benign, sized tiny, because they catch both “hot” and “bad” tails when DXY jolts. In crude, the collars serve as both discipline and carry buffer; if the market runs, the foregone topside is a trade-off I accept for balance-sheet stability. If the event turns into a disorderly credit day, I add a short-dated HYG or LQD put spread as a fast hedge rather than dumping core equity at the lows.
Execution discipline matters more than the macro take. I will not buy the first spike lower in equities; I wait for the second test once the first round of systematic flows have fired. I scale in thirds and accept that missing the exact low is cheaper than catching the wrong trend. I never average down in options on event day; I roll or cut. Intraday, my triggers are time-based as well as price-based: I only add risk after both the headline and the key revisions/details (labor force participation, average weekly hours) have crossed and been digested for at least 15 minutes. I do not carry new, sizeable positions unhedged into the weekend while the policy calendar is dense.
For the Europe-centric sleeve you run out of Warsaw, I keep the relative-value tilt that benefits from a modest U.S.–China thaw and stronger U.S. demand without paying full U.S. multiple risk. I am long DAX versus a U.S. cyclicals basket only on tariff-relief-friendly days and only after the labor print has not tightened U.S. financial conditions; the stop is a daily close where DAX underperforms by ~150 bps versus the basket from the event open. In FX, I like EURPLN on any upside surprise in German PMIs that follows the U.S. data week; I enter small with a stop under the most recent local low and I take half off at the first +0.8% move because PLN’s beta to global risk can turn quickly. On the WIG20, I express it through exporters with U.S. end-demand and I cap single-name risk at 40 bps until we clear the December central-bank communications.
Putting it into a single action sequence: I keep gross exposure modest into Wednesday; I widen hedges on green closes; I let the first post-print hour play out; I buy equities and oil only if the mix is “cooling but not collapsing,” and I do it in thirds with stops on daily closes; I hold or add to gold on any rates-induced dip and lock in half on a retest of highs; I keep a small USDJPY long but let the options do the heavy lifting if the dollar breaks; and I reassess beta through the lens of credit and real yields, not just index points. If the data surprises hot, I shift the book quickly toward dollar-positive, equity-light, duration-neutral with fresh SPX protection; if it is bad, I cut gross, keep convexity on, and wait for credit to settle before redeploying.

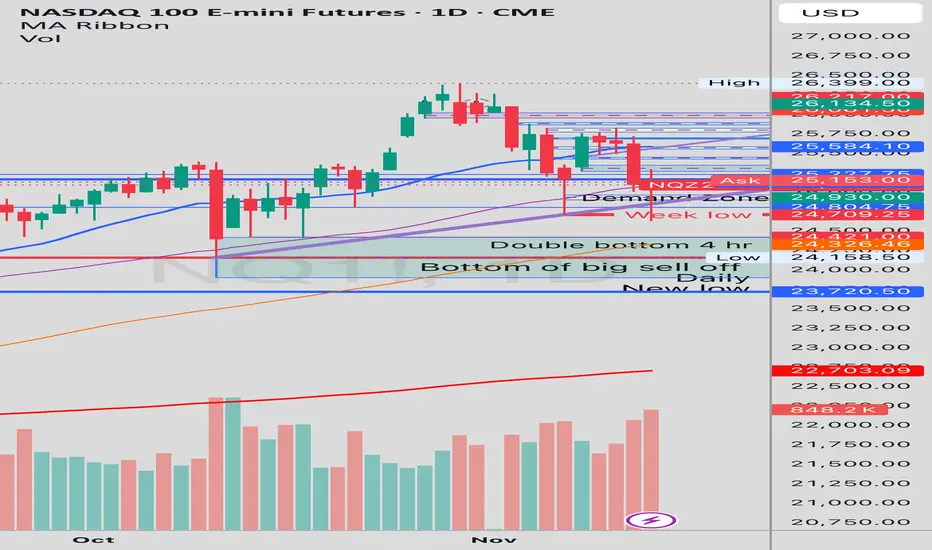
Would you consider this a H&S break on NQ?Would you consider this a H&S break?
I know things are volitile and wierd right now...which makes me think that this could be a weird looking H&S. Remember, the patterns show us an idea, a story. Does this tell the story to you? It shows what an H&S shows. It is just sloppy because of volitile movements...
“Gold’s about to choose violence or victory — watch the map.”Hello Goldies,
Gold steps into the new week perched at the peak of an extraordinary rally. Last week’s candle left a strong rejection wick from premium territory — a clear sign of absorption and the first hint of exhaustion after weeks of near-vertical momentum. We’re now sitting at a pivotal weekly inflection point, where the next candle could set the tone for the rest of the month.
Macro & News Landscape
The USD-heavy calendar is loaded:
FOMC Minutes could reshape expectations around future policy easing
Labour & PMI data may sway short-term dollar flows
Geopolitical tensions continue to simmer, keeping volatility elevated
From a weekly standpoint, this mix creates prime conditions for a decisive move in either direction — making key structural levels more critical than ever.
Hello traders,
Gold steps into the new week perched at the peak of an extraordinary rally. Last week’s candle left a strong rejection wick from premium territory — a clear sign of absorption and the first hint of exhaustion after weeks of near-vertical momentum. We’re now sitting at a pivotal weekly inflection point, where the next candle could set the tone for the rest of the month.
Macro & News Landscape
The USD-heavy calendar is loaded:
FOMC Minutes could reshape expectations around future policy easing
Labor & PMI data may sway short-term dollar flows
Geopolitical tensions continue to simmer, keeping volatility elevated
From a weekly standpoint, this mix creates prime conditions for a decisive move in either direction — making key structural levels more critical than ever.
WEEKLY STRUCTURE — Macro Map
🟥 Premium Supply Layers
You’ve correctly mapped a three-tier premium distribution stack:
1️⃣ 4150–4300 (Upper Weekly Supply)
• The origin of last week’s rejection.
• 4150 = first upside draw
• 4300 = full delivery of the block
2️⃣ 4450–4600 (Mid-Premium Supply)
• Reactivates only after 4300 clears
• 4450 = next premium imbalance boundary
3️⃣ 4750–4900 (Extreme Premium Supply)
• The deepest untouched layer
• Only activates in a strong bullish continuation phase
🟦 Weekly Demand Layers
1️⃣ 3570–3720 (First Weekly Demand)
• Last valid W1 OB before bullish BOS
• 3720 = first downside target
• 3570 = full mitigation
2️⃣ 3200–3350 (Mid-Weekly Demand)
• Corrective consolidation base
• Next stop if 3570 breaks
3️⃣ 2670–2820 (Deep Weekly Demand)
• Long-term accumulation
• Not active unless multi-month unwinding begins
⚪ Weekly Decision Zone: 3950–4085
The key zone directly beneath price.
This determines whether gold returns to premium or unwinds the entire macro leg.
W1 Expectation Flow
BULLISH PATH
Hold above 4085 → reclaim 4150 → break 4300 → target 4450 → extend toward 4750.
BEARISH PATH
Lose 3950 → target 3720 → break exposes 3570 → fall through opens 3350 → 3200.
DAILY STRUCTURE — Short-Term Macro Pulse
Bias
Neutral → leaning bearish, due to:
• Strong rejection off ATH sweep
• Compression under resistance
• Short EMAs softening
• No bullish reversal structures on D1
Macro trend = bullish, but D1 = controlled correction.
🟥 Daily Supply Zones
1️⃣ 4180–4240 (First Ceiling)
2️⃣ 4360–4420 (ATH Sweep Supply)
3️⃣ 4470–4570 (Extension Supply)
These three create a layered ceiling above the Decision Zone.
🟦 Daily Demand Zones
1️⃣ 3850–3950 (First Demand)
2️⃣ 3600–3700 (Deep Daily Demand)
⚪ Daily Decision Zone: 4050–4100
Where gold is currently stalling.
Holding = bullish rotation
Losing = continuation deeper into discount.
D1 Expectation Flow
BULLISH
Hold 4050 → reclaim 4100 → 4180 → 4240 → sweep-zone 4360 → higher targets open.
BEARISH
Close below 4050 → target 3950 → lose it → 3600–3700 discount zone.
H4 STRUCTURE — Tactical Cycle
H4 Bias: Bullish Corrective
• 4380 → 3885 created the macro discounted base
• 3885 → 4245 formed the new bullish leg
• Current drop to ~4085 = mid-leg retracement (healthy)
Demand intact, supply unmitigated above.
🟥 H4 Supply
1️⃣ 4205–4240 (Primary)
2️⃣ 4345–4380 (ATH Rejection)
3️⃣ 4450–4480 (Premium Extension)
🟦 H4 Demand
1️⃣ 4005–4035 (Immediate)
2️⃣ 3890–3920 (Mid-Level Accumulation)
3️⃣ 3760–3790 (Deep Structural)
⚪ H4 Decision Zone: 4080–4110
Mid-range control.
Acceptance = upside
Rejection = continuation lower
🎯 First Upside Draw: 4120–4147 (H4 Imbalance)
A clean inefficiency, not supply.
H4 Expectation Flow
BULLISH
Defend 4005 → reclaim 4080–4110 → fill 4120–4147 → attack 4205–4240.
BEARISH
Reject 4080–4110 → fail 4070 → retest 4005 → break → 3890.
H1 STRUCTURE — Intraday Battle Map
Gold is compressing between local demand and the mid-range FVG.
Momentum undecided.
🟥 H1 Supply Above
4160–4175
4197–4211
4240–4255
Each level forms a staircase of intraday liquidity caps.
🟦 H1 Demand Below
4073–4087 (Continuation Base)
4027–4044 (Structural Support)
3986–4000 (Origin of the entire bullish leg)
⚪ H1 Decision Zone: 4118–4132
Intraday pivot.
Reclaim = bullish shift
Rejection = deeper pullback
H1 Expectation Flow
BULLISH
Defend 4073 → reclaim FVG → target 4160 → break → 4197.
BEARISH
Reject FVG → fall to 4027 → lose it → 3986 origin.
🌍 FULL SYSTEM SYNTHESIS — The Real Story
Gold is at a perfect confluence point:
Weekly → sitting on the macro W1 decision zone
Daily → trapped under multiple supply layers in a corrective leg
H4 → bullish structure but correcting into demand
H1 → compression waiting for breakout
All timeframes point to one master battleground:
⭐ 4080–4130
(W1 Decision Zone + D1 Decision Zone + H4 Decision Zone + H1 FVG)
This single zone will dictate the next 10–20 days of price delivery.
📌 Final Summary
If gold holds 4080–4050, it rotates back upward into premium.
If gold fails 4050–3950, deeper discount zones activate in sequence.

LTCBTC Monthly – Multi-Year Downtrend Nearing Exhaustion?RSI Structure Suggests a Major Reversal Brewing
Timeframe: 1M (Monthly)
LTCBTC has spent almost a decade grinding lower inside a clearly defined multi-channel descending structure. Every major rally has formed a lower high, respecting long-term trendlines dating back to 2014–2015.
Price is now compressing at the bottom of the macro falling wedge/channel, with volatility at historic lows and volume drying up—a structure that often precedes a major trend change.
📐 Price Structure
1. Macro Downtrend Channels
Red support line marks the absolute long-term floor, tested several times since 2023–2025.
Price is currently sitting right on that red long-term support, with early signs of demand returning.
2. Volume Profile
Volume has been steadily decreasing for years.
This type of volatility + volume contraction at major support has historically preceded large expansions (both bullish or bearish, but combined with RSI, the bullish case is stronger).
📊 RSI Momentum Analysis
This is the strongest part of the chart.
1. Long-Term RSI Downtrend (Orange)
RSI has been respecting a 10-year descending trendline, creating lower highs since 2017.
Price is approaching this trendline again from below.
A monthly breakout above this RSI resistance would be the first macro bullish confirmation in nearly a decade.
2. RSI Higher Lows (Red)
Despite price making flat or lower lows, RSI is making higher lows, creating:
A long-term bullish divergence
A tightening momentum structure, signaling diminishing seller strength
This is the exact structure seen before previous LTCBTC macro reversals.
📈 Bullish Case
If LTCBTC holds the red support and RSI continues upward:
Key bullish triggers:
🔵 Monthly RSI breakout above the orange resistance line
🟢 Monthly close above the orange descending price channel
🟩 Volume expansion returning after multi-year compression
Targets on breakout (from conservative to aggressive):
0.0022 (bottom of mid-green channel)
0.0040 (mid of macro channel)
0.0060–0.0080 (top of the long-term green channel)
📉 Bearish Case
If LTCBTC loses the red macro support:
Structure invalidation
Retest of historical lows
Continuation of multi-year bleed
This would require RSI also rejecting at the orange line and rolling over.
📌 Conclusion
LTCBTC is sitting on a once-per-cycle support zone while RSI prints a multi-year bullish divergence and approaches a key breakout trendline.
This is one of the most interesting long-term setups on the chart in 2025.
Price compression + RSI compression + long-term support often leads to explosive moves.
Not financial advice — just a chart-based idea.

ADA/USD – Breaking Down, Weakest of the Set🔴 Bias: Bearish
Price: $0.492
Below SMA200 ($0.733), RSI ~32 → weak, drifting at support.
Key Levels
Resistance: $0.53 → $0.60
Support: $0.49 → $0.46
Read:
ADA is hanging on by a thread. Structure is a clear downtrend and buyers aren’t stepping in. If $0.49 fails, $0.46 becomes magnetic. No sign of real bullish divergence yet.

XRP/USD – Holding Support but Trend Still Down🟠 Bias: Neutral → Slightly Bearish
Price: $2.21
Below SMA200 ($2.63). RSI ~40 → stabilizing, but momentum still weak.
Key Levels
Resistance: $2.30 / $2.45
Support: $2.07 → $2.00
Read:
Unlike ADA, XRP is at least stabilizing. The $2.07–$2.00 zone is real support from prior reactions. Unless it closes above $2.30, this remains a bounce-only environment.

BNB/USD – Strongest Structure Here🟢 Bias: Neutral → Bullish
Price: $932
Still well above SMA200 ($835) — rare strength in this environment. RSI ~37 → oversold but flattening.
Key Levels
Resistance: $960 → $1,020
Support: $880 → $835
Read:
BNB continues to behave better than nearly every major alt. Price is holding a higher-timeframe trend and showing compression rather than breakdown. If anything rallies first in this batch, it’s BNB.

Boeing Eyes Major T-7 Deal as Price Trades In a Falling Wedge Boeing is drawing renewed attention as it prepares to announce a new partnership tied to an international bid for its T-7 trainer jet. Executives confirmed that details should emerge within a week, signaling growing global demand for lightweight training aircraft. The move follows earlier reports that Boeing and Saab, already joint partners on the T-7 program, have been in discussions with BAE Systems.
Their potential collaboration is viewed as a strategic push to compete for Britain’s future trainer fleet, which is expected to replace the long-serving Hawk jets after the UK’s latest defense review recommended a next-generation solution. Boeing’s expanding interest in major markets across Europe and Asia reflects the rising need for advanced trainers as air forces modernize and prepare pilots for fifth-gen fighters. The news comes during the Dubai Airshow, where defense procurement momentum tends to accelerate.
Fundamentally, Boeing’s defense segment is becoming increasingly important as the commercial aircraft division continues navigating production and delivery challenges. A strong T-7 export pipeline could support better revenue diversification and stabilize long-term contracts. While the final structure of the upcoming partnership remains unknown, investor sentiment is likely to improve if Boeing secures a competitive position in the UK tender. However, integration, execution risks, and geopolitical uncertainty remain factors that could affect the program.
Technically, Boeing’s chart shows a long-term symmetrical wedge formation. Price is trading near $194, sitting in the midpoint of the structure. The upper trendline around $250 continues to cap bullish momentum, while the rising lower trendline near $150 provides multi-year support. Recent selling pressure has pulled price off the $240 region, but the long-term structure remains intact. A breakout above $250 could trigger a strong continuation move, while a breakdown below the rising base would shift sentiment bearish.
