Gold up correction wave X Gold price is currently in wave X of correction WXY. Today, 06-11-2025, wave 2 is expected to correct to 3958. Buying from 3960, targeting 4072 as wave 3. Stop loss at 3945.
Fundamental Analysis

Crude oil waiting for longsCrude oil weekly chart.
After taking lower high weekly candle, price run $+61 for that dealing range I was looking for price retrace to fibo 50% level, we are almost there, I will look for lower t market structure break for confirmation, after that will long oil

US500 maintains inherently bullish structureFundamental Analysis
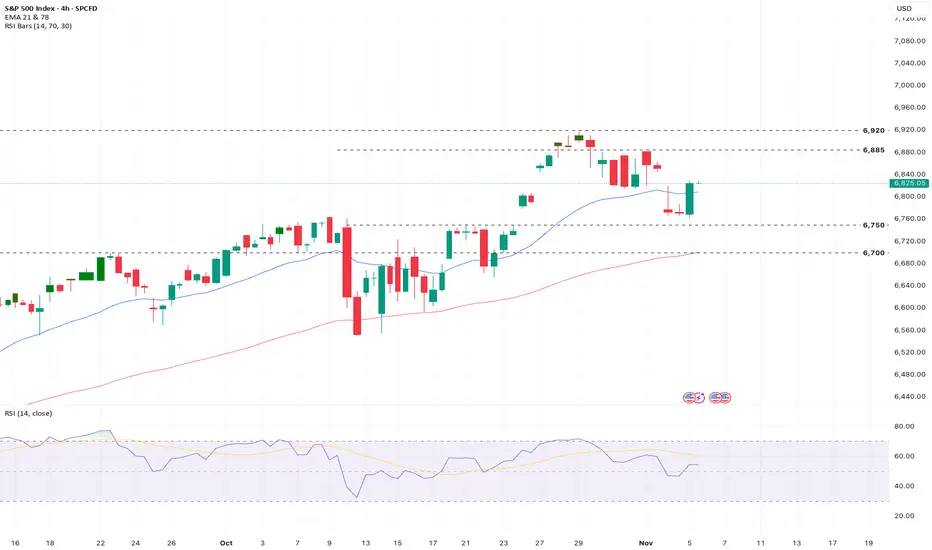
US500 maintains an inherently bullish structure, trading above both EMAs. Q3 earnings were strong, with 83% of companies beating expectations and delivering 13.8% blended EPS growth, largely thanks to megacap tech/AI. However, the forward P/E ratio is high at 23.1x (above the 5-year average of 19.9x), signaling elevated valuations. The recent profit taking in high growth names like AMD and Nvidia due to margin concerns and macro headwinds (high rates/inflation) exposes this valuation sensitivity.
Technical Analysis
The index is currently pulling back from all time highs near 6,900, consolidating in a short term support zone of 6,750. Momentum is neutralizing with RSI approx 51.6, indicating a pause rather than a reversal. Key technical battleground: Resistance at 6,885 and 6,920 versus support at 6,750 and the EMA at 6,700. Consolidation is the most probable short term path.
Sentiment Analysis
Sentiment is cautious to slightly negative. The sharp correction in AI leaders (AMD, NVDA) has fueled "AI bubble" fears, overriding fundamentally strong earnings reports. There is a clear, broad sector rotation occurring as investors de-risk and take year end profits from high growth tech toward defensive/value plays. The market is currently driven by nervousness about sustaining premium valuations against persistent macro uncertainty.
Outlook
The near term outlook is moderately cautious. While the long term bullish trend remains supported by healthy corporate earnings, the market faces an inflection point driven by overvaluation concerns in the tech sector. Further short term volatility is expected as the market digests earnings nuances (like margin guidance) and awaits clearer signals on US monetary policy and inflation. A decisive break of the 6,750 support or 6,885 resistance will likely define the next directional move.
Analysis is by Terence Hove, Senior Financial Markets Strategist at Exness
Monthly Metals Analysis: Gold (XAUUSD), Issue 211 The analyst expects XAUUSD’s price to rise by the specified end time, based on quantitative analysis.
The take-profit level only indicates the potential price range during this period — it’s optional and not a prediction that price will reach it.
You don’t need to go all-in or use leverage to trade wisely.
Allocating just a portion of your funds keeps overall risk minimal.
Our approach follows institutional portfolio principles — not the all-in or blow-up trading style often seen on social media.
Results are measured over the full time window, regardless of whether the take-profit level is hit.
The validity of this analysis is based on a specific time range (until 03 Dec 2025), and after this period, the analysis will be reviewed and updated (once every 28 days).

EUR/USD Price Outlook – Trade Setup (5 Nov 2025)📊 Technical Structure
TICKMILL:EURUSD EUR/USD has paused its five-day slide and is stabilizing around 1.1480–1.1490, just above the highlighted Support Zone (1.1481–1.1475). The recent candle structure shows rejection from below 1.1470, suggesting dip-buyers are defending this area.
Overhead, the next key Resistance Zone comes in at 1.1521–1.1526, where recent breakdown started and where supply is likely to re-emerge. As long as price holds above 1.1470, a corrective push toward 1.1520+ remains on the table.
However, the broader trend is still down from last week’s highs, so any bounce is treated as corrective unless we see a strong hourly close above 1.1530.
🎯 Trade Setup
Idea: Buy the dip into support, target a corrective move into resistance.
Entry: 1.1475 – 1.1481 (on pullback toward support zone)
Stop Loss: 1.1470
Take Profit 1: 1.1520
Take Profit 2: 1.1530
Risk–Reward Ratio: ≈ 1 : 4.27
A clean break and hourly close below 1.1470 would invalidate the long setup and reopen downside risk toward 1.1420–1.1430.
🌐 Macro Background
EUR/USD is holding gains near 1.1500 as the Euro finds support from expectations that the European Central Bank (ECB) will maintain a cautious, data-dependent stance rather than rushing into more easing.
FXStreet’s Akhtar Faruqui notes that the pair “halts its five-day losing streak, trading around 1.1490… as traders expect the ECB to adopt a cautious stance in its upcoming policy meeting.”
ECB side:
In October, the ECB left rates unchanged for a third consecutive meeting, signaling that the inflation outlook is broadly stable while uncertainty persists.
Recent data showed Eurozone inflation only slightly above the 2% target, Q3 GDP beating expectations, and October surveys hinting at better sentiment.
Policymakers Villeroy and Kazaks both stressed that the ECB is in a “good position” and that risks to inflation and growth are more balanced, advocating no hasty moves and a data-dependent approach. This cautious tone reduces immediate easing bets and offers support to the Euro.
USD side:
The US Dollar faces headwinds from the ongoing US government shutdown, which has now entered its sixth week and is on track to become the longest funding lapse in history.
The Senate has repeatedly failed to pass a short-term funding bill, keeping political uncertainty elevated and limiting further USD upside.
Overall, a cautious but steady ECB vs. a politically constrained US backdrop justifies a short-term corrective bounce in EUR/USD, even if the broader trend remains fragile.
🔑 Key Technical Levels
Resistance: 1.1521 – 1.1526
Support: 1.1477 – 1.1481
Intra-day Pivot / Psychological Level: 1.1500
📌 Trade Summary
EUR/USD is trying to base out above 1.1470 after a five-day decline. The technical picture, combined with a cautious ECB and a politically pressured USD, favours a short-term buy-the-dip strategy into the 1.1520–1.1530 resistance band.
A break below 1.1470 would negate the idea and shift focus back to the downside toward mid-1.14s.
⚠️ Disclaimer
This analysis is for reference only and does not constitute trading advice. Trading involves significant risk, and proper risk management is essential.

XAUUSD – DAILY BULLISH SCENARIO – TARGET 4050💛 XAUUSD – DAILY BULLISH SCENARIO – TARGET 4050 🎯
🌤 1. Overview
Hello everyone 💬
Although the larger trend for gold leans towards a downtrend, today I prioritize a bullish scenario in the short term.
On the M30 chart, the price structure is gradually increasing, indicating that short-term capital is shifting towards buyers.
The 3990 zone is a very important area – where a Break of Structure (BOS) has just appeared and is also a strong resistance that has reacted multiple times before.
Price needs to confirm a break above this area to continue expanding the bullish trend.
💹 2. Technical Analysis (ICT Perspective)
📈 An ascending structure (BOS) has formed on M30.
🟣 Buy Zone 3977–3979 coincides with the support trendline – a beautiful confluence point for buyers.
🔹 Resistance zone 3990–4000 is the area to confirm the main direction.
💫 Higher target: Fibonacci Extension 1.618 area around 4049–4050, coinciding with the psychological resistance at 4050.
🎯 3. Reference Trading Plan
💖 Main BUY (priority)
Entry: 3977–3979 | SL: 3970
TP: 3988 – 4000 – 4022 – 4040 – 4050
💢 Short SELL (when price reacts strongly at resistance)
Entry: 4012–4014 | SL: 4020
TP: 4002 – 3988 – 3965
⚠️ 4. Important Notes
Price needs to confirm above the 3990 area to solidify the bullish trend.
If it breaks below 3970, the ascending structure is temporarily invalidated.
Today, prioritize buying according to the capital flow, sell only when there is a clear signal at the resistance zone.
🌷 5. Conclusion & Interaction with LanaM2
Gold is showing positive signals 💛
Be patient and wait for reactions at the Buy Zone 3977–3979, this could be the starting point for a new upward move towards 4050.
This is not an investment recommendation, just a personal view according to the ICT method.
If you find it useful, please 💛 like – 💬 comment – 🔔 follow LanaM2 to update gold analysis with me every day ✨

DASH QuantSignals V3 Earnings 2025-11-05DASH QuantSignals V3 Earnings 2025-11-05
DASH Earnings Signal | 2025-11-05
• Direction: BUY CALLS | Confidence: 70%
• Entry Plan: Pre Earnings Close | Expiry 2025-11-07
• Strike Focus: $240.00
• Entry Range: $11.25
• Target 1: $16.35
• Stop Loss: $7.40
• Implied Move: $24.10 (10.1%)
• 24h Move: -0.06%
• Flow Intel: Neutral | PCR 0.97
• ⚠️ MODERATE RISK WARNING: Consider reducing position size due to moderate confidence level.
• Earnings Date: 2025-11-05 | Estimate: $0.70
⚖️ Compliance: Educational earnings analysis for QS Premium members only. Not financial advice.
🎯 TRADE RECOMMENDATION
Direction: BUY CALLS
Confidence: 70%
Conviction Level: MEDIUM
🧠 ANALYSIS SUMMARY
Katy AI Signal: PRIMARY BIAS BUY CALLS (composite score +2.4) - Strong bullish signal based on exceptional revenue growth (3425.0%), strong beat history (75%), and consistent big beats (avg +31.5%)
Technical Analysis: RSI at 28.2 (oversold - potential reversal opportunity), but MACD -2.4507 and momentum -5.53% show bearish pressure. Current price $238.35 trading near day's midpoint with 1.1x average volume suggesting mild interest
News Sentiment: Benchmark maintains Buy rating with price target raised to $320 (bullish catalyst). Recent earnings preview articles indicate high market attention. General market rebound environment supportive
Options Flow: Neutral put/call ratio (0.97) with max volume at $262 put showing some hedging. Implied move of 10.1% ($24.10) suggests significant volatility priced in
Risk Level: MODERATE - High IV (169%) increases premium costs, but oversold RSI and strong fundamental case provide cushion
💰 TRADE SETUP
Expiry Date: 2025-11-07 (2 days)
Recommended Strike: $240.00
Entry Price: $10.90 - $11.60
Target 1: $16.35 (50% gain from entry)
Target 2: $22.50 (100% gain from entry)
Stop Loss: $7.40 (35% loss from entry)
Position Size: 3% of portfolio
⚡ COMPETITIVE ED
Image
QS Analyst
APP
— 11:08 AM
GE
Why This Trade: Combines Katy AI's strong bullish composite score (+2.4) with oversold technical conditions and positive analyst sentiment (Benchmark $320 target)
Timing Advantage: Earnings release creates volatility catalyst while oversold RSI suggests limited downside risk pre-earnings
Risk Mitigation: Balanced delta (0.506) provides good risk/reward, stop loss at 35% protects against IV crush post-earnings
🚨 IMPORTANT NOTES
High IV (169%) means time decay will be aggressive - exit before earnings release if targets not hit
Monitor for any last-minute earnings whispers that could change sentiment
Consider scaling out at Target 1 to lock in profits given short expiration timeframe
📊 TRADE DETAILS 📊
🎯 Instrument: DASH
🔀 Direction: CALL (LONG)
🎯 Strike: 240.00
💵 Entry Price: 11.25
🎯 Profit Target: 16.35
🛑 Stop Loss: 7.40
📅 Expiry: 2025-11-07
📏 Size: 3.0
📈 Confidence: 70%
⏰ Entry Timing: N/A
🕒 Signal Time: 2025-11-05 14:08:45 EST
⚠️ MODERATE RISK WARNING: Consider reducing position size due to moderate confidence level.

USD/CAD – H4-Daily Supply Zone Reaction | Possible Short SetupPrice has reached a major resistance / supply zone (1.4140 – 1.4210) —
this area has previously caused strong rejections in the past.
If price fails to break and hold above this zone,
a bearish correction toward 1.3850–1.3820 (previous demand area) could follow.
⚙️ Example Trade Setup
Entry: 1.4120 – 1.4140
Stop Loss: 1.4215
Take Profit: 1.3830 / 1.3850
Bias: Bearish
Price could form a lower high on the daily structure.
"USD/CAD testing the daily supply zone ⚠️
#USDCAD #ForexAnalysis #PriceAction #SmartMoneyConcepts #DailyChart #SupplyZone #BearishSetup #FXTrader #TradingView"

Bitcoin Daily Analysis #11 – November 05, 2025 Scared? 😅
Good — pay close attention to how you feel these days and journal everything. The most valuable financial lessons come exactly from moments like these. 📖
As you can see, Bitcoin is under heavy selling pressure, and its sharp drop around the $100,000 zone has so far been supported by buyers.
If that support breaks again, you could consider opening a short position, but ⚠️ don’t hold it too long — the overall trend remains bullish, and a strong rebound could follow.
Around $104,000, we might see a risky long trigger, but only with tight risk management and a controlled position size.
If Bitcoin tests $104,000 and gets rejected, a deeper correction or even a sharp drop could follow.
We’re in a phase where the market could swing both ways — once it breaks out of this uncertainty, expect a powerful move. ⚡
Macro data and recent economic news still favor Bitcoin, and interestingly, during this decline, the big players have mostly stayed on the sidelines, with lower-than-average trading volume. 📈
No matter which way Bitcoin moves, your risk management will determine your success. 🎯
So avoid emotional decisions and let the chart structure guide you. 📊
Disclaimer:
This content is for informational purposes only and does not constitute financial or investment advice. © DIBAPRISM
Larry D.Kohn

Dxy will fall in coming months Crypto will Rise.Dxy Target of 92 is going to happen in coming months blow off top will happen before bear market starts.

DXY — London SessionThe Dollar reached its 99.8 target and closed the day above it, confirming short-term strength. Price now trades stretched on the daily chart, well above its normal rhythm. As long as daily lows keep printing higher, structure holds — but with both weekly and monthly charts in correction, momentum could fade quickly. This is a day-by-day market where clarity matters more than conviction.
On the technical side, DXY shows rhythm exhaustion — clear deviation from its average range. When price moves this far from balance, professionals stop chasing and wait for rhythm to reset. The key signal now is whether the next daily low holds or breaks; that decides who controls the tape.
Macro conditions still support the Dollar. The Fed’s tone stays cautious on further cuts, while the U.S. government shutdown keeps data flow limited. Investors prefer safety over yield, and capital continues to park in USD for clarity and liquidity. It’s not a growth story — it’s a stability story.
When a target hits, professionals re-map before acting again. The next decision comes from structure, not emotion.
Operator Rule: After targets hit, think — don’t chase.
- Institutional Logic. Modern Technology. Real Freedom.

The upside is expected in the S&P 500 for WednesdayThe structure in the daily chart of the S&P 500 implies follow-through to the upside or Wednesdays trading session.

AMD's Long Awaited Reversal Advanced Micro Devices (AMD) has maintained a well-defined long-term ascending channel since 2019, marked by cyclical touches at both the upper and lower bounds. The current setup signals a bullish reversal following a successful retest of the channel’s lower boundary
AMD now shows a strong bullish reversal:
✅ Broke above a multi-year downtrend line with volume support
📈 Currently retesting resistance $128, a breakout zone historically met with selling
🎯 Channel target projection: $300, offering 140% upside from current price
🔄 Price action consistently respects this trend structure with rhythmically timed expansions every 18–24 months
🧾 Fundamental Tailwinds (2024–2025 Context)
🔥 1. AI Infrastructure & Data Center Dominance
AMD’s MI300X AI GPU series has gained significant traction against Nvidia, with major cloud customers like Microsoft Azure and Meta adopting it for inference workloads.
Revenue from AMD’s Data Center segment surged >80% YoY in Q1 2025, driven by hyperscaler demand and Genoa EPYC chips.
Guidance for 2025–2026 includes double-digit YoY growth across AI and cloud sectors.
🧠 2. Product Roadmap Strength
AMD maintains competitive momentum with Zen 5 CPU launches and RDNA 4 GPU architecture set to arrive late 2025.
Management reaffirmed commitment to high-margin enterprise products and scalable AI inference.
📉 3. Valuation Reset + Earnings Reacceleration
After correcting from $164 to under $100, AMD entered a consolidation phase, allowing for multiple compression reset.
Now trading at ~35x forward P/E (down from 60x peak), with EPS expected to grow >25% YoY into FY2026.
💵 4. Balance Sheet & Buyback Support
Over $5.7B in cash, near-zero debt, and an active $8B share buyback program reinforce shareholder value.
Gross margin in Q1 2025 stood at ~51%, with continued improvements expected from data center mix shift.

Chasing Lows - LINK weekly update Nov 04 - 10thAfter an astronomical gym session, I am now happy to review Chainlink to you!
Due to a negative macro outlook short-term, Altcoins and Bitcoin dropped in the beginning of the week and will be dropping further throughout the week.
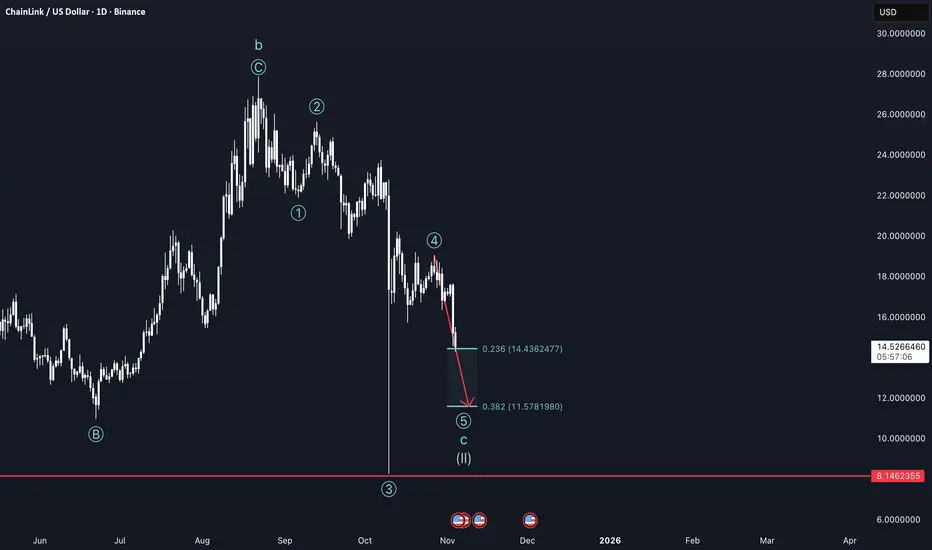
Looking at the structure I am considering the current movement to be part of a larger correction of the supercycle wave 2, were we are internally at the wave c on the cycle and in the fifth wave in the primary cycle. For now we technically reached the first price target for short fifth waves, but since I expect Ethereum to also go down I believe we are gonna drop to the 0.382 extension level of the fifth wave, at $11.57.
On the way there we are going to fill a lot of orders as the orderbook shows a lot of them, also at the price target. As we go down I do not recommend opening short positions because a lot of people will call Altcoins and the Alt-Season dead, leading to a lot of shorts and a gradually increasing chance of short-squeezes. The bottom could be in if funding rates on the daily turn negative, and RSI enters oversold areas on the 2 week chart.
This thesis also gets supported by the VIX, which is rising and therefore indicates a risk off sentiment and the USDT dominance chart as it rises also and gets near the top.
I urgently need to point out that at this point an ending of the downtrend gets more possible the lower we fall. Buying here is a great opportunity and the lower we get the more the effect of dollar cost averaging comes into play.
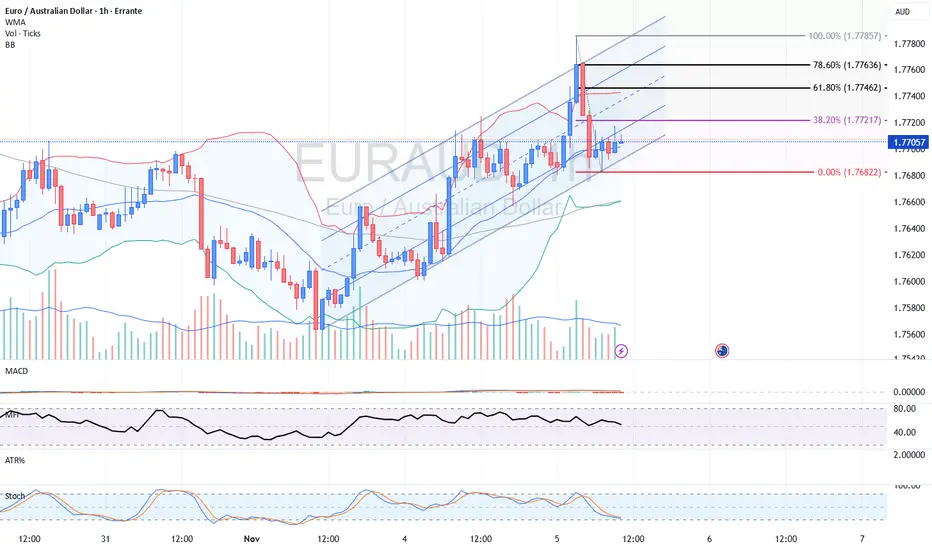
Euro/Aussie Eyes 1.7780 Resistance Amid RBA Pause and Eurozone PEUR/AUD is testing the upper boundary of a rising channel near 1.7710 after recent strength in the euro and caution around the Australian dollar ahead of Reserve Bank of Australia (RBA) policy commentary.
The technical set-up favours a push toward 1.7760-1.7780 (near the 78.6–100 % Fibonacci extensions), provided support holds around 1.7680–1.7690.
Key fundamentals include the RBA’s hold at 3.60 % and the eurozone PMI releases that may boost euro demand; the AUD remains pressured by weaker commodity triggers and a lack of fresh impetus.
The alternative scenario, if risk sentiment sours or the RBA signals easing later, would target a break below channel support toward 1.7640-1.7620.
Read full article here:
erranteacademy.com
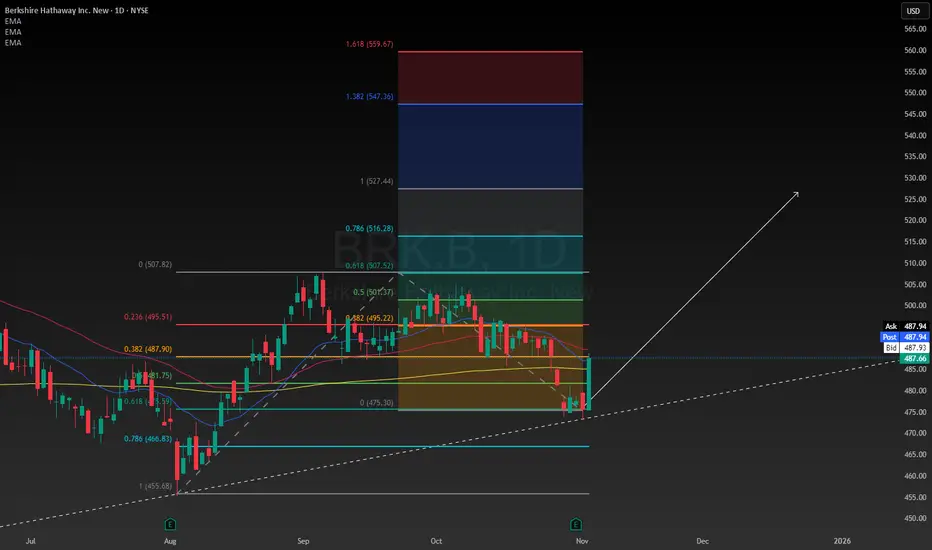
Strategically Investing in Berkshire HathawayI'm going to write about what makes Berkshire a good company, and why I am buying it. Since it is such a huge company I might not be able to define every single detail but I will do my best to cover the most important aspects of the company for you. I hope you enjoy my idea, I am using my time to write this for your benefit and entertainment. If your deciding whether or not you want to buy Berkshire shares maybe this idea can help you to be more informed without having to do a ton of research.
One of the most appealing things to me right now about the shares, is that they are significantly undervalued. The best way to determine the intrinsic value for this company would be to use the discounted cash flow calculation. Projecting 5 years into the future, based on how much money the company will be expected to generate over this period of time, it is reasonable to assume the intrinsic value of the shares to be approximately $560. I think it could take some time to get there so I'm estimating about one or two years from now Berkshire will be worth $560 or more.
Looking at how the company actually uses its capital is important. When the market is at all time highs, investors typically rebalance their portfolios into undervalued, less risky, more stable companies. Berkshire fits the narrative here, and I'm going to explain why.
-Berkshire reallocates capital to its diverse portfolio of businesses, including railroad, energy, manufacturing, and service and retail companies. This can involve funding growth and "bolt-on" acquisitions for subsidiary companies.
-A significant portion of capital is used to purchase equity securities, such as stocks in companies like Apple, American Express, and Coca-Cola, either for a full stake or a "part interest".
-The company holds a large amount of cash and short-term investments to be prepared for market opportunities, which can include waiting for the right time to make large acquisitions or investments.
-Berkshire's core insurance operations generate "float"—money taken in as premiums before claims are paid—which is then invested in other businesses and securities.
-Berkshire uses debt very sparingly and prioritizes equity and its insurance float as its primary sources of capital.
-While individual businesses manage their daily operations, top management, led by Warren Buffett, makes the major capital allocation decisions to ensure capital is deployed where it can generate the highest returns. However as many of you know, Warren Buffett will step down as CEO and leave Greg Abel in charge, I don't think this will change much in the core operations of the business.
All of these factors contribute to this being a low risk, undervalued investment opportunity despite unfavorable market conditions with the US500 being at all time highs. I have rotated some capital in Berkshire class B shares as a way to reduce my risk but also stay exposed to the market. Berkshire is a great defensive stock that can be added to a diversified portfolio to grow and protect it.
Hyperscale Data- GPUS Bottom Reversal pattern - Diamond 💎 pattern formation
Target price = 1.08$ - 1.12$
Highly recommended for Buying now 👌 best opportunity price 👍

GEN ZWHAT DOES THE COMPANY DO?
Pinterest makes money the same way most “free” platforms do—by selling your attention to advertisers, just with prettier pictures and better lighting. Their entire business model revolves around visual discovery ads, which is a poetic way of saying sponsored content disguised as inspiration.
Over 95% of Pinterest’s revenue comes from ads. The company doesn’t sell physical products or subscriptions; it sells ad space. When you see a pin about minimalist kitchens or "fall outfits 2025," chances are a brand paid to put it in your feed. Advertisers target users based on search intent (what you pin, save, or click on), which gives Pinterest a nice little niche—people go there looking for ideas to buy something.
THE AI & DATA TRAIN
They use AI to analyze pins, images, and behavior to serve “relevant inspiration.” Their algorithm tries to match your interests to advertisers’ products in a way that doesn’t feel too creepy. Usually.
EXPANSION OUTSIDE OF THE USA
They’ve been growing ad revenue outside the U.S., where the average revenue per user (ARPU) is still low. That’s their growth lever: more users + better monetization per user = rising free cash flow.
Below this link you can find Table&Figures
imgur.com
The company correctly priced based on they KEY METRICS which are just like for META
The game is simple - more user more monetization opportunity .
The real question is that Facebook for the Boomers, Instagram mainly Millenials and early GEN Z, Pinterest will be for GENZ and Alfa generation due to they better connection with pictures than expressions?


Is AMD expensive? Earnings News!AMD just posted a double beat and reporting a record amount of revenue. crossing the $9billion mark.
The company expects revenue of about $9.6 billion for the next quarter, plus or minus $300 million, compared with analysts' average estimate of $9.15 billion.
AMD last month said it would supply AI chips to OpenAI in a multi-year deal that would bring in tens of billions of dollars in annual revenue and give the startup the option to buy up to roughly 10% of the chipmaker.
The deal covers the deployment of hundreds of thousands of AMD's graphics processing units (GPUs), roughly equivalent to the energy needs of 5 million U.S. households, or about thrice the amount of power produced by the Hoover Dam.
The stock still seems a bit expensive for my liking but a good solid report.

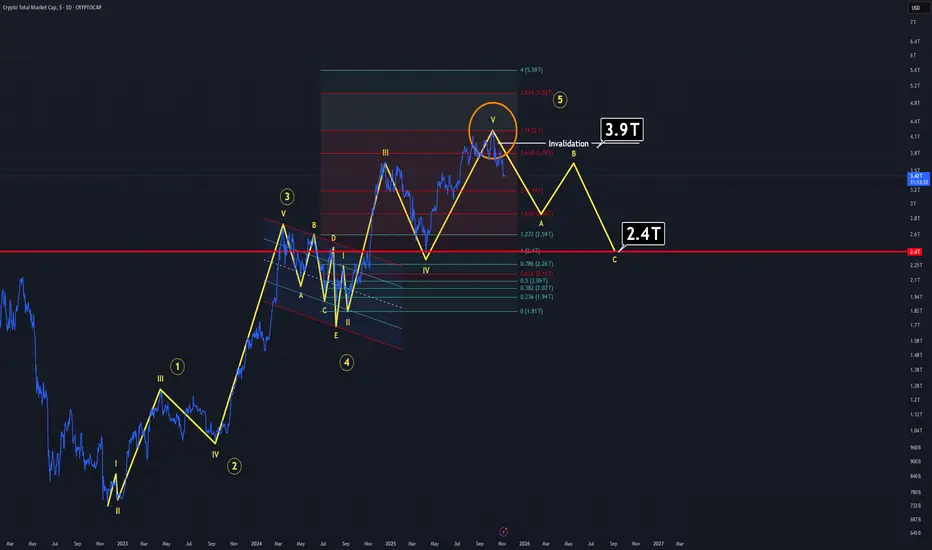
"Truth or Dare?"The parameter known as "Total" (All total market cap), shows a clear signal right now.
Before explain the techniacl details, I'll explain why should this move work:
Fundemental Details:
- FED has cut the interest rates for second time this year and most likely do it again before the year ends in December which is the most bullish macro signal for crypto to rise.
- US and China are trying to getting alone but behind the scenes the deal about tarrfis has already made long ago. They're just acting like they actually can carry on their political therats to each other to gain more political power. Trump is doing whatever he has done before when he got the crown. When all the nonsense ends, there won't be any problem left to think about tarrifs.
- US also threathens Venesuale but I don't think that matter will last long. Nevertheless, the matter still casuing heat on globe and that causes uncertinty.
- BOJ is another matter to keep in mind at the moment. The reason is, they announced that Japan may need to raise their interest rates in the next meeting which would be devastating for both crypto and all the markets on the globe. Crypto on the other hand, is facing this effect way sooner even before it happens, even if it won't happens. As you can guess, crypto markets are fragile. Every little tension means crises. That's one of the major reasons why it's actually losing value since last month.
- Let's get back to FED. Yes, FED is cutting the rates for the second time and expected to cut again in December despite the words from Powell BUT, we already knew that. Right?
As I mention about it on top, Crypto is fragile, but also very fast. When other markets are proccesing the reasons and possible outcomes of the news, crypto usually has already given the results of the possible news. Even if it's fake, unknown or unworthy to care about.
Crypto is fast. That's why it already gave every opportuinty to invest and now, the investor are taking profit from the very bullish news you just read.
"Sell the news" effect is just faster in crypto. Therefore, crypto has already gained the value it needed to gain. When you read the news or anything about crypto, remember one thing: it's already in the price. Bearish, or bullish. Won't matter.
Now let's get back to the part you like:
Technical details:
There are two possible senarios:
I'm not going to draw all the calculations on the chart so you won't confuse.
Senario one, The one you see in the main chart:
Total or Bitcoin, won't matter right now because they both going through same way.
At the moment, we might be witnessing an A-B-C corrective pattern on Total.
If you calculate enough, you'll reach the result that a perfect 5 waved uprising move has already happend and there is a possiblity that we might be in a corrective wave. Which, would result for TOTAL to drop at least 2.4 B levels. For Bitcoin, this level means it should drop down through around 80-85K.
Senario Two (Hopefully):
If the chart you see is a bear trap and the main bullish cycle is still on, it means we are at wave 4. Which means, Bitcoin still may dive under 100K but it won't last and we see even bigger all time highs in the coming month. Yes, in the coming month.
In order to this senario work, FED must give clear signals about rate cuts in December, resessiong must end immidiatly, US and China must behave well enough to lower tension around the globe.
If all the conditions met but price is still going side ways, it means get ready to see a "skyrocket candle".
Thanks for reading.
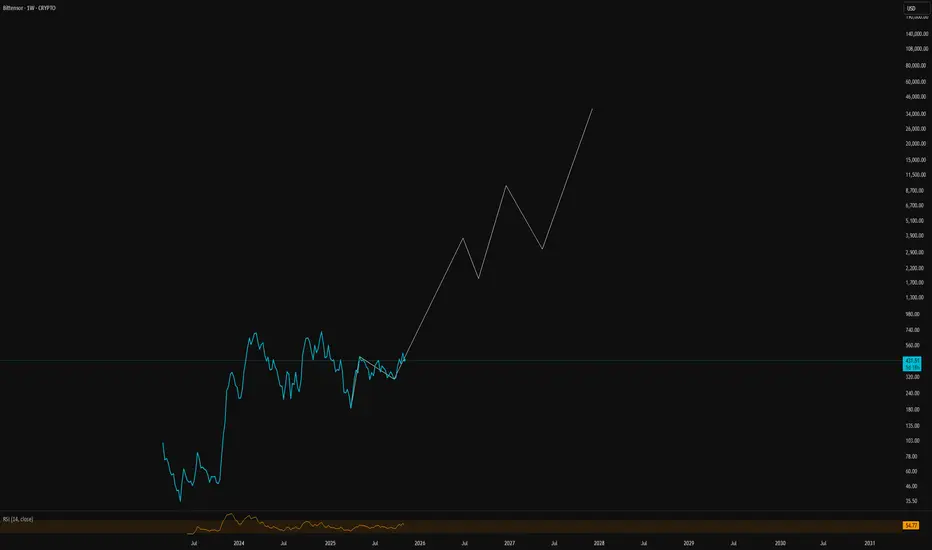
100x Coming...Plotting this on log in case it ends up being huge and does something like BTC done - could 100x in a few years or so.
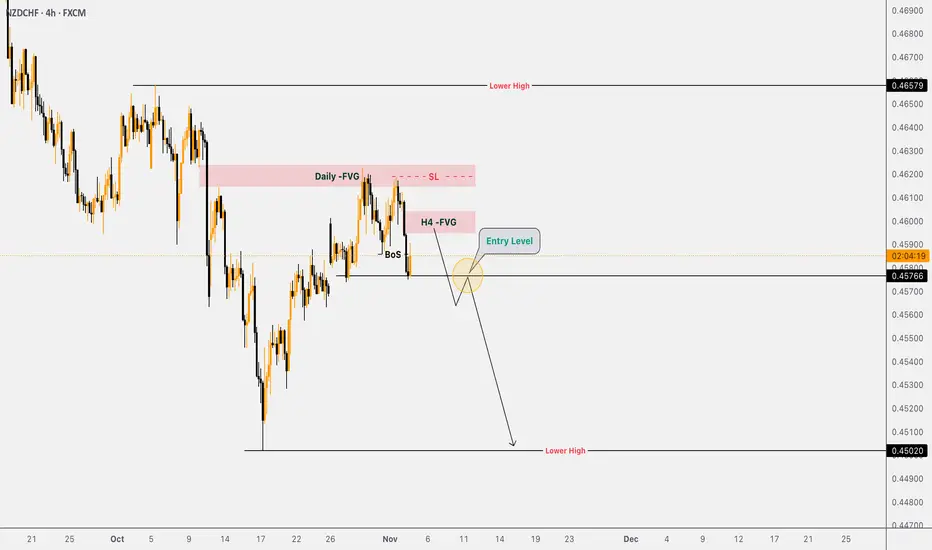
NZDCHF ShortsThe overall structure remAins bearish, with prIce continuing to show weakness across higher timeframe. The daily FVG (as shown) already has already been traded into and showed a bearish reaction, indicating that liquidity has been likely been collected from the imbalance area. On the H4, a new FVG (as shown) has recently printed, aligning with support level that price is currently respecting.
The expectation is for a daily candle to close bearish, confirming sustained downside momentum. A break and retest of the H4 support to the downside would signal a potential continuation setup, offering a clean opportunity for short entries targeting lower liquidity pools or the next higher timeframe discount zone.