USDJPY Weekly planOn JPY, I expect a move to the downside following this logic: 1M FP ➡️ 1W OB ➡️➡️➡️ 1M FVG. I will consider trades if price tests the 1W OB and forms confirmation on the 1D timeframe.
Fxsignals

Gold needs a correction after the ATH!Greetings!
If you see me at the charts, it means a fresh dose of solid analysis is coming.
Today my focus is on XAUUSD.
Yesterday we updated the ATH at 4642. Congrats to all holders and bullish traders. 🔥
This move happened amid global uncertainty. Greenland, Cuba, Iran, Trump is actively talking about all of this after what happened in Venezuela.
Because of that, investors are rushing into safe-haven assets to protect capital from a potential crisis.
And gold is the #1 safe-haven asset of all time.
Now to the chart:
The local uptrend started with Wyckoff accumulation. After that, at the top of the channel, price went sideways and formed a Wyckoff distribution.
For those who don’t know:
Accumulation → potential reversal up
Distribution → potential reversal down
At the highs, smart money distributes, so I’m expecting the start of a correction (for now, local).
There are 2 key zones where we could potentially see a reversal.
Profits to everyone! 💰
Follow for more 🚀

Dollar is strengthening against euro Hello! This is your finance professional speaking. Today we will look at one of the most important currency pairs in the global economy - EUR/USD.
Let’s start with fundamental analysis.
The EUR/USD pair reflects the ratio of the euro to the US dollar and reacts sensitively to central bank decisions, macroeconomic statistics, and overall risk appetite in global markets. Two institutions play a key role here - the European Central Bank (ECB) and the U.S. Federal Reserve (Fed).
Now let’s break down the key indicators and see how they influence the EUR/USD exchange rate.
1. Interest rates of the ECB and the Fed
This is the main driver of the pair’s movement. When rates in the U.S. are higher, the dollar becomes more attractive to investors and EUR/USD usually declines. If ECB policy is tighter or rates in the eurozone are relatively higher, the euro receives support.
2. Inflation
Rising inflation forces central banks to tighten monetary policy.
High inflation in the U.S. increases the likelihood of Fed rate hikes and supports the dollar.
Rising inflation in the eurozone strengthens expectations of tightening from the ECB and supports the euro.
3. Labor market
Strong U.S. employment data (NFP, unemployment) strengthens the dollar and raises expectations of higher interest rates. A weakening labor market, on the other hand, puts pressure on the dollar. The same logic applies to the eurozone.
4. Economic growth (GDP)
Higher growth makes a country’s assets more attractive.
Strong U.S. economic growth supports the dollar; strong eurozone growth supports the euro.
5. Market risk sentiment
In periods of uncertainty, investors move into safe-haven assets. The dollar traditionally plays the role of a "safe haven", so when global risks increase, the EUR/USD pair often declines.
Now let's move on to technical analysis.
1)EUR/USD has formed 5 Elliott waves up, indicating a potential trend completion.
2)At the end of the trend, a Wyckoff distribution structure has formed, signaling selling activity.
3)The reverse USDEUR chart shows that the dollar is being bought.
DXY is also an important indicator. In the attached screenshot, you can see that the dollar index is currently strengthening, and if it continues to rise, all dollar-denominated assets may undergo a correction.
Overall, that’s the situation!
Write in the comments what you think

EURJPY smart money is here!Hi! A financier is at the screens - today I’ll show you the trade I entered.
In front of us is the EURJPY chart.
First, it’s worth noting that the inverse chart JPYEUR looks very weak. This tells us that the euro is indeed stronger now, and we may see growth.
Second, in mid-December we had a similar structure. I’ve highlighted these structures with a blue rectangle.
Inside these rectangles, an accumulation schematic based on Wyckoff formed. This suggests that we have potential for a reversal and solid upside. It’s also worth noting that the structures are similar to each other and exhibit fractality.
So overall, I opened a long position, aiming to trade it up to the high where we have a liquidity shelf.


AUDCAD going long!Hello! This is your finance professional, and here is a new high-quality analysis.
Today we will review the AUDCAD currency pair.
On the chart, we can see that after a strong impulse the price went into a correction. The decline did not follow a usual structure but formed a wedge pattern.
A wedge pattern is a reversal structure. That is exactly what happened — the price reversed and we saw the continuation of the uptrend.
Right now, I have taken a long position according to my trend-following strategy and set the target at the asset’s high.

The trend is your friendHello everyone. I’m a financier and this is educational post that might help you get closer to consistent profitability (if you actually get the point).
Today I want to talk about trend trading. Yes - that very “best friend of a trader” that every book and every course keeps repeating. And after years in the market I can say: it’s not just a cliché - it really works.
I’ve been through plenty of strategies: classic TA, Elliott Waves, Smart Money Concepts, Williams’ trading chaos - you name it. I’ve traded with the trend, against it, and inside ranges.
Honestly, the results were average. My monthly win rate was about 30–40%. Not terrible, but I wanted fewer mistakes and more stability.
Eventually I set one hard rule for myself:
👉 I only trade in the direction of the trend.
And statistically, that mostly means trading the uptrend.
Here’s the logic. Any asset can drop around 99.99% - the downside is capped. But to the upside there is no limit. An asset can grow 2x, 5x, 10x and more. So statistically, longs are more favorable. I still take shorts when the market structure is bearish, but lately most assets are trending up.
So what’s the real advantage of trading with the trend?
The market has its own momentum. It’s simply easier to move with that flow than to fight it. I stopped trying to outsmart the market or predict every reversal. I don’t obsess over overbought/oversold signals. I just wait for my setup - the same repeatable scenario - and I trade it in the direction of the trend.
I’m a boring trader - and that’s exactly why I’m a profitable trader.
On social platforms my job is to share analysis and possible scenarios. But trading itself is different: the goal is not to predict, the goal is to execute. If the setup plays out - great. If not -no problem, I wait for the next one. I’m no longer a hostage to my own forecasts, which only kill objectivity.
Trend filters out a huge number of bad trades. It instantly removes about half of all random entries. After I really internalized that, my win rate improved, my psychology inside trades got much cleaner, less FOMO, less second-guessing. I stopped guessing - and started systematically executing.
So my takeaway for today:
👉 Trend really is your friend.
Try focusing only on trend trading and then tell me in the comments how it changed your results and mindset.

ETH Base Formation Under Bearish PressureCRYPTOCAP:ETH is forming a solid base near the bottom, which is a positive sign for a potential short-term bounce.
However, the overall trend remains bearish, with price still capped below the descending trendline and resistance zone.
Any upside from here is likely corrective unless ETH breaks and holds above key resistance.
DYOR, NFA
Please hit the like button if you like it, and share your views in the comments section.

AVNT Testing Key Resistance After Trendline BreakNYSE:AVNT is testing a key resistance zone after breaking above the descending trendline. While this bounce looks promising, price needs to hold above this level for any sustained upside.
A rejection here could lead to another pullback, so confirmation is key.
DYOR, NFA

MY OUTLOOK ON DXY 2025 We are range-bound in 2025. Caught some of the swings, looking for further downside to make a triple bottom. Don't know what 2026 holds, but I'm in serious anticipation of a trend reversal.

Altcoin Market Cap Building Energy Before Next ExpansionThe total crypto market cap excluding the top 10 continues to follow a familiar cycle of accumulation, breakout, expansion, and consolidation. After strong moves, the market typically ranges for a period before the next leg.
Currently, it is consolidating within a wide range, similar to past phases before major expansions. This suggests the market is building energy, not distributing.
A breakout above the range could trigger the next expansion phase for altcoins, while patience is needed until that happens.
NFA
Please hit the like button if you like it, and share your views in the comments section.

Critical USDT.D Test: Altcoin Relief or More Pain?USDT dominance is pushing into its long-term trendline resistance again. If this level rejects, it usually signals fresh money rotating back into altcoins.
But if USDT.D breaks out and holds above the trendline, it could put pressure on alts and slow down their momentum.
This is a key spot for the altcoin market.
DYOR, NFA
Please hit the like button if you like it, and share your views in the comments section.

BTC at Risk: Structure Break + RSI Warning$BTC/USDT is showing some concern on the monthly chart as price has broken below the rising wedge and is now retesting a major demand zone. Losing this zone could trigger a deeper correction.
At the same time, RSI is showing a clear multi-year bearish divergence, highlighting weakening momentum.
Until BTC reclaims the wedge support or closes back above the resistance band, downside risk remains elevated.
DYOR, NFA
Please hit the like button if you like it, and share your views in the comments section.

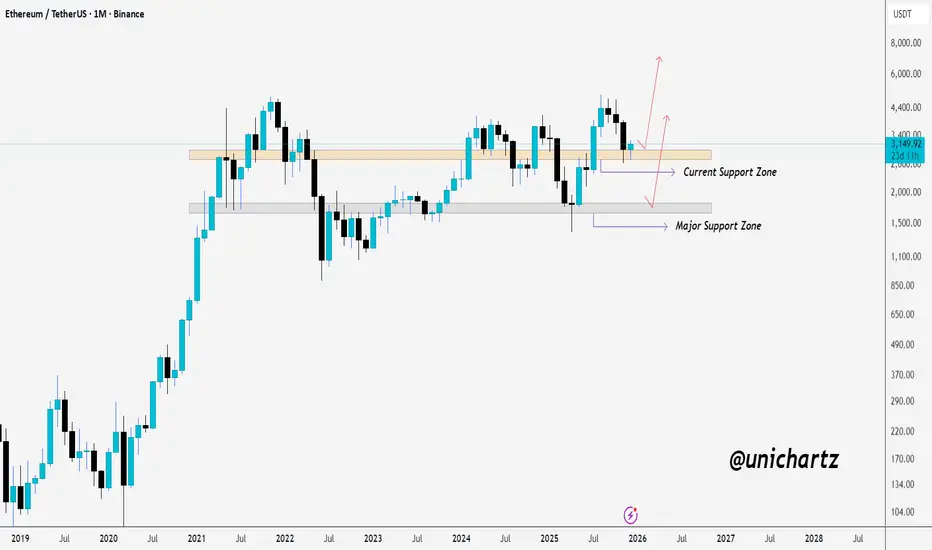
ETH Monthly Structure Intact Above SupportCRYPTOCAP:ETH is holding its monthly support zone once again, showing buyers are still defending this level.
As long as the price stays above this area, the structure favors a bounce toward the upper range.
A breakdown, however, would shift focus to the major support zone below.
DYOR, NFA
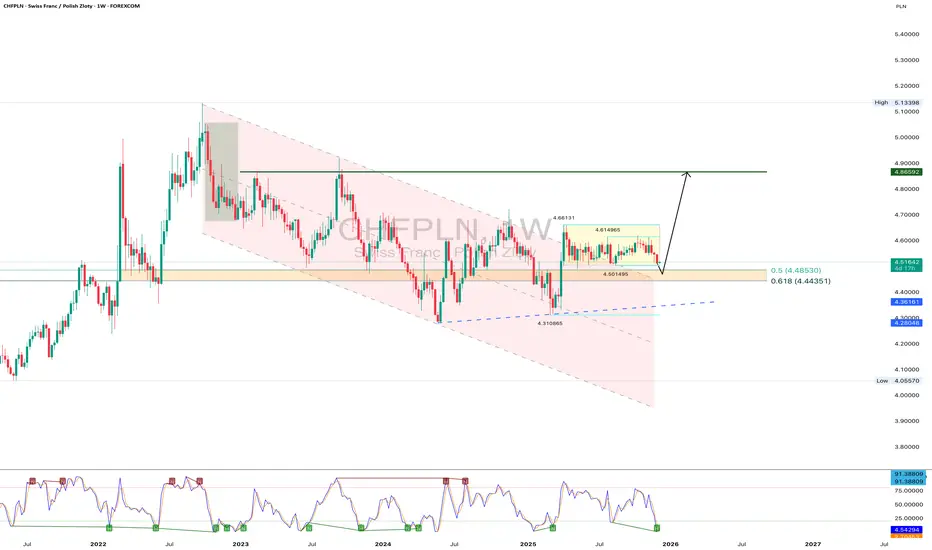
CHFPLN preparing a move or just testing everyone patienceCHFPLN continues to trade inside a developing upward structure after breaking out of a wide descending channel. The current pullback has brought the pair into the demand zone between 4.48 and 4.44 which aligns with the Fibonacci correction range at 0.5 and 0.618. Weekly oscillator divergence signals active buyers defending the lower boundary of the structure. The horizontal level at 4.50 also acts as support increasing the probability of a local reversal. As long as price holds above 4.44 the bullish continuation scenario remains valid. The main target is located near 4.86 which corresponds to the key resistance of the previous pivot. A breakdown of 4.44 may trigger a deeper correction however current price behavior and buyer reaction still favor a recovery.
The market may pretend nothing is happening yet demand zones rarely forget what they are designed to do.
BTC.D Rejected From Key Monthly ResistanceBTC dominance is still sitting below the key monthly resistance zone, showing clear rejection from the top.
As long as dominance stays under this area, it suggests money isn’t aggressively flowing into BTC, leaving room for altcoins to stabilize or gain some strength.
A breakout above the resistance would shift momentum back toward BTC, but for now the structure looks capped below this zone.
DYOR, NFA
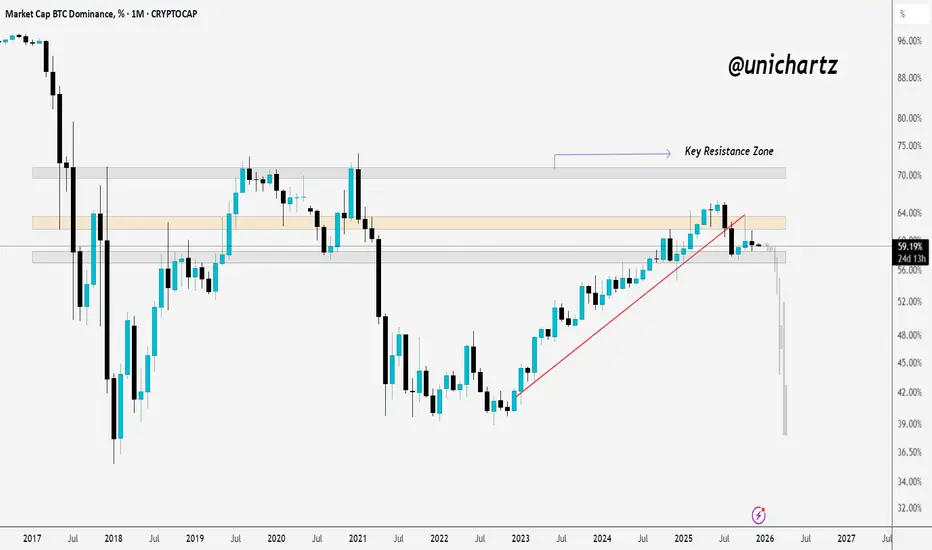
Altcoins Get a Boost as ETH/BTC Breaks StructureETH/BTC breaking out of the falling wedge is a positive sign for the altcoin market.
When this pair starts gaining strength, it usually boosts overall altcoin performance.
If ETH holds this breakout, it could ignite a broader altcoin rotation in the coming sessions.
DYOR, NFA
#PEACE
Please hit the like button if you like it, and share your views in the comments section.

GBPUSD – Institutional Sell Setup | Multi-TF Supply Confluence GBPUSD is approaching a high-timeframe supply zone, aligning with both fundamental headwinds and a clean technical distribution structure. This presents a high-quality 5.06R bearish swing setup, supported by imbalance fill, liquidity sweep, and multi-month supply alignment.
FUNDAMENTAL ALIGNMENT (Why GBP Should Weaken)
1. Diverging Monetary Policy
The Bank of England faces slowing growth and softer inflationary pressure.
The Federal Reserve remains comparatively restrictive, maintaining tighter policy expectations.
This divergence supports USD strength and GBP weakness.
2. UK Growth Momentum Slowing
Recent UK macro data reflects weakening consumer demand and slower business investment.
Markets are pricing in potential BoE easing earlier than expected → bearish GBP.
3. Risk Sentiment Favours USD
In periods of market uncertainty, capital typically flows into USD as a safe haven.
This adds further downside pressure on GBPUSD.
➡ Overall Macro Bias: Bearish GBPUSD
TECHNICAL ALIGNMENT (Why This Chart Is Bearish)
1. Higher-Timeframe Supply Zone (3M + Daily Confluence)
Price previously reacted strongly from the 3-Month supply zone, rejecting the 1.37 region with aggressive selling.
The current rally is a return-to-origin (RTO) into that same supply area.
2. Liquidity Sweep + Break of Structure
The previous swing high was swept, collecting buy-side liquidity.
Price then broke down, confirming major bearish structure.
This shift signals institutional distribution.
3. Clear Imbalance (IMB) Fill Target
Price is retracing toward a Daily imbalance before continuing the downward leg.
This creates a precise entry window within supply.
4. Trendline Manipulation
The ascending trendline was broken aggressively, and price is now forming a corrective pullback—classic institutional pattern before continuation.
5. High-Probability Entry
The entry aligns with:
✔ A retest of Daily supply
✔ IMB mitigation
✔ Liquidity sweep
✔ Bearish orderflow
✔ Trend continuation structure
Risk-to-Reward: 5.06R, offering strong asymmetric payoff.
TRADE PLAN
Bias: Short (Sell)
Entry: Daily Supply Zone (around 1.36–1.37)
Stop-Loss: Above recent swing high
Target: Revisit lower structure around 1.30 and below
R:R: ≈ 5.06R
TRADE MANAGEMENT PLAN (Institutional Framework)
1. Position Sizing & Risk
Risk 0.5%–1% per position (institutional-grade sizing).
If volatility expands near entry, reduce size proportionally.
No additional scaling until price confirms bearish intent.
2. Entry Execution
✔ Primary Entry:
Execute shorts inside the Daily Supply Zone (1.36–1.37), ideally at the mitigation of imbalance.
✔ Alternative Entry (Confirmation-Based):
If price shows:
rejection wicks
displacement to downside
BOS (Break of Structure) on LTF
then enter on the first pullback.
This allows flexibility while protecting against premature entries.
3. Stop-Loss Management
Initial SL remains above the liquidity sweep / swing high that anchored the distribution (structural invalidation).
Do not tighten SL before price confirms a macro shift, to avoid knockouts during liquidity grabs.
4. Scaling Strategy
No scale-in inside the supply zone (high manipulation area).
Scale-in only after confirmation, such as:
Clear bearish displacement
Lower timeframe BOS
Retest of broken structure
This maintains institutional discipline and preserves risk integrity.
5. Profit Taking Strategy
Use a systematic approach:
TP1 – Partial at 1R
Lock in early profit
Move SL to breakeven only after a clean break of structure (to avoid stop hunts)
TP2 – Major Target at the IMB Fill / Mid-Structure Area
Partial profit where price may temporarily react
Maintain runner for full swing move
TP3 – Final Target at 1.30 (Swing Objective)
This is the full 5.06R target
Exit remaining position here
Structure completes the macro bearish leg
6. Monitoring & Adjustment
Track key things:
A. Fundamentals
BoE statements
Fed policy tone
UK inflation and employment releases
If fundamentals shift toward GBP strength, consider tightening risk.
B. Price Behaviour
If price reclaims the supply zone and holds above structure → invalidate trade
If price consolidates under supply with weak bullish reaction → confirmation of bearish intent
7. Invalidation Criteria (Hard Exit)
Close the trade entirely if:
Daily closes above the supply zone
Structure forms a higher-high and invalidates the distribution
USD loses strength due to major macro shift (e.g., unexpected Fed easing)
No hesitation—professional traders exit mechanically based on rules.
8. Psychological Management
Expect volatility inside supply zones
Avoid emotional management (e.g., moving SL impulsively)
Follow your plan: execution > prediction
Focus on process, not outcome
9. Post-Trade Review
After completion of the 5.06R idea:
Archive chart
Record execution quality
Review entry precision, SL placement, and emotional discipline
Optimize model for future setups
Institutional traders always debrief.
Final Notes
This trade idea is built on multi-timeframe confluence, institutional orderflow, and macro alignment.
The setup remains valid as long as price stays below the Daily/3M supply structure and bearish orderflow persists.

SOL Near Inflection PointCRYPTOCAP:SOL is holding well above the mid S/R zone and showing solid strength. If it continues to rebound from this area, price could push back toward the upper resistance.
But if SOL breaks below this zone, it may slide down toward the $80 levels.
DYOR, NFA
Please hit the like button if you like it, and share your views in the comments section.

LINK Showing Strength at Long-Term Support ZoneBIST:LINK is bouncing cleanly from its long-term weekly trendline support, keeping the bullish structure intact.
Price is still moving inside a large wedge, and if this rebound continues, a retest of the upper resistance line is likely.
A breakout above that level could open the door for a stronger move.
DYOR, NFA
Please hit the like button if you like it, and share your views in the comments section.

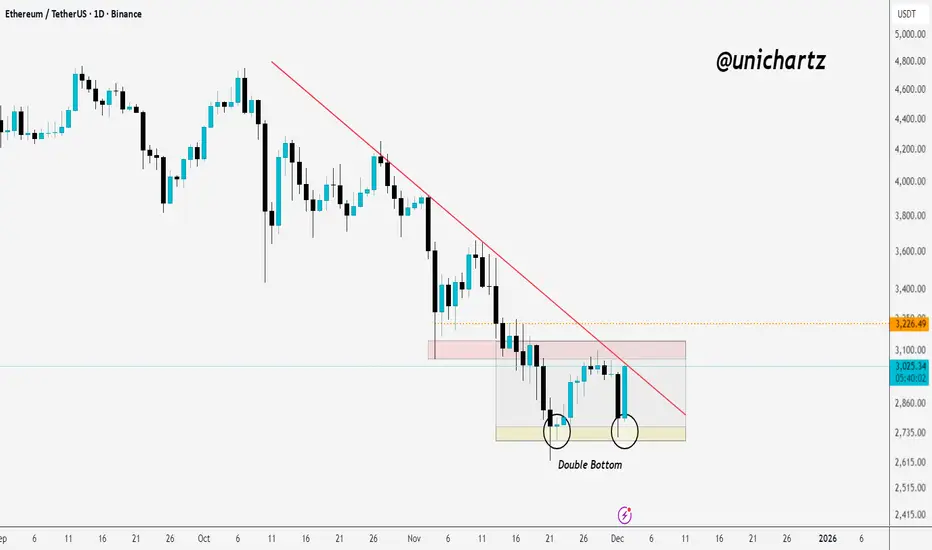
ETH Daily Structure Turning Bullish?CRYPTOCAP:ETH has formed a clear double-bottom pattern on the daily timeframe.
A breakout above the trendline and the consolidation zone would be a strong signal of a potential trend reversal.
Keep an eye on this setup, it could turn bullish quickly if confirmed.
DYOR, NFA
Please hit the like button if you like it, and share your views in the comments section.
AUDCAD – H4 | 02-12-2025 Wave 3 is back in playAUDCAD – H4 | 02-12-2025
Wave 3 is back in play
A clean Elliott Wave reaction once again.
Following the previous update, price extended lower to 0.90565, completing the blue wave 5, thereby finishing white wave C of yellow wave Y, and simultaneously confirming the completion of the red wave 2 corrective structure.
From the 0.90565 low, the market has rallied strongly into yellow wave 1 of red wave 3. Within this advance, the internal structure of yellow wave 1 is unfolding as a clear five-wave impulsive sequence in white, and price is currently progressing through white wave 5.
Price may push slightly higher to finalize this five-wave structure of yellow wave 1 before entering a corrective pullback as yellow wave 2.
Primary Plan
Wait for yellow wave 2 to complete, then look for long opportunities aligned with the powerful yellow wave 3 of red wave 3.
Invalidation
A break below 0.90565 would invalidate the count and require reassessment.

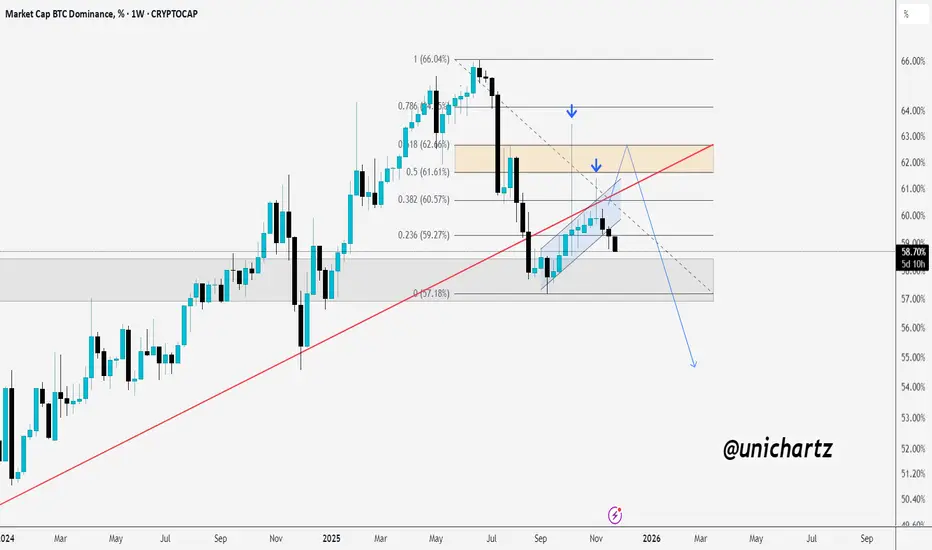
BTC.D Pullback Could Open Doors for AltsBTC dominance has broken below its long-term trendline and is currently holding near the 58–59% support zone, but momentum still appears weak.
The key resistance area sits between 61% and 62.5%, and any retest of this zone may struggle to break higher, especially with its alignment to major Fibonacci levels.
If BTC dominance fails to reclaim this zone with strength, the broader structure points toward continued downside, potentially targeting the 57% level and possibly lower if that support breaks.
A continued decline in dominance would generally favor altcoins, so it’s best to wait for clear confirmation before making any decisions.
DYOR, NFA
Please hit the like button if you like it, and share your views in the comments section.