Bitcoin Eyeing $108K ZoneCRYPTOCAP:BTC Daily Chart Analysis
Bitcoin is currently trading around $110,300, showing weakness after failing to hold higher levels. The market structure still looks corrective, and we can see price slowly drifting toward the nearest support zone around $108,000–$109,000.
If this zone holds, we might see a short-term bounce or relief rally. But if the market breaks below $108,000, the next major demand area lies near $104,000–$100,000, where buyers are likely waiting.
For now, the key is to watch how price reacts at this support. A strong bounce could confirm accumulation, while a breakdown might trigger deeper correction before any new bullish leg.
DYOR, NFA
Fxtrading

Altseason on the Horizon?Technically, BTC Dominance has retested the breakdown of the rising channel, confirming a clean rejection from the retest area.
If price manages to break below the current support zone, we could see a strong shift toward altcoins as capital starts rotating out of BTC.
This recent move also flushed out over-leveraged traders, resetting market positioning, a healthy sign before the next major leg.
Stay patient and always analyze your risk before entering any position. The next few weeks could be decisive for the altcoin market.
DYOR, NFA
Stay tuned for more update
THANKS FOR THE READING
#PEACE

Rebound in Motion: XLM Eyes Channel Top AgainCRYPTOCAP:XLM has bounced strongly from the lower trendline and re-entered the channel.
This move shows clear buyer strength and a potential shift in short-term momentum. As long as XLM holds within the channel, a retest of the upper boundary looks likely.

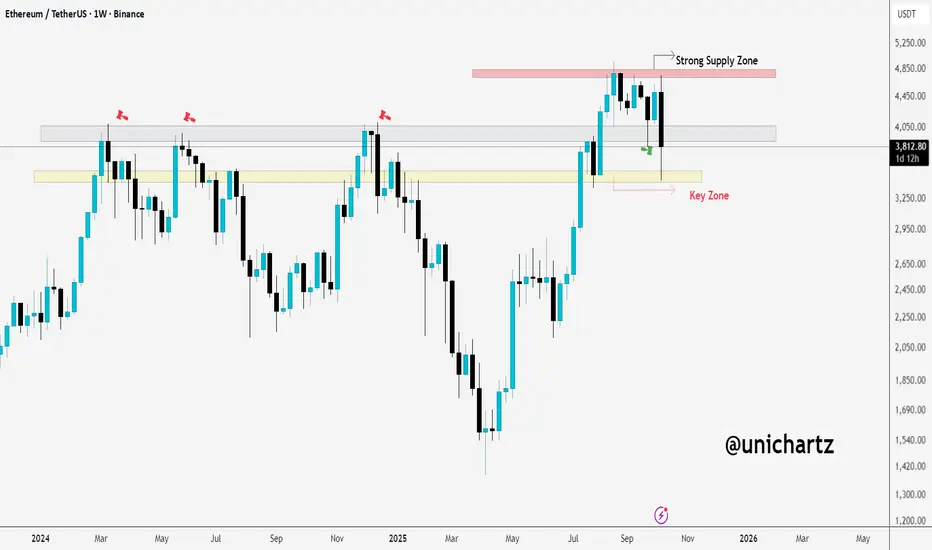
ETH in Danger: Breaking Below $3,200 Could Signal Bigger DropCRYPTOCAP:ETH is facing rejection from the strong supply zone around $4,800. The weekly candle failed to hold above that level and is now pulling back towards the key demand zone between $3,200–$3,300.
If the price fails to reclaim this support, we could see a more bearish scenario unfolding.
DYOR, NFA
Thanks for the reading
USDCHF 1D – the dollar wakes upAfter a long decline, the pair finally shows some life - on the daily chart we have a clean breakout from the falling wedge followed by a retest.
Price now holds inside the buy zone (0.795–0.803) - the perfect base for a potential bullish move.
Technically, the setup looks solid:
✅ breakout confirmed
✅ retest completed
✅ volume rising
✅ momentum turning bullish
The first resistance sits at 0.808, where a minor pause could appear.
If buyers hold control above that level - the path to 0.823 (1.618) and later 0.848 (2.618) opens up nicely.
Structure remains bullish as long as the buy zone stays intact.
And remember: you don’t fight the wedge - you ride the breakout.

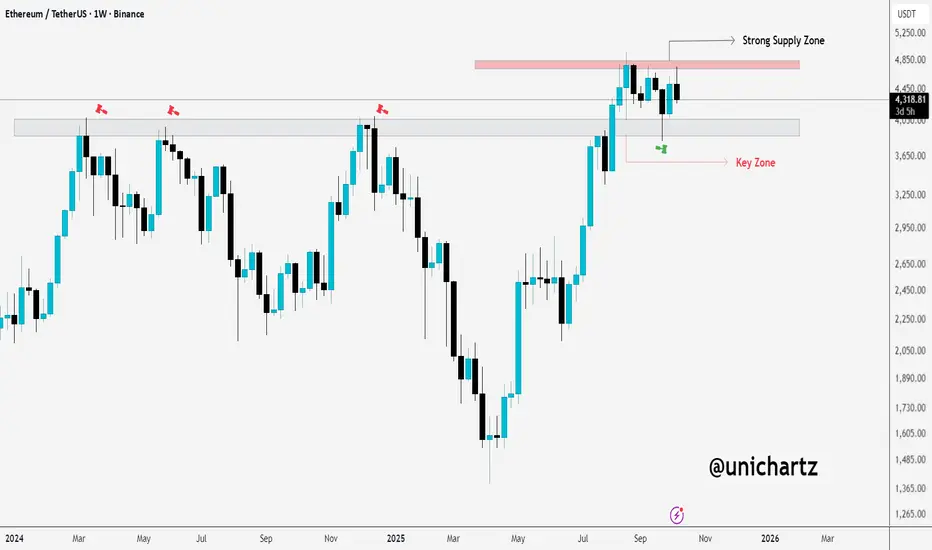
ETH at Critical Support: Can $3,850 Hold?CRYPTOCAP:ETH has faced a sharp rejection from the supply zone around $4,800 and is currently trading near $4,100. There's another strong support zone around $3,850.
I'm personally expecting a sharp rebound from this level. However, if the price fails to hold, we could see a further decline towards $3,600.
DYOR, NFA

BTC Dominance: Key Levels to WatchAfter the recent correction, BTC dominance is bouncing from the support zone at 59.64%. It looks like BTC dominance will likely retest the nearest resistance zone before any further downside.
If BTC.D breaks above this resistance, we could see more pressure on altcoins.
However, a rejection from this resistance zone could signal some relief for altcoins, giving them a chance to recover.
#PEACE
THANKS for the Read

TAO Surging Towards $415WRITE ANALYSIS
ChatGPT said:
TAO is approaching a critical resistance level near $415 after breaking above the descending trendline. This could lead to a test of the key zone, which has been a significant resistance in the past.
A successful break above this level might fuel further upside potential, while rejection could push the price back toward the support zone around $350–$375.
Keep an eye on price action around the key levels for potential breakout or pullback.
DYOR, NFA

GBPUSD Harmonic Analysis – Bullish OutlookOn the 1H timeframe, GBPUSD has completed a Deep Crab harmonic pattern, reaching the extended 2.000 Fibonacci leg – a strong reversal zone within the pattern structure.
Price has reacted at the potential XA completion point, showing early signs of accumulation around 1.3297 support.
With both T1 (1.3377) and T2 (1.3432) lining up as harmonic targets, bullish momentum could develop as the market transitions from the markdown to the markup phase.
If buyers maintain structure above the recent low, a recovery towards these targets remains in play.
Bias: Bullish
Targets:
T1: 1.3377
T2: 1.3432
Invalidation: A clean break below 1.3270 would invalidate the pattern and shift bias back to bearish.

$HYPER Near Demand Zone$HYPER is currently retesting its key support trendline after a steady uptrend.
If this zone holds, a rebound looks likely, but a breakdown could trigger deeper correction toward the S/R zone.
DYOR, NFA

ETH: Critical Levels to Watch Now!The chart shows Ethereum ( CRYPTOCAP:ETH ) on the weekly timeframe, and we're currently at a crucial point. Ethereum is approaching a strong supply zone around $4,800, which has acted as a resistance level in the past. This suggests that the price could face selling pressure in this range. If Ethereum fails to break through this level, it might experience a pullback or sideways movement.
On the other hand, the key zone around $4,100 is providing current support. As long as this level holds, there is potential for Ethereum to attempt another move upwards toward the supply zone at $4,800. However, if the price breaks below this key support zone, we could see a deeper pullback, possibly targeting lower support levels.
#PEACE
Stay tuned for more update
High in for the Euro?I know many people have been bullish on EURUSD going forward thinking that it's going to keep gaining against the dollar, but I have a very different long-term view.
I think that this level between 1.16 - 1.19 marks the top of the cycle and then we'll see lower prices against the dollar moving forward from here on out.
Why do I think that?
Well if we look at a long-term price chart, you can see that price broke down from a 30 year uptrend in 2021 and it's now retesting the level it broke down from as resistance.
If it can't break above the levels on the chart, then the most likely path is down.
I think the downtrend will end at the bottom support. This will likely take years to play out.
So let's see how it progresses over time.

ADA Multi-Year Downtrend Nearing EndCardano CRYPTOCAP:ADA is forming higher lows and looks ready for a big breakout once it moves above the red resistance line. Price is currently in the accumulation zone, which means smart money might be loading up here.
Plan:
Buy Zone: Between 0.75 and 0.88
Stop Loss: Below 0.66 (if it drops there, the setup fails)
Targets:
TP1: 1.09
TP2: 1.35
TP3: 1.70
TP4: 2.18
TP5: 3.10
Strategy:
Start with a small position here. Add more only after a confirmed breakout above 0.90.
Once the first target hits, book some profits and move your stop loss to entry.
Note:
This is a long-term setup, could take several months to play out. Always do your own research (DYOR).

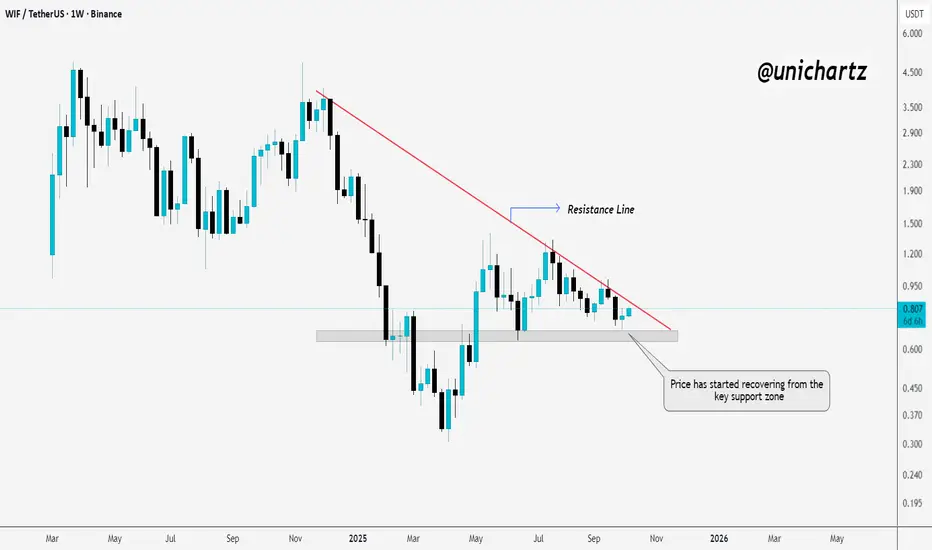
WIF Weekly Reversal SetupSEED_WANDERIN_JIMZIP900:WIF is showing early signs of strength after bouncing from the key support zone.
A breakout above the descending resistance line could confirm a fresh bullish wave.
DYOR, NFA
#PEACE
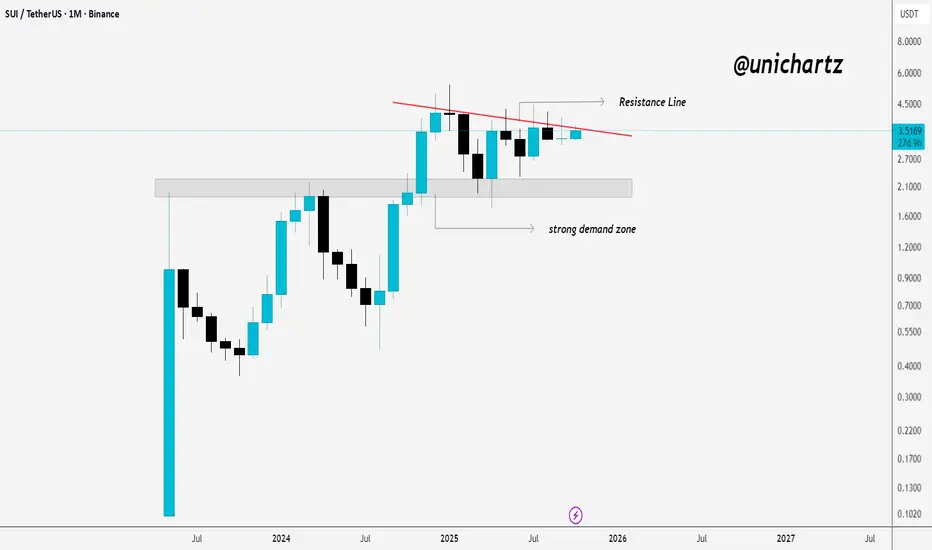
SUI Testing Monthly Resistance$SUI/USDT Monthly Chart
SUI is holding firm above the demand zone near $2.2, showing solid buyer interest. Price is now testing a descending resistance line that has capped previous rallies.
A monthly close above $3.8–$4 would signal a potential breakout and shift momentum toward the $5 zone. Until then, pullbacks to the demand area remain healthy for accumulation.
DYOR, NFA
$PUDGY: Watching for Flag Breakout
The CSECY:PENGU is still contained within the flag pattern, following a strong rally. While there’s upward momentum, the breakout hasn’t fully occurred yet.
Key points:
Resistance: Watch the 0.032 area as the flag's upper boundary. A breakout here could confirm a continuation of the bullish trend.
Support: The 0.026 support zone remains crucial. If price holds here, it could set up for another push higher.
For now, the price is stuck in the flag pattern, with the breakout above resistance being the next key move.
Follow us and stay tuned for more updates.
#PEACE
DYOR, NFA

BNB Soars Above Key SupportLooking at this $BNB/USDT chart, here's a more concise breakdown:
Rising Support: The red line shows a strong support level that has held up since 2018, with the price bouncing off it several times, confirming its importance.
Accumulation Zone: Between 2020 and 2021, BNB traded sideways, building up buying pressure before the next move.
Breakout: After the accumulation phase, BNB broke out sharply, signaling the start of a strong upward trend.
Current Trend: The price is now above the rising support line, and the bullish momentum seems to be continuing, suggesting further potential upside.
In short , BNB is in a solid uptrend, with a key support line holding strong. The breakout indicates more gains ahead if the trend continues.

Price Poised for Bullish Flag Surge!$XRP/USDT chart shows an accumulation phase from April to June, followed by a breakout in July. Price is now testing a key zone, acting as support. If it holds, we could see more bullish momentum, especially with the triangle breakout. A break above 3.20 signals further upside.
If not, a retest of lower levels like the accumulation zone is possible. Watch for confirmation at this level.
DYOR, NFA

Silver Rally Faces Profit-Taking PressureSilver has staged a strong rally throughout September, pushing prices into overbought territory across the daily, weekly, and monthly charts. As the month comes to a close, the market is showing signs of exhaustion, with traders likely to engage in profit-taking, a pattern often seen after extended bullish runs.
The key resistance remains at USD 47.50, a level that has capped upside momentum in the past. Failure to decisively break and hold above this zone could pave the way for a corrective retracement. A natural pullback toward USD 42.00 appears likely, as this level previously acted as a strong technical pivot and now serves as the next major support.
Other factors are adding to the case for near-term weakness:
- Strong U.S. dollar performance is creating headwinds for precious metals, limiting further upside in Silver.
- Bond yields ticking higher reduce the appeal of non-yielding assets like Silver, especially after an extended rally.
- From a technical perspective, momentum oscillators show overbought readings, reinforcing the risk of a corrective move.
- Seasonally, the end of the month and quarter often brings portfolio rebalancing and profit-taking, which could accelerate downside moves.
While the long-term trend for Silver remains constructive, traders should be cautious in the short term. Unless Silver breaks above USD 47.00 with conviction, a deeper retracement toward USD 42.00 or even lower levels cannot be ruled out.

ETH Price Action Looks Heavy – Danger Ahead?This chart is showing a clear pattern of accumulation followed by decline. Every time price moves sideways in a box range, instead of breaking upward with strength, it rolls over into another drop.
What this tells us is that the market is using these sideways phases as resting points for sellers to reload, not buyers to take control. Until CRYPTOCAP:ETH can break out of this cycle and hold above one of these consolidation zones, the overall trend remains heavy to the downside.
DYOR, NFA
#PEACEFUL
Follow for more updates and market insights on TradingView

Ethereum’s $4K Battle: What's Next?CRYPTOCAP:ETH is currently retesting a strong support level on the weekly timeframe, previously acting as resistance, around the $4,000 mark.
If Ethereum holds this support, we could see a potential bounce back towards higher levels. However, if the price fails to hold, further downside may test lower support areas.
This could be a pivotal point for Ethereum’s next move, so monitoring this zone is essential for short- or long-term strategies.
DYOR, NFA
#PEACE

Bitcoin Drops Below $108.6K — What’s Next?
Bitcoin was holding near $115K, but now it's fallen below the $108.6K level. The next support is around $105K. If that breaks, we could see further downside toward $100K.
To turn bullish again, Bitcoin needs to reclaim $112K as support. If that happens, it could retest $115K–$120K.
#PEACE

PEPE Hold This Zone or Risk Heavy DropCRYPTOCAP:PEPE is currently sitting at the mid S/R zone after a series of rejections from the upper resistance area. This zone is acting as a key decision point, holding here could trigger a bounce back toward the higher range, while losing it might drag price down toward the major support zone below.
In short, PEPE is in a make-or-break area. Buyers need to defend this mid zone to keep momentum alive, otherwise the chart risks rolling over toward deeper support.
DYOR, NFA
#PEACE
