Possible Mega Gap Fill Based On Price Action OnlyDescription: According to historical price action market data market like to fill gaps from 2000 to 2003 and from 2007 to 2009 as you can see all previous gaps was filled, but this huge gap has been never fill and now is possible to be filled. the same price action is on Down Jones, NASDAQ, NIFTY which is India Index, SSE which is China Index, DFMGI which is (UAE), NI222 which is Japan Index and IMOEX which is Russian index they all show similar price action
Possibility but is not guaranteed: If all this markets decide to fill all this mega gaps the following is possible to happen but is not guaranteed
Down Jones: -99.55%
NASDAQ: - 93.89%
NIFTY: - 95.63%
SSE: - 89.84%
DFMGI: - 64.67%
NI225: - 77.12%
IMOEX: -96.37% Which is currently fell with 53.00%
Examples: You can use Facebook and PayPal as an example or historical price action market data as examples for a mega gap fill which happened this year.
Warning: This is not a Financial Advice nothing is guaranteed I am not a financial expert or financial adviser
I am not saying that this will happen I am not saying that this can happen
what I'm only saying is According to historical price action market data
Which gap in past was filled is possible current mega gap to be filled also this is what I'm saying.
Gapfill

Netflix Eyes the GapDoes anyone remember Netflix? After losing three-quarters of its value between November and May, the streaming-video stock may be trying to claw its way back.
The first pattern on today’s chart is the bearish price gap on April 20 after the business unexpectedly lost subscribers. NFLX drifted for months after the selloff but is now inching back toward that area. Traders may look for price to fill the gap.
Second is the tight price action since the subsequent report on July 19. Notice how pullbacks like July 22-26 have been very shallow, with NFLX remaining above its 8-day exponential moving average (EMA). That may suggest buyers outnumber sellers.
This is also potentially seen in the relative strength index (RSI) holding against the edge of an overbought condition.
Finally, you have the 50-day simple moving average (SMA). This line helped mark the uptrend a year ago, and the downtrend since December. NFLX has been above it for almost four weeks, which may also indicate a change in direction.
TradeStation has, for decades, advanced the trading industry, providing access to stocks, options, futures and cryptocurrencies. See our Overview for more.
Important Information
TradeStation Securities, Inc., TradeStation Crypto, Inc., and TradeStation Technologies, Inc. are each wholly owned subsidiaries of TradeStation Group, Inc., all operating, and providing products and services, under the TradeStation brand and trademark. You Can Trade, Inc. is also a wholly owned subsidiary of TradeStation Group, Inc., operating under its own brand and trademarks. TradeStation Crypto, Inc. offers to self-directed investors and traders cryptocurrency brokerage services. It is neither licensed with the SEC or the CFTC nor is it a Member of NFA. When applying for, or purchasing, accounts, subscriptions, products, and services, it is important that you know which company you will be dealing with. Please click here for further important information explaining what this means.
This content is for informational and educational purposes only. This is not a recommendation regarding any investment or investment strategy. Any opinions expressed herein are those of the author and do not represent the views or opinions of TradeStation or any of its affiliates.
Investing involves risks. Past performance, whether actual or indicated by historical tests of strategies, is no guarantee of future performance or success. There is a possibility that you may sustain a loss equal to or greater than your entire investment regardless of which asset class you trade (equities, options, futures, or digital assets); therefore, you should not invest or risk money that you cannot afford to lose. Before trading any asset class, first read the relevant risk disclosure statements on the Important Documents page, found here: www.tradestation.com .

BUY THE GAPBTC TO $9735
CME GAP TO FILL FROM JULY 2020 THROUGH SEPTEMBER 2020
Will it be a quick wick or will we need to range here?
Lot of GAP news lately....
No leader
Kayne got the GAP on his perfectly black hoodie covered shoulders for now.
New Leader incoming.
The GAP will be back in September...
www.cnn.com
www.complex.com

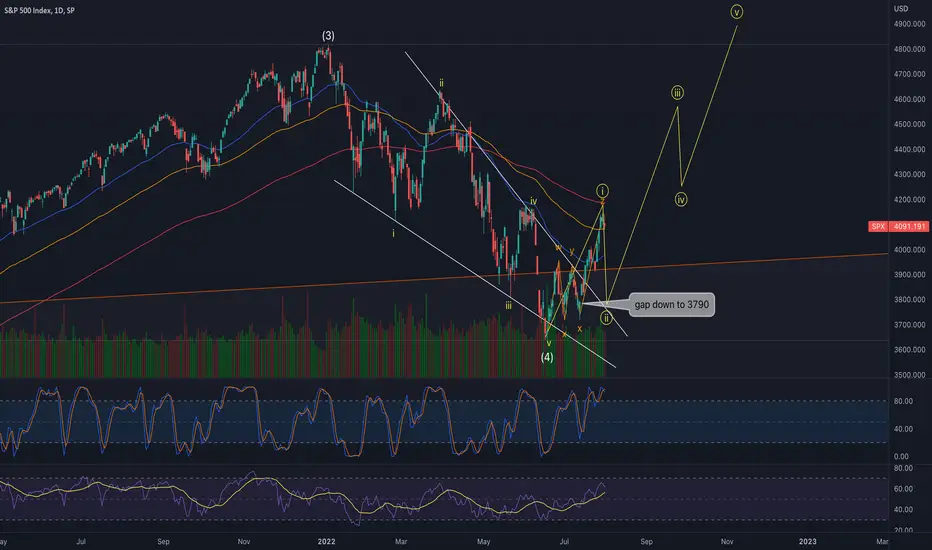
SPX500Seems like the perfect time to fill the gap down to 3790 retest the breakout of the leading diagonal and confirm wave 2 is what we want to see.
Pelosi in Taiwan today and China about to fail to start WW3 IMHO. ;)
Bullish Cypher/Shark on IntelIntel has Recovered a Downside Gap on the Daily and in the process of doing so has also created a Gap down and left a huge Gap yet to be Recover to the Upside. Suspiciously this has all happned near the Pattern Completion Zone of this Potential Bullish Cypher and leads me to believe that this is where intel will begin a Bullish rally to take us to the $50-$60 area.

#Ethereum CME Future - perfect price reactions #ETHEthereum CME Future - perfect price reactions at volume profile
This could be seen on the predicted volume resistance and on current daily candle
The daily close will be very important - maybe we see a nice Hammer or Doji
Bulls will hope for magnetic CME gap attraction at $2.594 - $2.677
$1.565 is the next lower volume profile support dear Crypto Nation
*not financial advice
do your own research before investing

RBLX finally broke outRBLX broke out after over a month of accumulation and chopping around 40-43.
Next targets are the supply zone around 50 and then gap fill around 59 and 200SMA around 61. Gap goes up to 66 so it's possible the stock will rally up there. We also have earnings on August 9th.

Ethereum ETH - after the gap is before the gapEthereum - after the gap is before the gap
Nice pumps all over the Crypto World - especially for ETH
I am still kind of suspicious since economy is NOT healthy at all
But in a bullish scenario ETH might try to close a gap from May 9th that falls together with FIB golden pocket at $2.594-$2.677
But the way till there is long - give me your thoughts
*not financial advice
do your own research before investing

Ethereum ETH - BULL and BEAR CME gap scenarioEthereum ETH - BULL and BEAR gap scenario
We see a green candle today so far (FOMC meeting incoming !!)
As far as this candle is in the gray inside box I would stay on the sideline
bullish:
a daily candle close above the gray box at $1.513
more bullish:
a daily candle close above the closed gap at $1.663
bearish:
a daily candle close within the green box (open gap) below $1.359
more bearish:
a daily candle close below the lower gap border at $1.266
*not financial advice
do your own research before investing

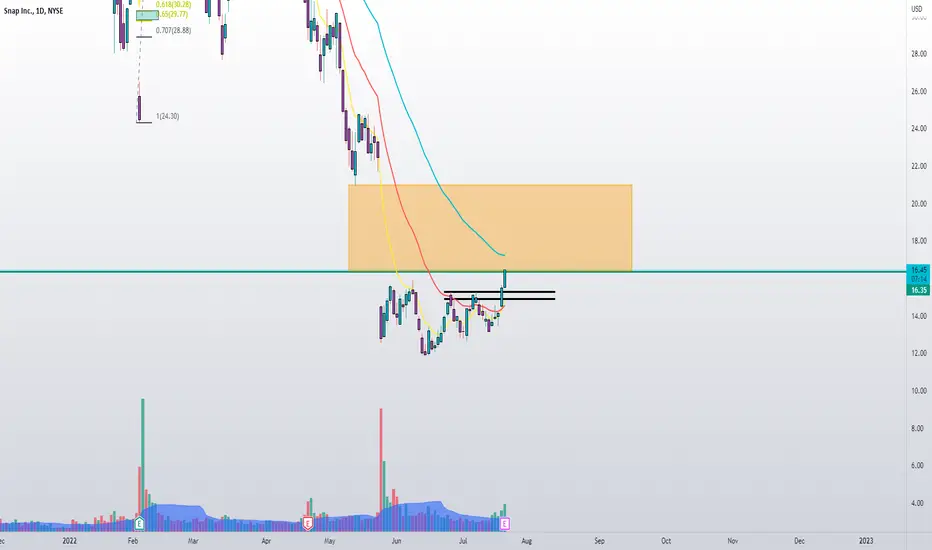
SNAP Gap fillSNAP is entering a gap fill area.
Could see $20 very quickly.
Does report earnings tonight, so gotta be careful
Bitcoin Futures-Gap Check MapBitcoin came nicely down, into the gap seen in Dec 2020. These gaps firstly act like a magnet but once they are filled, the reversal can occur as new orders are triggered in that area which can have an impact on price. So far, we can see a nice turn-up, with the next open gap from here at 28-29k.

Last BTC1 Gap from 12/2020 Filled w/ Current Bottom approx 18.5KSo... I guess gaps DO get filled, the last one I stumbled upon on the Daily CME BTC1 chart from 12-14-2020 at about 18.5K highlighted gaps on way up that have now been filled...
Crazy...but numbers don't lie

Ethereum - CME gap effectsEthereum - CME gap effects
Gaps typically have a memory effect - prices come back
But several reaction can be seen... e.g.
- price finds resistance / support and gap is not closed - here $1.474 and $1.359
- price closes the gap - here $1.663 and $1.266
What will ETH do now dear Crypto Nation?
*not financial advice
do your own research before investing

Gap fill Completed on DraftkingsIf you played any calls the last couple days with Draftkings you certainly made a nice chunk of change. Especially if you entered before the gap up.
lets not forget the 3 soldiers candle pattern that followed after the gap up!

Taiwanese Semiconductors: Piercing Line Visible on the WeeklyWe have a Textbook Confirmed Piercing Line Visible on the Weekly on the Taiwan Semiconductor Manufacturing Company I was made aware of this a few days ago but opted to wait for the earnings report before taking action. We got a positive report so I am now taking action and my Bullish Target for TSMC will be around $100-$110 to fill the Gap Visible on the Daily Timeframe.

$SPY long- gap fill, top of bullish channel$SPY long - looking for bounce off the bottom of bullish channel, max target is gap fill at around $400

DJI will have some hurdles next week.Hello Friends!
I believe DJI has more downside. Currently, it’s trading in the channel that was developed in 2009 to current. Week of June 13th it tested the bottom of the channel at 29653. Now it’s approaching strong resistance at 31533. Going into next week I think any negative news can push this out of this channel and on its way to test the 28495-28902 gap.
As always thanks for your follows, likes, and comments. Let’s learn and grow together. Cheers!
*This information and publication is not meant to be, and do not constitute, financial, investment, trading, or other types of advice. Do your own research.

Part II Of SPY Review From June 9th Through June 17thSPY filled the GAP between 383-389 then retraced after the last sell climax on Jun 17th.
Traders should have gotten prepped for a long position.
Once prices entered an accumulation range, that was a signal to get long.
On June 27th the 1st GAP was filled.

$RDUS potential gap fill$RDUS has some tight price action under a key pivot, which if it breaks through could fill quite a large gap. This sector is strong and this stock is showing good relative strength along with signs of accumulation
RLong

guessing a gap down will be for buyinga gap down in the nasdaq makes the most sense to me at this point, and i would guess that if we buy that up and defend the $23- high $22s we sould revisit TRAMA and get VWMA to change directions targeting high $23s - low $24s which is also around the .618 of the daily bounce retracement

Possible AMZN short setupHey guys,
I've been noticing that AMZN has been repeating the redistribution pattern it made leading up to its rally and subsequent dump in March of this year. Considering the fact that other market-moving names are doing similar things(AAPL, MSFT, NVDA), I am currently anticipating a rally up to the high 130's where I believe AMZN will top out and possibly head to the $80's. Mind you AMZN is still in a macro downtrend following a standard, year+ long Wyckoff distribution pattern and would be significantly overvalued at ~$138/share. In short, if it does rally up to fill the previous gap, there would be little to suggest that it would not reject and head for new lows.
P.S.
Do take what I am saying with a grain of salt as I believe we're at the end of a market cycle(midst of a crash) and are in the process of redistributing before another leg down.

Joe Gun2Head Trade - Gap fill on NASDAQTrade Idea: NASDAQ
Reasoning: Gap fill on NASDAQ
Entry Level: 11797
Take Profit Level: 11035
Stop Loss: 11905
Risk/Reward: 6.83:1
Disclaimer – Signal Centre. Please be reminded – you alone are responsible for your trading – both gains and losses. There is a very high degree of risk involved in trading. The technical analysis , like all indicators, strategies, columns, articles and other features accessible on/though this site is for informational purposes only and should not be construed as investment advice by you. Your use of the technical analysis , as would also your use of all mentioned indicators, strategies, columns, articles and all other features, is entirely at your own risk and it is your sole responsibility to evaluate the accuracy, completeness and usefulness (including suitability) of the information. You should assess the risk of any trade with your financial adviser and make your own independent decision(s) regarding any tradable products which may be the subject matter of the technical analysis or any of the said indicators, strategies, columns, articles and all other features.
NShort

NQ Power Range Report with FIB Ext - 6/24/2022 SessionCME_MINI:NQU2022
- PR High: 11715.00
- PR Low: 11686.50
- NZ Spread: 63.50
Evening Stats (As of 1:00 AM)
- Weekend Gap: = -0.74% (last week - filled)
- Session Open ATR: 408.50
- Volume: 39k
- Open Int: 247k
- Trend Grade: Bear
- From ATH: -29.5% (Rounded)
Key Levels (Rounded - Think of these as ranges)
- Long: 12390
- Mid: 11820
- Short: 10680
Keep in mind this is not speculation or a prediction. Only a report of the Power Range with Fib extensions for target hunting. Do your DD! You determine your risk tolerance. You are fully capable of making your own decisions.
