GBPUSD on a multi-year decline that's far from being over.The GBPUSD pair is currently on a 5-week rebound following the November 03 Low just below its 1W MA50 (blue trend-line). Despite this short-term reaction, the general long-term trend remains bearish following the June 30 2025 High.
That High started a Double Top sequence that is similar to both previous Cycle Tops since January 22 2018. Even though this latest one didn't take place exactly on the Lower Highs trend-line, it was priced on the closest level to the 1M MA200 (red trend-line) since September 2014.
At the same time, the 1W RSI printed the exact same 8-year Resistance Zone rejection pattern as the previous 4 times. Based on the previous 2 Cycles, we expect the 1st Leg of this long-term correction to approach the 1W MA200 (orange trend-line) on a -7.64% (minimum) drop, targeting 1.2750. Then after a bounce to retest and get rejected on the 1W MA50, we expect it to aim then 9-year Symmetrical Support Zone at 1.2100.
---
** Please LIKE 👍, FOLLOW ✅, SHARE 🙌 and COMMENT ✍ if you enjoy this idea! Also share your ideas and charts in the comments section below! This is best way to keep it relevant, support us, keep the content here free and allow the idea to reach as many people as possible. **
---
💸💸💸💸💸💸
👇 👇 👇 👇 👇 👇
Gbp-usd

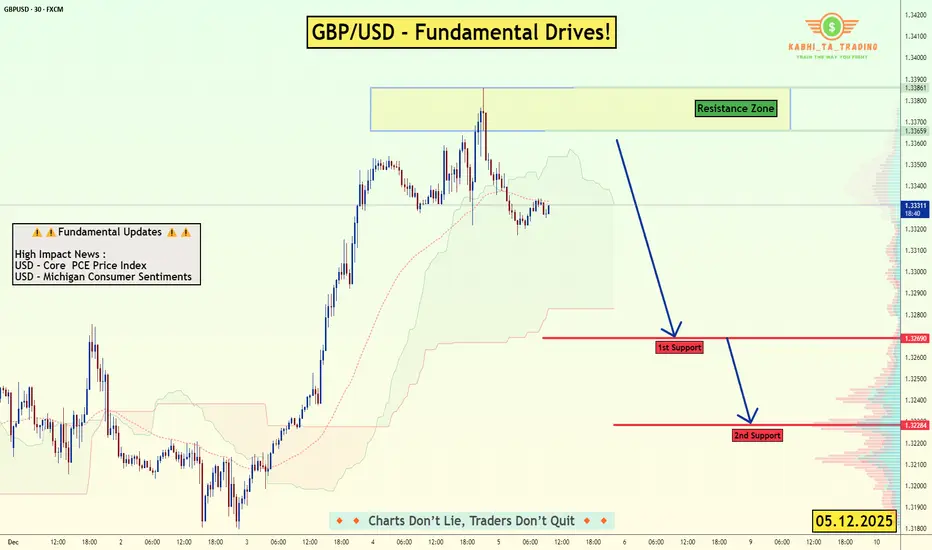
GBP/USD – Fundamentals Drive the Move! (05.12.2025)📝 Description FX:GBPUSD
GBP/USD is currently trading below the resistance zone after failing to hold recent bullish momentum. With USD Core PCE Price Index and Michigan Consumer Sentiment releasing today, the pair may see increased volatility, potentially pushing the price lower if USD strengthens.
A rejection from the resistance zone combined with weakening intraday structure suggests a possible bearish continuation toward support levels.
📌 Key Support & Resistance Levels
🔺 Resistance Zone: 1.3359 – 1.3386
🟥 1st Support: 1.3269
🟥 2nd Support: 1.3228
⚠️ Fundamentals Today
1️⃣ USD – Core PCE Price Index (High Impact)
2️⃣ USD – Michigan Consumer Sentiment (High Impact)
#GBPUSD #ForexAnalysis #PriceAction #Fundamentals #USDNews #TechnicalAnalysis #TradingPlan #ChartAnalysis #FXTrading #TradingView #Kabhi_TA_Trading
⚠️ Disclaimer
This chart is for educational purposes only, not financial advice.
Always use stop-loss and manage position size according to your risk tolerance.
👍 Support the Analysis❤️ Please LIKE💬 Drop a COMMENT
🔁 SHARE if you found this helpful!
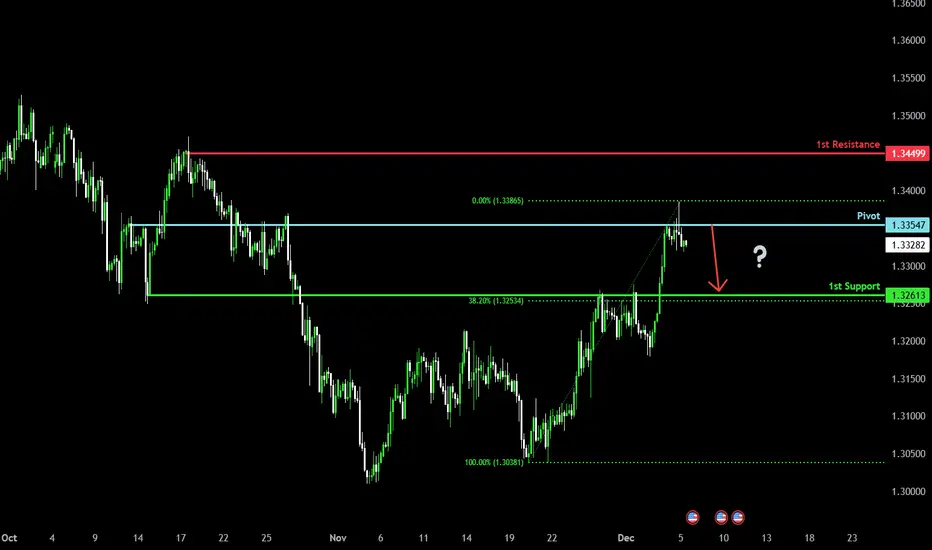
Could we see a reversal from here?Cable (GBP/USD) has rejected off the pivot and could drop to the 1st support.
Pivot: 1.3354
1st Support: 1.3261
1st Resistance: 1.3449
Disclaimer:
The opinions given above constitute general market commentary and do not constitute the opinion or advice of IC Markets or any form of personal or investment advice.
Any opinions, news, research, analyses, prices, other information, or links to third-party sites contained on this website are provided on an "as-is" basis, are intended to be informative only, and are not advice, a recommendation, research, a record of our trading prices, an offer of, or solicitation for, a transaction in any financial instrument and thus should not be treated as such. The information provided does not involve any specific investment objectives, financial situation, or needs of any specific person who may receive it. Please be aware that past performance is not a reliable indicator of future performance and/or results. Past performance or forward-looking scenarios based upon the reasonable beliefs of the third-party provider are not a guarantee of future performance. Actual results may differ materially from those anticipated in forward-looking or past performance statements. IC Markets makes no representation or warranty and assumes no liability as to the accuracy or completeness of the information provided, nor any loss arising from any investment based on a recommendation, forecast, or any information supplied by any third party.
GBPUSD - Bears Loading at a Major Confluence???⚔️GBPUSD is approaching a powerful intersection where the upper blue trendline meets the green supply zone. This area has acted as a strong barrier before, and price is now retesting it from below.
📉If this confluence holds, the bearish pressure is likely to kick back in. As long as the rejection is confirmed, we will be looking for trend-following shorts, with the next objective being the lower bound of the rising channel, where buyers may attempt to step in again.
A very clean and technical setup, now we wait for confirmation. 📉🔥
What do you think, will the supply zone hold, or will GBPUSD break higher this time? 👀
⚠️ Disclaimer: This is not financial advice. Always do your own research and manage risk properly.
📚 Stick to your trading plan regarding entries, risk, and management.
Good luck! 🍀
All Strategies Are Good; If Managed Properly!
~Richard Nasr

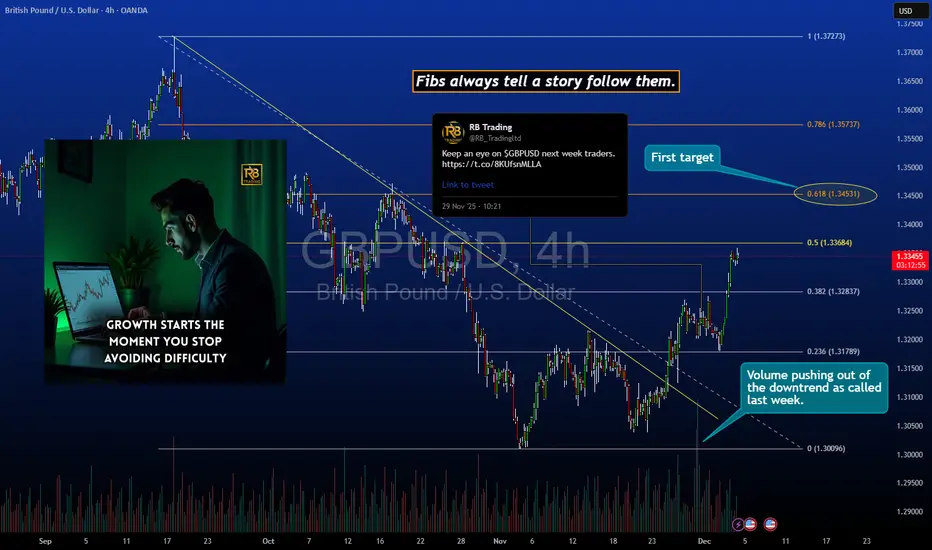
GBP/USD - Daily Downtrend Break Confirmed, Targeting 1.34530GBP/USD Upside Continuation: Breakout from Daily Downtrend Now Targeting 1.34530
Last week's analysis identified GBP/USD breaking out of its daily downtrend structure, and price has confirmed the move with strong follow-through. This update examines the next logical target at the 0.618 Fibonacci retracement level (1.34530) and why geometric levels continue to provide reliable roadmaps in forex price action.
🎯 Trade Update:
Previous Analysis: Daily downtrend break setup
Current Status: Breakout confirmed with momentum continuation
Next Target: 1.34530 (0.618 Fibonacci retracement)
Current Price Action: Advancing toward geometric resistance zone
📊 What Happened Last Week:
The Setup:
GBP/USD was grinding along a multi-week daily downtrend line. Price action showed signs of compression and momentum exhaustion near support, creating a high-probability breakout scenario.
The Call:
Identified the potential for upside breakout from the descending trendline structure, suggesting bullish positioning for the move higher.
The Confirmation:
Price broke above the downtrend with conviction, followed by sustained buying pressure. The breakout has now been validated through both:
Clean break of trendline resistance
Follow-through continuation above the breakout point
No false break or immediate reversal (structure held)
📈 Why 1.34530 Is The Next Target:
Fibonacci Retracement Zone:
The 0.618 level sits at 1.34530, calculated from the recent swing high to swing low. This golden ratio level represents where the current advance would retrace 61.8% of the prior decline—a common reversal or resistance zone.
Why This Level Matters:
Historical price structure shows 1.34530 acted as support/resistance previously
Multiple timeframe confluence (daily and 4-hour charts align here)
Psychological level near 1.3450 attracts institutional attention
Volume profile indicates prior activity concentration in this zone
Geometric Precision:
Fibonacci levels aren't magic they're mathematical representations of natural market rhythm. The 0.618 retracement consistently marks zones where profit-taking and new supply/demand dynamics create price reactions.
🔍 Why Fibonacci Levels Guide Price Action:
Market Psychology:
Traders worldwide use Fibonacci tools, creating self-fulfilling prophecy behavior. When millions watch the same levels, they become magnets for order flow.
Institutional Behavior:
Large funds use algorithmic systems that incorporate geometric retracements and extensions. Their participation at these levels adds liquidity and creates observable reactions.
Natural Market Rhythm:
Markets move in waves impulse, correction, continuation. Fibonacci ratios (0.382, 0.5, 0.618, 1.0, 1.618) mathematically describe where these waves typically pause or reverse.
Historical Validation:
Across all timeframes and instruments, price repeatedly respects these levels. Not every time, but with sufficient frequency to provide edge when combined with structure analysis.
📊 Current Technical Picture:
Trendline Break Confirmed:
The daily downtrend that contained price for weeks has been decisively broken. Price is now establishing higher highs and higher lows—classic uptrend behavior.
Momentum Shift:
Indicators show momentum transitioning from bearish to bullish. The break wasn't a spike and reversal it's sustained directional movement.
Support Structure:
The broken downtrend now acts as dynamic support. Pullbacks toward this area create lower-risk continuation entries.
Volume Confirmation:
The breakout occurred with increased volume, suggesting institutional participation rather than retail speculation.
🎯 Trade Management Framework:
For New Entries:
Pullbacks toward the broken downtrend (now support) offer entry opportunities with tight risk. Wait for price to retest the breakout zone before adding exposure.
For Existing Positions:
First target: 1.34530 (0.618 Fibonacci) - consider reducing partial position here
Extended target: 1.3600+ if price clears 1.34530 cleanly (next Fibonacci extension)
Trailing stops: Move stops to breakeven or above as price advances
Risk Management:
Stop loss below the broken trendline (invalidation of breakout)
If price reclaims the downtrend channel, the bullish thesis is compromised
Position sizing appropriate for forex volatility (leverage discipline essential)
🧠 Why Geometric Levels Work:
They Provide Structure:
Instead of guessing where price "should" go, Fibonacci levels offer objective zones based on mathematical relationships within the price data itself.
They Define Risk:
When targeting 1.34530, you know where the trade invalidates (back inside the downtrend). This allows precise risk calculation.
They Remove Emotion:
Price hits 1.34530 or it doesn't. The level doesn't care about news, opinions, or emotions. This objectivity improves decision-making.
They Stack Probabilities:
When Fibonacci levels align with:
Previous support/resistance
Trendline breaks
Momentum shifts
Volume behavior
...the probability of price reaction at that level increases significantly.
📈 Forex-Specific Considerations:
Session Timing:
GBP/USD sees highest liquidity during London and early New York sessions. Major moves and level tests typically occur during these windows.
Economic Data:
UK and US economic releases can create volatility that overrides technical levels temporarily. Monitor central bank policy and employment data.
Risk Events:
Bank of England and Federal Reserve policy decisions, inflation reports, and geopolitical developments can cause rapid repricing that doesn't respect short-term technical levels.
Leverage Discipline:
Forex allows high leverage. Even with clear technical setups, appropriate position sizing relative to account size is mandatory. One adverse move shouldn't threaten account viability.
📅 Timeframe Expectations:
Not a Sprint:
The move from breakout to 1.34530 may take days or weeks depending on momentum and intermediate profit-taking.
Retest Probability:
Price often retests the breakout level (former downtrend resistance, now support) before continuing higher. This is healthy behavior, not failure.
Consolidation Zones:
Expect temporary consolidation or sideways movement as price approaches 1.34530. Round number resistance at 1.3400 and 1.3450 may cause pauses.
⚠️ What Could Interrupt This:
Fundamental Shocks:
Unexpected central bank decisions or major economic data misses can override technical structure temporarily.
Dollar Strength:
Broad USD strength driven by safe-haven flows or hawkish Fed policy could pressure all GBP/USD levels regardless of chart patterns.
Trendline Reclaim:
If price fails to hold above the broken downtrend and closes back inside the channel, the breakout is invalidated. This requires immediate reassessment.
Fibonacci Rejection:
The 0.618 level at 1.34530 could act as strong resistance. Price may reverse there rather than breaking through. Partial profit-taking at the level manages this risk.
🏆 The Fibonacci Philosophy:
"Fibs Always Guide Us":
This isn't mysticism—it's pattern recognition. Markets have shown for decades that price respects these mathematical levels with remarkable consistency across all instruments and timeframes.
Why They Work:
Collective trader behavior creates self-reinforcing reactions
Algorithmic trading systems incorporate these levels
Natural market waves align with golden ratio mathematics
Historical validation builds confidence, which builds participation
How to Use Them:
Identify swing highs and lows clearly
Apply Fibonacci retracement from swing low to swing high (or reverse)
Watch for price reaction at 0.382, 0.5, 0.618, and extension levels
Combine with structure (trendlines, support/resistance) for confluence
Use them to define targets and invalidation points, not as guarantees
📌 Key Takeaways:
✅ Last week's breakout call validated: GBP/USD broke the daily downtrend and followed through with continuation—setup worked as anticipated.
✅ Next geometric target clear: 1.34530 represents the 0.618 Fibonacci retracement where price reaction is highly probable.
✅ Structure provides confidence: Broken trendline now acts as support; pullbacks toward it offer low-risk continuation entries.
✅ Fibonacci levels guide, not guarantee: While these levels consistently attract price reaction, external factors can override short-term technical structure.
✅ Risk remains defined: Below the broken trendline invalidates the bullish breakout thesis discipline required if structure fails.
⚠️ Important Disclaimers:
This analysis is for educational purposes and reflects a technical view based on trendline analysis, Fibonacci retracement levels, and price structure. It is not financial advice or a recommendation to trade GBP/USD or any instrument.
Forex trading involves substantial risk of loss and is not suitable for all investors. Leverage can amplify both gains and losses. Past breakout success does not guarantee this move will reach 1.34530.
The 0.618 Fibonacci level could act as resistance rather than a waypoint. Price may reverse at this zone, requiring disciplined profit-taking or exit strategies.
Economic data, central bank policy changes, and geopolitical events can cause rapid price movements that override technical analysis. Always use appropriate stop losses and position sizing.
This update reflects ongoing analysis of a previous setup. Markets are dynamic, and technical pictures can change rapidly. Independent analysis and risk management are essential.
Always trade with capital you can afford to lose and consider consulting a financial professional. All trading involves risk.
✨ Community Discussion:
Are you tracking GBP/USD at these levels? How do you use Fibonacci retracements in your forex analysis? Share your perspective in the comments.
📜 Trust the structure. Respect the levels. Trade with discipline.
GBPUSD Potential UpsidesHey Traders, in tomorrow's trading session we are monitoring GBPUSD for a buying opportunity around 1.32000 zone, GBPUSD is trading in an uptrend and currently is in a correction phase in which it is approaching the trend at 1.32000 support and resistance area.
Trade safe, Joe.

GBPUSD H1 | Bullish RiseMomentum: Bullish
Price may pull back toward the buy entry level, which is acting as support. The market is also trading above the Ichimoku cloud, reinforcing the bullish bias.
Buy Entry: 1.3210
Pullback support
Stop Loss: 1.3183
Below pullback support
Take Profit: 1.3267
Multiple swing-high resistance
High Risk Investment Warning
Stratos Markets Limited (tradu.com ), Stratos Europe Ltd (tradu.com ):
CFDs are complex instruments and come with a high risk of losing money rapidly due to leverage. 70% of retail investor accounts lose money when trading CFDs with this provider. You should consider whether you understand how CFDs work and whether you can afford to take the high risk of losing your money.
Stratos Global LLC (tradu.com ): Losses can exceed deposits.
Please be advised that the information presented on TradingView is provided to Tradu (‘Company’, ‘we’) by a third-party provider (‘TFA Global Pte Ltd’). Please be reminded that you are solely responsible for the trading decisions on your account. Any information and/or content is intended entirely for research, educational and informational purposes only and does not constitute investment or consultation advice or investment strategy. The information is not tailored to the investment needs of any specific person and therefore does not involve a consideration of any of the investment objectives, financial situation or needs of any viewer that may receive it. Past performance is not a reliable indicator of future results. Actual results may differ materially from those anticipated in forward-looking or past performance statements. We assume no liability as to the accuracy or completeness of any of the information and/or content provided herein and the Company cannot be held responsible for any omission, mistake nor for any loss or damage including without limitation to any loss of profit which may arise from reliance on any information supplied by TFA Global Pte Ltd.

GBPUSD H4 | Bearish Drop OffMomentum: Bearish
Price has rejected the sell entry, confirming it as a pullback resistance level.
Sell Entry: 1.3257
Pullback resistance
Stop Loss: 1.3291
Pullback resistance
Slightly below the 145% Fibonacci extension
Take Profit: 1.3176
Overlap support
38.2% Fibonacci retracement
High Risk Investment Warning
Stratos Markets Limited (tradu.com ), Stratos Europe Ltd (tradu.com ):
CFDs are complex instruments and come with a high risk of losing money rapidly due to leverage. 70% of retail investor accounts lose money when trading CFDs with this provider. You should consider whether you understand how CFDs work and whether you can afford to take the high risk of losing your money.
Stratos Global LLC (tradu.com ): Losses can exceed deposits.
Please be advised that the information presented on TradingView is provided to Tradu (‘Company’, ‘we’) by a third-party provider (‘TFA Global Pte Ltd’). Please be reminded that you are solely responsible for the trading decisions on your account. Any information and/or content is intended entirely for research, educational and informational purposes only and does not constitute investment or consultation advice or investment strategy. The information is not tailored to the investment needs of any specific person and therefore does not involve a consideration of any of the investment objectives, financial situation or needs of any viewer that may receive it. Past performance is not a reliable indicator of future results. Actual results may differ materially from those anticipated in forward-looking or past performance statements. We assume no liability as to the accuracy or completeness of any of the information and/or content provided herein and the Company cannot be held responsible for any omission, mistake nor for any loss or damage including without limitation to any loss of profit which may arise from reliance on any information supplied by TFA Global Pte Ltd.

GBPUSD H4 | Could The Cable Reverse From Here?Momentum: Bearish
The price has rejected off the sell entry, which is a pullback resistance.
Sell entry: 1.3260
Pullback resistance
Slightly below the 127.2% Fibonacci extension.
Stop loss: 1.3322
Pullback resistance
161.8% Fibonacci extension
Take profit: 1.3176
Pullback support
38.2% Fibonacci retracement
High Risk Investment Warning
Stratos Markets Limited (tradu.com ), Stratos Europe Ltd (tradu.com ):
CFDs are complex instruments and come with a high risk of losing money rapidly due to leverage. 70% of retail investor accounts lose money when trading CFDs with this provider. You should consider whether you understand how CFDs work and whether you can afford to take the high risk of losing your money.
Stratos Global LLC (tradu.com ): Losses can exceed deposits.
Please be advised that the information presented on TradingView is provided to Tradu (‘Company’, ‘we’) by a third-party provider (‘TFA Global Pte Ltd’). Please be reminded that you are solely responsible for the trading decisions on your account. Any information and/or content is intended entirely for research, educational and informational purposes only and does not constitute investment or consultation advice or investment strategy. The information is not tailored to the investment needs of any specific person and therefore does not involve a consideration of any of the investment objectives, financial situation or needs of any viewer that may receive it. Past performance is not a reliable indicator of future results. Actual results may differ materially from those anticipated in forward-looking or past performance statements. We assume no liability as to the accuracy or completeness of any of the information and/or content provided herein and the Company cannot be held responsible for any omission, mistake nor for any loss or damage including without limitation to any loss of profit which may arise from reliance on any information supplied by TFA Global Pte Ltd.

Potential bullish bounce?Cable (GBP/USD) has bounced off the pivot which acts as a pullback support that aligns with the 38.25 Fibonacci retracement and could rise to the 1st resistance.
Pivot: 1.3180
1st Support: 1.31062
1st Resistance: 1.3317
Disclaimer:
The opinions given above constitute general market commentary and do not constitute the opinion or advice of IC Markets or any form of personal or investment advice.
Any opinions, news, research, analyses, prices, other information, or links to third-party sites contained on this website are provided on an "as-is" basis, are intended to be informative only, and are not advice, a recommendation, research, a record of our trading prices, an offer of, or solicitation for, a transaction in any financial instrument and thus should not be treated as such. The information provided does not involve any specific investment objectives, financial situation, or needs of any specific person who may receive it. Please be aware that past performance is not a reliable indicator of future performance and/or results. Past performance or forward-looking scenarios based upon the reasonable beliefs of the third-party provider are not a guarantee of future performance. Actual results may differ materially from those anticipated in forward-looking or past performance statements. IC Markets makes no representation or warranty and assumes no liability as to the accuracy or completeness of the information provided, nor any loss arising from any investment based on a recommendation, forecast, or any information supplied by any third party.

Bullish bounce off?GBP/USD has bounced off the support level, which is a pullback support that is slightly above the 38.2% Fibonacci retracement, and could rise from this level to our take profit.
Entry: 1.3194
Why we like it:
There is a pullback support level that is slightly above the 38.2% Fibonacci retracement
Stop loss: 1.3140
Why we like it:
There is a pullback support that is slightly above the 61.8% Fibonacci retracement.
Take profit: 1.3320
Why we like it:
There is a pullback resistance that lines up with the 161.8% Fibonacci extension.
Enjoying your TradingView experience? Review us!
Please be advised that the information presented on TradingView is provided to Vantage (‘Vantage Global Limited’, ‘we’) by a third-party provider (‘Everest Fortune Group’). Please be reminded that you are solely responsible for the trading decisions on your account. There is a very high degree of risk involved in trading. Any information and/or content is intended entirely for research, educational and informational purposes only and does not constitute investment or consultation advice or investment strategy. The information is not tailored to the investment needs of any specific person and therefore does not involve a consideration of any of the investment objectives, financial situation or needs of any viewer that may receive it. Kindly also note that past performance is not a reliable indicator of future results. Actual results may differ materially from those anticipated in forward-looking or past performance statements. We assume no liability as to the accuracy or completeness of any of the information and/or content provided herein and the Company cannot be held responsible for any omission, mistake nor for any loss or damage including without limitation to any loss of profit which may arise from reliance on any information supplied by Everest Fortune Group.

GBPUSD | Long idea I am expecting GBPUSD to continue higher this week.
Today we again saw a reaction on the Thursday low level be have been testing and holding since Friday.
Would be lucky if we saw a test yet again to look for any long positions.
would need a 1-2h candle close above the level if we test it again.

Headnig into pullback resistance?Cable (GBP/USD) is rising towards the pivot, which acts as a pullback resistance and could reverse to the 1st support, which has been identified as an overlap support.
Pivot: 1.3290
1st Support: 1.3002
1st Resistance: 1.3459
Disclaimer:
The opinions given above constitute general market commentary and do not constitute the opinion or advice of IC Markets or any form of personal or investment advice.
Any opinions, news, research, analyses, prices, other information, or links to third-party sites contained on this website are provided on an "as-is" basis, are intended to be informative only, and are not advice, a recommendation, research, a record of our trading prices, an offer of, or solicitation for, a transaction in any financial instrument and thus should not be treated as such. The information provided does not involve any specific investment objectives, financial situation, or needs of any specific person who may receive it. Please be aware that past performance is not a reliable indicator of future performance and/or results. Past performance or forward-looking scenarios based upon the reasonable beliefs of the third-party provider are not a guarantee of future performance. Actual results may differ materially from those anticipated in forward-looking or past performance statements. IC Markets makes no representation or warranty and assumes no liability as to the accuracy or completeness of the information provided, nor any loss arising from any investment based on a recommendation, forecast, or any information supplied by any third party.

Bullish bounce off key supportGBP/USD is falling towards the support level, which is a pullback support that is slightly above the 38.2% Fibonacci retracement and could bounce from this level to our take profit.
Entry: 1.3194
Why we like it:
There is a pullback support that is slightly above the 38.2% Fibonacci retracement.
Stop loss: 1.3140
Why we like it:
There is a pullback support that is slightly above the 61.8% Fibonacci retracement.
Take profit: 1.3322
Why we like it:
There is a pullback resistance level that aligns with the 161.8% Fibonacci extension.
Enjoying your TradingView experience? Review us!
Please be advised that the information presented on TradingView is provided to Vantage (‘Vantage Global Limited’, ‘we’) by a third-party provider (‘Everest Fortune Group’). Please be reminded that you are solely responsible for the trading decisions on your account. There is a very high degree of risk involved in trading. Any information and/or content is intended entirely for research, educational and informational purposes only and does not constitute investment or consultation advice or investment strategy. The information is not tailored to the investment needs of any specific person and therefore does not involve a consideration of any of the investment objectives, financial situation or needs of any viewer that may receive it. Kindly also note that past performance is not a reliable indicator of future results. Actual results may differ materially from those anticipated in forward-looking or past performance statements. We assume no liability as to the accuracy or completeness of any of the information and/or content provided herein and the Company cannot be held responsible for any omission, mistake nor for any loss or damage including without limitation to any loss of profit which may arise from reliance on any information supplied by Everest Fortune Group.

GBPUSD H1 | Bullish Bounce Off Pullback SupportMomentum: Bullish
The price is falling towards the buy entry, which is slightly below the 38.2% Fibonacci retracement.
Entry: 1.3138
Pullback support
Slightly below 38.2% Fibonacci retracement.
Stop loss: 1.3108
Pullback support
61.8% Fibonacci retracement
Take profit: 1.3212
Multi swing high resistance
High Risk Investment Warning
Stratos Markets Limited (tradu.com ), Stratos Europe Ltd (tradu.com ):
CFDs are complex instruments and come with a high risk of losing money rapidly due to leverage. 70% of retail investor accounts lose money when trading CFDs with this provider. You should consider whether you understand how CFDs work and whether you can afford to take the high risk of losing your money.
Stratos Global LLC (tradu.com ): Losses can exceed deposits.
Please be advised that the information presented on TradingView is provided to Tradu (‘Company’, ‘we’) by a third-party provider (‘TFA Global Pte Ltd’). Please be reminded that you are solely responsible for the trading decisions on your account. Any information and/or content is intended entirely for research, educational and informational purposes only and does not constitute investment or consultation advice or investment strategy. The information is not tailored to the investment needs of any specific person and therefore does not involve a consideration of any of the investment objectives, financial situation or needs of any viewer that may receive it. Past performance is not a reliable indicator of future results. Actual results may differ materially from those anticipated in forward-looking or past performance statements. We assume no liability as to the accuracy or completeness of any of the information and/or content provided herein and the Company cannot be held responsible for any omission, mistake nor for any loss or damage including without limitation to any loss of profit which may arise from reliance on any information supplied by TFA Global Pte Ltd.

GBP/USD - Next stop @ 1.3300 ?The GBP/USD pair has broken out of a well-defined symmetrical triangle on the M30 timeframe. FX:GBPUSD
🔍 Technical Breakdown
📈 Triangle Breakout confirmed with bullish momentum
🟩 Key Bullish Targets marked above, aligned with previous liquidity zones
🟥 Demand / Re-Entry Zone highlighted below — potential retest area
📊 EMA structure supportive of upward continuation
🎯 Expecting a measured move continuation if price holds above breakout zone
⚠️ Disclaimer
This chart is for educational purposes only and not financial advice.
Always do your own analysis and manage risks properly. Trading involves significant risk of loss.
👍 Support the Analysis If you found this helpful:
❤️ Leave a like
💬 Drop a comment
🔁 Share your viewpoint below
Your support motivates me to post more setups like this!

Bearish reevrsal off pullback resistance?Cable (GBP/USD) has rejected off the pivot, which is a pullback resistance and could drop to he 1st support.
Pivot: 1.3261
1st Support: 1.3106
1st Resistance: 1.3365
Disclaimer:
The opinions given above constitute general market commentary and do not constitute the opinion or advice of IC Markets or any form of personal or investment advice.
Any opinions, news, research, analyses, prices, other information, or links to third-party sites contained on this website are provided on an "as-is" basis, are intended to be informative only, and are not advice, a recommendation, research, a record of our trading prices, an offer of, or solicitation for, a transaction in any financial instrument and thus should not be treated as such. The information provided does not involve any specific investment objectives, financial situation, or needs of any specific person who may receive it. Please be aware that past performance is not a reliable indicator of future performance and/or results. Past performance or forward-looking scenarios based upon the reasonable beliefs of the third-party provider are not a guarantee of future performance. Actual results may differ materially from those anticipated in forward-looking or past performance statements. IC Markets makes no representation or warranty and assumes no liability as to the accuracy or completeness of the information provided, nor any loss arising from any investment based on a recommendation, forecast, or any information supplied by any third party.

GBPUSD Breakout and Potential RetraceHey Traders, in today's trading session we are monitoring GBPUSD for a buying opportunity around 1.31100 zone, GBPUSD was trading in a downtrend and successfully managed to break it out. Currently is in a correction phase in which it is approaching the retrace area at 1.31100 zone.
Trade safe, Joe.

Bullish rise?GBP/USD has reacted off the support level which is a pullback support and could potentially rise to the 1st resistance.
Entry: 1.3214
Why we like it:
There is a pullback support level.
Stop loss: 1.3100
Why we like it:
There is a pullback support.
Take profit: 1.3454
Why we like it:
There is a swing high resistance.
Please be advised that the information presented on TradingView is provided to Vantage (‘Vantage Global Limited’, ‘we’) by a third-party provider (‘Everest Fortune Group’). Please be reminded that you are solely responsible for the trading decisions on your account. There is a very high degree of risk involved in trading. Any information and/or content is intended entirely for research, educational and informational purposes only and does not constitute investment or consultation advice or investment strategy. The information is not tailored to the investment needs of any specific person and therefore does not involve a consideration of any of the investment objectives, financial situation or needs of any viewer that may receive it. Kindly also note that past performance is not a reliable indicator of future results. Actual results may differ materially from those anticipated in forward-looking or past performance statements. We assume no liability as to the accuracy or completeness of any of the information and/or content provided herein and the Company cannot be held responsible for any omission, mistake nor for any loss or damage including without limitation to any loss of profit which may arise from reliance on any information supplied by Everest Fortune Group.

GBP/USD — Bearish Outlook Toward 1.26867GBP/USD remains under sustained bearish pressure after failing to hold above the key structural levels at 1.34825 and 1.33906. These two resistance zones now define the upper boundary of the broader downtrend, confirming that sellers remain in control.
Price is currently moving within a corrective phase, and any recovery attempt below these key levels is expected to face renewed selling interest. The bearish continuation scenario remains valid as long as the pair stays capped below 1.33906.
The next major objective for bears is the downside target at 1.26867, corresponding to the 1.0 Fibonacci extension and the final completion zone of the current corrective wave.
A break below intermediate supports—1.31642, 1.30846, and 1.29907—will accelerate momentum toward the target.
Key Levels
Major Resistance: 1.34825
Secondary Resistance: 1.33906
Intermediate Supports: 1.31642 • 1.30846 (50%) • 1.29907 (0.618)
Final Downside Target: 1.26867

GBPUSD H1 | Bearish Reversal Off Key Resistance?Momentum: Bearish
The price is rising towards the sell entry that aligns with the 50% Fibonacci retracement.
Sell entry: 1.3115
Strong overlap resistance
50% Fibonacci retracement
Stop loss: 1.3138
Pullback resistance
61.8% Fibonacci retracement
Take profit: 1.3063
Pullback support
High Risk Investment Warning
Stratos Markets Limited (tradu.com ), Stratos Europe Ltd (tradu.com ):
CFDs are complex instruments and come with a high risk of losing money rapidly due to leverage. 70% of retail investor accounts lose money when trading CFDs with this provider. You should consider whether you understand how CFDs work and whether you can afford to take the high risk of losing your money.
Stratos Global LLC (tradu.com ): Losses can exceed deposits.
Please be advised that the information presented on TradingView is provided to Tradu (‘Company’, ‘we’) by a third-party provider (‘TFA Global Pte Ltd’). Please be reminded that you are solely responsible for the trading decisions on your account. Any information and/or content is intended entirely for research, educational and informational purposes only and does not constitute investment or consultation advice or investment strategy. The information is not tailored to the investment needs of any specific person and therefore does not involve a consideration of any of the investment objectives, financial situation or needs of any viewer that may receive it. Past performance is not a reliable indicator of future results. Actual results may differ materially from those anticipated in forward-looking or past performance statements. We assume no liability as to the accuracy or completeness of any of the information and/or content provided herein and the Company cannot be held responsible for any omission, mistake nor for any loss or damage including without limitation to any loss of profit which may arise from reliance on any information supplied by TFA Global Pte Ltd.

GBPUSD Breakout and Potential RetraceHey Traders, in today's trading session we are monitoring GBPUSD for a buying opportunity around 1.30900 zone, GBPUSD was trading in a downtrend and successfully managed to break it out. Currently is in a correction phase in which it is approaching the retrace area at 1.30900 support and resistance area.
Trade safe, Joe.

Could we see a bearish reversal?Cable (GBP/USD) is reacting off the pivot which aligns with the 38.2% Fibonacci retracement and could drop to the swing low support.
Pivot: 1.3106
1st Support: 1.3012
1st Resistance: 1.3179
Disclaimer:
The opinions given above constitute general market commentary and do not constitute the opinion or advice of IC Markets or any form of personal or investment advice.
Any opinions, news, research, analyses, prices, other information, or links to third-party sites contained on this website are provided on an "as-is" basis, are intended to be informative only, and are not advice, a recommendation, research, a record of our trading prices, an offer of, or solicitation for, a transaction in any financial instrument and thus should not be treated as such. The information provided does not involve any specific investment objectives, financial situation, or needs of any specific person who may receive it. Please be aware that past performance is not a reliable indicator of future performance and/or results. Past performance or forward-looking scenarios based upon the reasonable beliefs of the third-party provider are not a guarantee of future performance. Actual results may differ materially from those anticipated in forward-looking or past performance statements. IC Markets makes no representation or warranty and assumes no liability as to the accuracy or completeness of the information provided, nor any loss arising from any investment based on a recommendation, forecast, or any information supplied by any third party.
