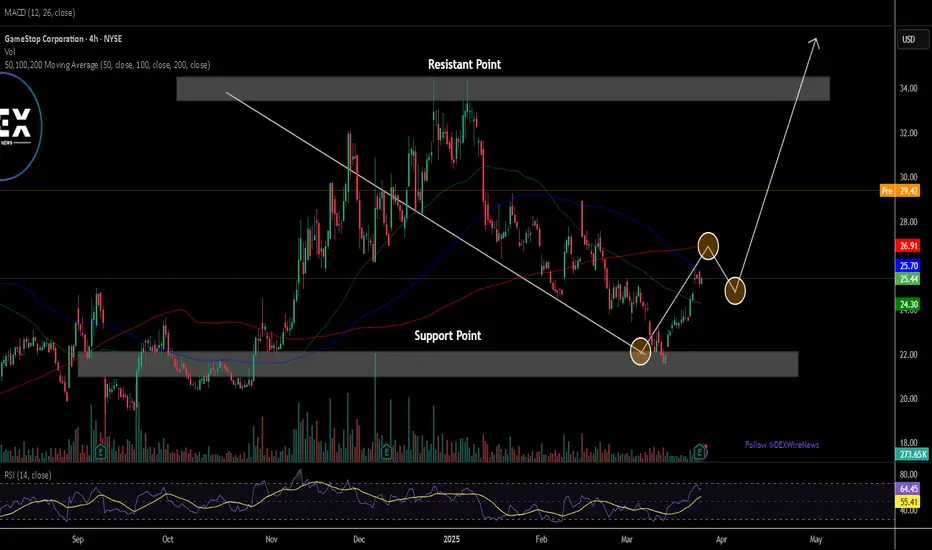
GME | The time to go long has come- Timeframe: Weekly
- Trade type: Buy stop order
- Price: 21.85
- Take Profit: Open
- Stop Loss: 20.93 (-4.20 %)
Idea: Long on a breakout above last week's high - bullish momentum continuation.
Entry: Buy stop above last week’s high.
Stop-loss: Below the low of the same candle.
If the weekly candle closes below this level, the trade is invalidated.
Take Profit: Trailing stop following the lows of new weekly candles.
GME
Red Kitten Crew or The Roaring Kitty Coin?MEXC:RKCUSDT
There are few moments in my life where I have to take a deep breathe and check I'm not dreaming.
We have a situation wherein the majority of GME enthusiasts, who follow the situation very closely and have done so for the best part of 5 years, have to double check their assumptions and standards.
Here we have, what appeared to be, a Meme coin promoted on The Roaring Kitty X account, with plausible reasoning to suspect the user was hacked and the hacker sought to exploit eager fans with a pump and dump scheme.
We've all seen this before, even at a presidential level!
However, what remains curious is the nature and timing of all this. Just moments after the1 16-month dormant account posted the viral tweet, GME submitted their shareholder request to gain the ability to issue 2.5Bn new shares. The timing is uncanny.
What is more uncanny is that this seemingly "new" token released on what we thought was the 11th of May 2026, has actually been around since mid-late 2024 which is when Keith Gill made his first return after the long exodus following the initial squeeze event.
The data is right there for your eyes. We have no reason to suspect this isn't a legitimate meme-coin project tailored for the GME community. The top holders came AFTER the 'pump and dump' the main holders have shown no signs of liquidation into strength, in fact, they've bought more....
In my line of reasoning, we must compare the dynamics of this token to that of other prominent memes that have birthed to many fortunes over the past 5 years and their respective ATH market caps. Granted, these coins were released under different times and constraints to what we face today, it's not lost on me that BTC is going through a severe downtrend at this moment and is likely to fall further to <$40,000 following a larger liquidation event in the market driven by Gamma cascades and inflationary pressure tightening expected profit margins.
Alas, let's run the numbers.
• Dogecoin (DOGE)
• ATH Market Cap: $88 Billion
• Details: Reached in May 2021 when the price peaked at roughly $0.74 per coin.
• Shiba Inu (SHIB)
• ATH Market Cap: $40-$43 Billion
• Details: Achieved in October 2021 when the token hit its all-time high price of $0.00008845
• Pepe (PEPE)
• ATH Market Cap: $11.8 Billion
• Details: Reached primarily in December 2024 (and re-tested in late 2025) when its price surpassed $0.000028
• Bonk (BONK)
• ATH Market Cap: $5.1 Billion
• Details: Achieved late in the 2024 bull run following massive ecosystem rallies on the Solana blockchain.
• Dogwifhat (WIF)
• ATH Market Cap: $4.8 Billion
• Details: Hit in March 2024 when the Solana-based meme coin surpassed the $4.00 price mark.
At the time of writing, RKC has a market cap of just $3.88 Million, having rejected from just above $11 Million in the week following its release.
To put into perspective the level of potential asymmetry we see here, the average Market Cap of the above list is $30 bn. If RKC was to hit the average price of the above examples, the price per coin would reach $30. That's a 7500x increase! We currently stand at $0.00407 as of writing with a total suppy of 1 Bn tokens (rounded slightly.)
Time will tell if the turnaround story comes to fruitition, however, the asymmetry is clear.
I'm disclosing the token posted by TheRoaringKitty X account due to the rise of many copy-cat addresses: 7HgfXftRBBqsYtAEYcqjGLQrNJLL6Tww9ek4rE3Apump
I will formally disclose, I do hold (as of writing) 70,795.5 RKC tokens at an average fill of below $0.005. I will materially benefit from any increase in the price of RKC, however, I do not intend to use this post as motivation for any individual or corporations investment/trading decisions. Meme coins are highly speculative, extremely volatile, and one should never buy or invest in any token they have not performed thorough Due Diligence on beforehand, nor should any reasonably minded investor consider meme coins as part of a sound financial strategy.
RLong
What traders are reacting to right now U.S. stocks moved higher as investors reacted to signs of progress toward a potential U.S. and Iran agreement, alongside another strong session for AI related stocks.
Oil moved sharply lower as geopolitical risk premiums eased. WTI crude futures fell around 6.5% to the low US$90s per barrel, while Brent crude dropped about 7% to around US$101 per barrel.
The Dow rose about 600 points, while the S&P 500 (+1.45%) and the Nasdaq 100 (+2.01%) closed at record highs.
AMD was one of the standout movers (+18.6%). The company pointed to strong demand for data centre chips, with its data centre segment rising 57% in the first quarter to US$5.8 billion. Super Micro Computer also joined the rally, gaining 24.5% as investors focused on its AI server demand outlook.
Elsewhere, GameStop rebounded (+3.4%) from a ~10% fall on Monday even as reports that Michael Burry reportedly sold his entire stake following the company’s unsolicited bid for eBay
GME (GameStop) — $56B eBay Bid: Ryan Cohen's Transformative ECom**💡 GME (GameStop) — $56B eBay Bid: Ryan Cohen's Transformative E-Commerce Leap**
**SECTION 1 — Executive Summary** 💼
GameStop has ignited massive market attention with its unsolicited $56 billion cash-and-stock offer to acquire eBay at $125 per share creating a potential e-commerce powerhouse to rival Amazon in collectibles gaming and online marketplaces. The move leverages GameStop's $9 billion cash hoard and meme-stock momentum under Ryan Cohen to pivot from declining physical retail into high-growth digital commerce exactly as core gaming sales soften. Overall rating: Buy. 12-month price target: $45 (blended sum-of-the-parts valuation assuming partial eBay synergies plus standalone cash value and collectibles growth). The single biggest reason to own this stock right now is the credible path to value-unlocking scale via the eBay deal amid a $9 billion war chest. The single biggest risk is regulatory hurdles or eBay board rejection derailing the transformative thesis.
**SECTION 2 — Business Overview** 🏢
GameStop operates as a leading specialty retailer of video game hardware software accessories and collectibles with an expanding digital and e-commerce footprint. Revenue breakdown (FY 2025 ended Jan 31 2026): Hardware and software ~50 percent collectibles and merchandise ~29 percent (growing) services and other ~21 percent primarily U.S.-centric with international exposure. Business model generates revenue through retail sales supplemented by high-margin collectibles trading cards and digital downloads with recent emphasis on online marketplaces and potential eBay synergies for repeat engagement via loyalty programs and resale platforms. Competitive moat stems from the iconic brand loyal meme-driven retail investor base massive cash reserves for strategic moves and physical store network ideal for experiential collectibles events that traditional e-commerce players cannot easily replicate.
**SECTION 3 — Financial Deep Dive** 📈
Key metrics (most recent publicly available FY 2025 ended Jan 31 2026 source: company 10-K and Q4 release Mar 24 2026):
Revenue: $3.63 billion (down 5 percent YoY).
Net income: $418.4 million (up 219 percent YoY).
EPS (diluted): $0.93.
Gross margin: ~33 percent.
Operating margin: Improved to positive on cost discipline.
Free cash flow: ~$597 million (strong conversion).
YoY growth rates: Revenue –5 percent but net income +219 percent reflecting aggressive cost cuts and profitability focus.
Balance sheet health: ~$9 billion cash and equivalents minimal debt current ratio well above 2.0 extremely strong liquidity.
Cash flow quality: Operating cash flow significantly exceeds net income with clean working capital management (no red flags).
Capital allocation: Heavy emphasis on share buybacks when opportunistic massive cash preservation for M&A like the eBay bid no dividend.
**SECTION 4 — Growth Analysis** 🚀
Total addressable market (TAM): Global e-commerce and collectibles/gaming resale market exceeding $200 billion+ by 2030 with eBay synergies unlocking cross-border scale. Current market share: Dominant in U.S. physical gaming retail but nascent in broader e-commerce. Key growth drivers for next 3-5 years: Potential eBay integration for combined marketplace power collectibles expansion (already 29 percent of sales) and digital trading card platform launches. Management guidance (via recent Cohen commentary): Highly ambitious on strategic M&A and profitability; analyst consensus more cautious on standalone retail but bullish on deal optionality. Growth shifting from organic retail to acquisition-dependent via the eBay proposal.
**SECTION 5 — Valuation** 📊
DCF analysis: Base case assumes successful eBay synergies driving 15-20 percent revenue CAGR post-deal 25 percent+ margins at scale WACC 11 percent (reflecting meme volatility) terminal growth 3 percent . Implied value supports $45 target. Comparable company analysis (peers as of May 2026): eBay ~15x forward P/E Amazon and Etsy higher on growth; standalone GME trades at premium to retail on cash and optionality. Historical valuation range (5-year): Highly volatile 10-100x P/E on meme swings. Bull target $70 (full eBay close and synergies); Base $45; Bear $20 (deal collapse). Current price ~$26.50 offers ~70 percent upside to base target.
**SECTION 6 — Risk Analysis** ⚠️
1. eBay deal rejection or regulatory blocks (high probability/impact): Triggered by board pushback or antitrust scrutiny; watch shareholder votes and FTC updates.
2. Core retail sales continued decline (medium-high): Gaming hardware softness; monitor quarterly trends.
3. Meme-stock volatility and short covering unwind (medium): Elevated short interest ~15 percent; watch COT reports.
4. Dilution or failed capital deployment (medium): Cash burn if deal fails; track balance sheet updates.
5. Macro consumer spending slowdown (low-medium): Recession hitting discretionary gaming/collectibles; monitor retail sales data.
Short interest ~61.91 million shares (15.19 percent of float as of Apr 15 2026 per filings). Insider activity shows selective selling under 10b5-1 plans but overall confidence via retained stakes. No major accounting quality flags.
**SECTION 7 — Catalyst Calendar** 📅
Next earnings date: ~June 9 2026 (Q1 results with likely eBay update). Upcoming events: eBay bid formalization and potential negotiations in coming weeks; digital trading card platform momentum. Macro events: Fed policy impacting consumer spending; broader e-commerce M&A trends. 12-month timeline: Q2 earnings August potential eBay milestones late 2026 collectibles and online growth throughout year.
**SECTION 8 — Technical Analysis** 📈
Primary Chart: Daily timeframe 1-year view shows GME breaking out from multi-month consolidation near $20-24 to $26+ on massive volume following eBay bid headlines with higher highs forming. Price action well above the 50-day moving average confirming bullish trend shift. RSI (14) elevated ~65-70 but not overbought with room for continuation. MACD bullish crossover with expanding histogram on surge days. Major support zone $23-24 (recent breakout) resistance $30-32. Visible chart patterns: Clear ascending triangle resolution plus volume climax on news. Technical implication: Strongly bullish near-term bias into eBay developments with potential for further extension to $35+ on positive momentum.
**SECTION 9 — The Verdict** 🏆
Bull case ($60 target 40 percent probability): eBay deal closes with rapid synergies creating a $100 billion+ e-commerce leader.
Base case ($45 target 40 percent probability): Deal advances or alternative M&A unlocks value while core business stabilizes.
Bear case ($20 target 20 percent probability): Bid fails leading to sentiment reset and retail pressure.
Expected value calculation: Probability-weighted price target = $48. Final recommendation: Buy with High conviction. The 30-second elevator pitch: GameStop just dropped a $56 billion eBay bomb with Ryan Cohen and $9 billion cash turning a declining retailer into a potential e-commerce disruptor — the meme energy and deal optionality make this a high-conviction setup right now.
**Sources**
GameStop Investor Relations (investor.gamestop.com) FY 2025 results Mar 24 2026; Yahoo Finance CNBC Reuters and WSJ reports on eBay bid May 1-4 2026; Macrotrends and company filings for financial metrics; Fintel and MarketBeat for short interest/insider data Apr-May 2026; TradingView chart data as of May 1 2026 close.
What are your thoughts on GME? Drop them below 👇
#GME #GameStop #eBayBid #RyanCohen #MemeStock #ShortSqueeze #EcommercePivot #Collectibles #StockMarket #AIBoom
GameStop Targets eBay in $56 Billion Bid. What's That About?Guess who’s looking to rodeo into the e-commerce arena ? In a move that feels like a side quest turning into the main storyline, ya boi, GameStop NYSE:GME , the beloved retail play, has set its sights on eBay NASDAQ:EBAY with a takeover bid worth about $56 billion.
We’re talking the same company that once rode a meme-stock rollercoaster. It’s now trying to buy a platform nearly four times its size and reshape it into something like a rival to Amazon NASDAQ:AMZN .
💰 Offer’s on the Table
GameStop NYSE:GME is offering $125 per eBay share in a mix of stock and cash. That represents a 46% premium, which in plain English means a generous markup over where the stock has been trading.
Premiums like that are designed to grab attention and, ideally, convince shareholders to say yes before thinking too hard.
The company has already built a 5% stake in eBay, signaling this idea did not come out of nowhere. CEO Ryan Cohen has been quietly positioning for this moment, and now the plan is out in the open.
🏦 Funding the Ambition
Ambition is one thing. Funding it is another. GameStop says it has around $9.4 billion in cash and a commitment from TD Bank for roughly $20 billion in financing through debt issuance.
That still leaves a sizable gap, which suggests more borrowing or stock issuance could be on the table. In trading terms, this is a highly leveraged bet, meaning borrowed money plays a big role. Leverage can amplify gains (as you know), though it also raises the stakes if things go sideways (you know that, too).
GameStop isn’t new to these pro-risk moves. Right about a year ago, the video game retailer scooped up 4,710 Bitcoins worth $512 million, each at $109,000 a pop. Someone bought near the top and is now staring at a paper loss of 27%.
🧠 The Vision
Cohen’s pitch is simple and bold. He believes eBay is undervalued and could become a “hundreds of billions” business. The idea involves transforming the marketplace into a stronger competitor to Amazon NASDAQ:AMZN by modernizing the platform, improving logistics, and tapping into new categories.
Think of it as taking a well-known brand with loyal users and giving it a fresh engine. The logic has appeal. eBay already has global reach and a recognizable name. What it lacks is the growth narrative that investors love.
⚔️ Deal or Duel?
Here’s where things get interesting. If eBay’s management resists, GameStop has hinted it may go directly to shareholders. That approach is called a hostile takeover, which sounds dramatic because it usually is.
There is also a timing wrinkle. The deadline to submit proposals for eBay’s upcoming annual meeting has already passed, which complicates the path forward. In short, this could turn into a drawn-out negotiation rather than a quick handshake.
📊 Market Reaction
Investors responded with cautious enthusiasm. eBay shares jumped nearly 12%, reflecting the attractive offer. GameStop stock edged higher as well, though with a more measured reaction.
If we read a bit into it, eBay holders see an immediate upside. GameStop investors are weighing the risks of such a large and complex deal.
👀 What Should Traders Watch?
So what’s there to watch? Some key factors include whether financing comes together smoothly, how eBay’s board responds, and whether other bidders emerge (we saw how the Warner Bros drama unfurled ).
There is also the broader question of execution. Turning around a legacy platform (who bought worn out sneakers off eBay in the early 2000s?) while competing with Amazon requires flawless delivery.
GameStop’s bid for eBay is bold, for real, and very much in line with a market that rewards big ideas. It also raises real questions about scale, risk, and timing.
Off to you : is this a masterstroke in the making, or a high-stakes gamble dressed up as a comeback story?
$GME , IdeaGME — Two Roads, One Destination
Quarterly chart. Decades of context.
Two scenarios. Both end in the same place.
Scenario 1 (orange) — The direct route. GME flushes into the $2.10–$3.50 DCA zone, builds a multi-year base, and launches. Clean, brutal, efficient.
Scenario 2 (blue) — The psychological torture route. A relief bounce first — enough to shake out the bears and bring in the latecomers — then the real flush into the zone, followed by the same launch.
Different paths. Same destination: $1,000–$2,800.
The system doesn't predict which road. It watches the zone. When price arrives, the rules take over.
Patience is the edge most people don't have.
The map is drawn. Now we wait.
Follow, Boost, Thank You!
⚠️ Financial Disclaimer: This post is not financial advice. I am not your financial advisor, your life coach, or your legally responsible adult. Always do your own research and never trade based solely on internet comedy.
GME Solid V: The Transition — From Sons to Guns Of LiquidityPreface
This is not a prediction.
This is a structural update.
GME is not in confirmed markup — but for the first time in a long time, the behavior is no longer purely compressive. What we are seeing now is a potential transition phase in the broader regime.
This builds directly on prior ideas I’ve referred to as the “Sons of Liquidity” and the “Guns of Liquidity.”
---
Macro Context
On the 3M structure, price remains in the upper portion of Quadrant 2 .
This is historically an area of:
• supply interaction
• acceptance battles
• regime decisions
Quadrant 2 has consistently acted as a ceiling in prior cycles.
That makes current behavior here meaningful.
---
From Sons to Guns
In prior posts, I described:
Sons of Liquidity → passive / defensive participants
• defending levels
• absorbing supply
• preventing breakdown
Guns of Liquidity → initiative / offensive participants
• pushing price
• creating expansion
• driving trend
For most of this structure, GME has been dominated by Sons of Liquidity — holding the line, but not advancing it.
What we are beginning to see now is:
early evidence that the Guns may be stepping in
---
Phantom Pain Trendline — Structural Shift
The “Phantom Pain” trendline has acted as a long-term suppressive structure.
Recent behavior:
• Weekly close above the trendline
• Follow-through acceptance above it
• No immediate rejection back below
This marks the first sustained break in that suppression.
---
Anchored VWAP Ladder
Two key anchored VWAPs define the current structure:
• August 2024 AVWAP → now acting as support
• May 2024 AVWAP → acting as resistance
Recent behavior:
• Acceptance above the August AVWAP
• Repeated tests into the May AVWAP
• Wicks into resistance, but no breakdown
This is no longer passive defense alone — this is pressure building upward.
---
Fib Channel — 0.382 Acceptance
Price has now shown sustained acceptance above the 0.382 fib channel band .
Historically:
• This level rejected price
• Acceptance was not sustained
Now:
• Multiple weekly closes above
• No immediate failure
This is a change in behavior, not just a test.
---
Volume Behavior
Key structural pushes are occurring on:
• Volume above the 20-period average
• Increased participation on upward moves
This suggests a shift from:
defensive absorption → early initiative demand
---
Current Structure
Price is now positioned between:
• Lower support → August 2024 AVWAP
• Upper resistance → May 2024 AVWAP
• Above Phantom Pain suppression
• Holding above key fib structure
This is not pure compression anymore.
This is controlled consolidation after a structural break .
---
Interpretation
This is not confirmed markup.
This is:
transition
A possible shift from:
• Sons of Liquidity (defense)
→ toward
• Guns of Liquidity (initiative)
But the transition is not complete.
---
What Confirms the Shift
For this to evolve into true expansion:
• Acceptance above the May 2024 AVWAP
• Continued holds above 0.382
• Expansion into lower-volume areas above
• Higher lows forming above current structure
This would signal that initiative demand has taken control.
---
What Signals Failure
If the structure breaks:
• Loss of the August 2024 AVWAP
• Breakdown below 0.382
• Return below Phantom Pain
Then the market reverts back to:
Sons of Liquidity only — defense without progression
---
Takeaway
For most of this cycle, GME has been defined by defense.
Now, for the first time in a while, it is showing signs of transition toward offense .
That does not guarantee direction.
But it does change the environment.
And in changing environments:
process and patience matter more than prediction.
GME(Update): When a meme meets a nine billion dollar cash pileGameStop is transforming from a video game king into a holding company led by Ryan Cohen, who runs the firm without a salary, without conference calls, and without outdated expectations. Everyone who has ever asked «What will Cohen do with 9 billion?» is now glued to the charts, because silence in the boardroom can only mean one thing – the calm before the loudest deal in retail history.
Fundamentals
The financial results have sealed GameStop's final metamorphosis. Quarterly revenue came in at 1.104 billion dollars - a 14 percent drop, but operating profit rose to 135.2 million, nearly double the year‑ago figure. For the full 2025 fiscal year, the company delivered 232.1 million in operating profit, completely reversing a 26.2 million loss from the previous year. This is no accident; it is the result of Cohen methodically closing unprofitable locations and cutting SG&A expenses to 910.2 million – almost 20 percent lower than last year. The crown jewel: 9.0 billion dollars in cash, equivalents and marketable securities – a massive leap from 4.8 billion a year ago.
Add the Bitcoin strategy. In May 2025, GameStop invested 500 million dollars into 4,710 BTC. Instead of letting the coins sit idle, Cohen moved 4,709 BTC to Coinbase Prime and sold covered call options with strikes between 105,000 and 110,000 dollars, turning digital gold into a yield‑generating asset. This is not just holding reserves – it is a bold move that transforms GameStop into a mini‑Strategy on steroids.
Risks: With this strategy, GameStop caps its upside from Bitcoin above 110,000 dollars. Shareholders face dilution risk because capital was raised through ATM offerings. The retail business continues to shrink.
Technicals
On the weekly chart, price has completed a full trend reversal. The descending trendline that had weighed on quotes for months has finally been broken, and the asset is entering the golden pocket – the zone where the fair value gap meets the 0.618–0.786 Fibonacci retracement, an ideal area for fresh accumulation. A golden cross of moving averages has already occurred, and the OTE zone is formed right now. Indicators confirm the bullish bias: ADX shows a developing trend, directional lines DI+ and DI– clearly signal buyer dominance, and MACD gives a clear buy signal. Weekly volumes remain steadily high, confirming the presence of large players.
Price closed Friday at 24.95 dollars. First target is 31.48, second is 34.70, third is 41.14, the key target is 53.53.
The market continues to value GameStop on a single metric: what Ryan Cohen will do with his nine billion dollar arsenal. The technical breakout is confirmed, the golden pocket is holding, and the targets are above.
Game on for GME? (Potential Breakout)GME printing some bullish reversal patterns including a double bottom / sort-of cup n handle / bull flag at the top of a macro descending wedge after bouncing off the 50% fib on the last retrace. I don't put much weight on diagonal trend lines, so I would probably wait for a confirmed break & hold above that prev resistance level before entering.
This idea is all-technicals, I have no alpha and have done zero research on what fundamentals might support this potential trend reversal here, but given that GME is the poster-child "Meme stock," maybe I don't need to...
I rarely post a low-conviction / high risk / early setup like this, but what can I say? I LIKE THE STOCK.
trade at your own risk,
CD
$GME $8.8B War Chest. Earnings Tonight. Shorting the Hype!GameStop reports Q4 2025 earnings tonight, March 24, 2026, after market close. The options market is pricing in a move of approximately 6% in either direction. This is the short setup.
GameStop is no longer a video game retailer in any meaningful sense.
Ryan Cohen has transformed it into a cash-rich holding company with $8.8 billion on the balance sheet and approximately 4,710 BTC worth around $500 million. In February 2026 Cohen told CNBC he is planning a very, very, very big acquisition of a publicly traded consumer company he called transformational and way more compelling than Bitcoin.
The entire bull case rests on that deal. It has not been announced.
Physical game hardware sales are down 31% annually. The core retail business has no credible recovery path. The stock trades at over 120x earnings.
Analyst consensus target sits at approximately $13.50. The stock is up 14% year-to-date purely on M&A speculation with nothing concrete to show for it.
Tonight's earnings call has one question. Does Cohen reveal the acquisition target or not. If he does not, the hype deflates. Two short zones are mapped at resistance levels above current price with defined stops.
🔴 Sell Zone 1 ($23.21 area)
Prior resistance and overhead supply on the daily chart.
Stop: $23.80 (2.542% above entry) / $69,650 position
Qty: 593
Risk/Reward Ratio: 12.22
Target 1: 25.412% lower ($16.00 area / $74,027.97)
Target 2: 31.064% lower ($19.93 area / $74,277.12)
🔴 Sell Zone 2 ($26.72 area)
Stronger resistance shelf and the 0.786 Fibonacci level on the daily chart.
Stop: $27.31 (2.208% above entry) / $69,650 position
Qty: 59
Risk/Reward Ratio: 11.51
Target 1: 25.412% lower ($16.00 area / $74,027.97)
Target 2: 31.064% lower ($19.93 area / $74,277.12)
Key Levels:
🔑 Current Price: $22.87
🔑 Sell Zone 1: ~$23.21
🔑 Sell Zone 2: ~$26.72
🔑 52-Week Low: $19.93
🔑 52-Week High: $35.81
🔑 Cash on Balance Sheet: ~$8.8B
🔑 Bitcoin Holdings: ~4,710 BTC (~$500M)
🔑 Analyst Consensus Target: ~$13.50
🔑 Q4 Earnings: Tonight March 24, after market close
🔑 Options Implied Move: ~6%
🎯 Target 1: $16.00 (25.412% / $74,027.97)
🎯 Target 2: $19.93 (31.064% / $74,277.12)
⚠️ Hard Stop Zone 1: $23.80
⚠️ Hard Stop Zone 2: $27.31
The bull case is real but fully priced in. $8.8 billion in cash is not nothing and Cohen has credibility. But 120x earnings for the possibility of a deal that has not been announced is speculation, not investment.
If tonight delivers no concrete M&A roadmap, the hype trade unwinds toward the analyst consensus. Two short zones mapped with defined stops.
$8.8 billion war chest. No deal yet. Earnings tonight. Shorting the hype.
GME Solid V: The Phantom Structure — Process Over Noise
Personal Preface: Process and Patience
At some point in trading, the noise becomes overwhelming.
You realize both price and fake financial gurus ("FURUs") are trying to lead you — and if you let them, they will lead you straight into financial oblivion.
Modern markets are heavily influenced by algorithms designed to exploit emotion and reaction. Meanwhile many FURUs amplify the noise because their goal is selling courses, subscriptions, or Discord memberships.
What traders actually need is something very different:
A community and a process that emphasize patience, structure, and disciplined thinking.
When you trust your process, the noise fades.
It doesn’t disappear — but it stops influencing your decisions.
An important realization follows:
A process is not immutable. It evolves.
Markets evolve.
The algorithms interacting with those markets evolve.
Your tools and frameworks must evolve with them.
When you truly trust your process, you begin to enjoy refining it. You experiment. You test ideas. You explore tools others overlook.
Eventually you develop ways of seeing structure that bring clarity — even when others disagree with the conclusion.
And that clarity is what matters.
Process vs Patience
Process is actually the easy part.
Patience is much harder.
Especially when FURUs constantly shout predictions like:
• "GME is going to $17."
• "GME is going to $33."
Point & Figure charts helped me develop patience because they remove the constant distraction of time and focus purely on price structure and participation.
The clarity this provides can be surprising.
Markets love forming large structures — and within those structures they form smaller ones.
These nested structures can fake traders out repeatedly. Without patience, traders react to the smaller moves and lose sight of the larger framework.
Macro Structure on GME
This chart highlights how clear the structure becomes when you step back.
The upper panel shows the Point & Figure structure , which removes time and emphasizes price movement and participation.
The lower panel shows the monthly candle structure for additional context.
Several structural elements stand out.
1. Overhead Supply
The red zone represents persistent supply that has capped multiple advances since the 2021 impulse move.
Point & Figure makes this structure very clear — repeated columns failing to expand through the same region.
2. Demand Structure
The green zone highlights an area where responsive buyers have repeatedly defended price.
Each test of this region has produced a reaction higher.
This behavior suggests demand absorption, but not yet decisive markup.
3. Structural Compression
The descending trendline shows how supply continues pressing downward toward demand.
At some point these forces intersect.
Markets do not remain in compression forever.
4. Structure Within Structure
Inside the larger macro structure, GME continues forming smaller structures that repeatedly:
• test demand
• test supply
• produce false breakouts
Without understanding the larger framework, traders can easily get chopped up reacting to these smaller moves.
Takeaway
The macro structure here is actually quite clear.
GME is trading inside a large compression regime defined by:
• persistent overhead supply
• responsive demand support
• progressively tightening structure
Environments like this tend to produce noise, fakeouts, and emotional trading decisions.
But when viewed through the lens of process and patience, the structure becomes much easier to understand.
And that clarity is the real advantage.
GME Solid: Sons of Liquidity — Weekly Structure
Note:
This is part of a series this chart references prior charts so you might want to read them to better absorb the information presented
Note on Current Noise Around GME:
There has been a noticeable increase in social media noise around GME lately — particularly bold directional claims made without structural context. This post is not an attempt to predict where GME is headed. The goal is to frame the current structure so traders can identify higher-quality entries, exits, and risk management points.
Blanket calls that GME is “going to $17” or “going to $33” — without clearly mapping the intervening levels and conditions — oversimplify a very technical tape. While those outcomes are always possible in a volatile name like GME, they ignore the reality that price typically interacts with multiple decision zones along the way.
Based on the current structure, levels such as 20.41, 25.48, 28.13, and 31.83 represent meaningful areas where order flow and participation can shift. Price may accelerate through them — or pivot sharply at any of them.
As much as I would like the price to go to 17 for cheap accumulation, we value process and patience over prediction, emotions and calling out the low.
Having said that let's proceed.
Preface
This is a weekly structural read, building on the prior macro and monthly work. The focus here is price behavior around key inflection zones and what current participation suggests about regime conditions.
This is not predictive and not financial advice — the goal is to document structure, not forecast outcomes.
Weekly Context
On the weekly timeframe, GME continues to trade within the broader corrective structure outlined in prior posts.
Price has largely rotated between:
the 0.382 retracement (~20.41) of the 2024 impulse
and the golden pocket resistance region
More recently, price has also spent time below the 0.5 retracement, reinforcing the idea that upside momentum remains contested.
The “Sons of Liquidity” — Demand Defense
One of the more notable behaviors on the weekly is the repeated responsive defense near 20.41 (0.382) and the associated demand zone.
These responsive buyers — what I’m referring to as the “Sons of Liquidity” — have consistently appeared as price approaches lower channel structure.
Key observations:
Demand tests tend to show higher relative volume
Downside probes are often contained and reclaimed
Price repeatedly rotates back toward equilibrium after tests lower
This behavior suggests active demand participation at lower levels.
Supply Behavior (The Phantom Pain Still Exists)
At the same time, overhead supply — the previously identified Phantom Pain structure — continues to cap advances.
However, relative to demand behavior:
Supply rejections have generally occurred on lighter volume
Upside failures have lacked strong expansion
Price has continued to compress rather than trend cleanly lower
Taken together, the current tape suggests that demand defense has recently been more active than supply pressure, though neither side has achieved decisive control.
Regime Read — Declining Energy Absorption
The most consistent interpretation of the current structure is declining energy absorption within a controlled range.
Evidence supporting this view:
Repeated demand defense without sustained markup
Overhead supply still respected
Weekly volume flattening (and declining on shorter averages)
CVD behavior remaining compressed rather than trending
Price continuing to rotate between key retracement bands
This profile aligns more closely with late-stage compression than with clean distribution or confirmed re-accumulation.
Momentum Context (RSI)
Momentum has improved modestly on the weekly.
RSI has:
previously shown bullish divergence
reclaimed the EMA
moved back above the 50 midpoint
and has so far held that region on pullbacks
This represents momentum repair, but not yet full bullish regime expansion.
For a stronger momentum confirmation, RSI would need to:
hold above 50 consistently
and begin pushing into higher bull-range territory
Bottom-Line Read:
Current weekly structure continues to reflect:
active responsive demand near lower structure
persistent but not dominant overhead supply
and gradually declining participation within the range
Until one side achieves clear acceptance beyond the current boundaries, the tape continues to favor rotation and compression over directional expansion, and trade efficiency remains limited in the middle of the structure.
GME Solid: The Phantom Pain: Overhead Supply & Monthly StructurePre-requisite Reading:
Preface:
I have many drawings on GME (AVWAPs, fibs, channels, SnD zones, trendlines, etc.). What I’m choosing to show here is intentional: a single framework that best illustrates the macro regime behavior I see.
This is not a predictive chart and not financial advice. I’m not here to tell anyone what GME will do next — I’m documenting regimes, acceptance, and recurring behavior.
Structure
This channel framework is built from fib channel bands, with lines color-coded to match my fib legend.
The correlations between these channel rails/centerlines and the fib bands were not planned. They are not perfect, but they are consistently close enough to be useful as a structural reference.
Band / Quadrant Map
0.114 (Blue): centerline of Quadrant 1
0.236 (Red): upper boundary of Quadrant 2 / below this begins Quadrant 2
0.382 (Light Green): approx. centerline of Quadrant 2
0.500 (Medium Green): lower boundary of Quadrant 2 (below this begins Quadrant 3)
0.618 (Yellow): approx. centerline of Quadrant 3
(Quadrants are simply the two sub-channels divided by their centerlines.)
Behavioral Repeat
The two thick white “Phantom Pain” trendlines highlight a recurring pattern: after GME rejects Quadrant 1, price continues to make descending acceptance tests in Quadrant 2 — as if overhead supply is “felt” repeatedly over time.
This is visible post-2021 and again post-2024, with similar slopes (~-25° vs ~-22°).
Momentum Confirmation
The 2024 impulse was materially weaker than 2021. Monthly RSI hit ~96 in 2021, while 2024 barely reclaimed the midpoint.
Post-2024 strength also produced RSI/price divergence, followed by continued weakening.
RSI is currently below its EMA, and volume continues to decline.
Current Context
Price is drifting toward the 0.382 band, which has historically been a key acceptance boundary in this framework.
Tradability/Risk-Reward:
I’m not predicting a breakdown — GME can change regimes abruptly — but based on this macro structure, the risk/reward here is not attractive in either direction.
This is not just a poor long location: it’s also a poor short location and a poor volatility-harvesting location. At these levels, price is positioned where extended chop or a sharp displacement in either direction is possible, and the structure does not provide clean entry/exit efficiency.
As an example: if you sold covered calls in the ~$25 area, this is the type of location where I’d be looking to buy-to-close and lock gains. Likewise, if you bought ATM puts in that same area, this is the type of location where I’d be taking profits, not pressing for continuation.
Personal Regime Triggers
Bullish trigger: I need monthly acceptance above 0.382 plus RSI reclaiming its EMA and holding above 50, and a break/acceptance above the descending supply trendline on a timeframe higher than daily. For this current month, I’ll allow a deep wick lower as long as the body closes above 0.382.
Bearish trigger: A monthly body close below 0.382 is enough for bearish confirmation — especially if there’s no constructive demand response from the 0.5 / 0.618 bands afterward(Wicks).
GME Solid: Ground Zero(The 3M Regime Structure)Preface: This is not a predictive chart. It is a zoomed-out macro reference of GME price action on the 3-month timeframe, meant to provide context for a larger thesis and follow-up charts on lower timeframes.
Authorship note: The framework and ideas are my own — ChatGPT helped me organize and communicate the concepts in more broadly understood terms.
Purpose of this chart: This chart is meant to show regime shifts in GME price behavior around major volatility impulse moves, not to call the next move.
Large macro channel (gray): The large corrective channel is the gray region (no boundary outlines). It is primarily defined by the volatility impulse tops in 2021 and 2024.
Macro midline (yellow): The large channel contains a yellow midline, which is partially obscured by the smaller channels. I view this midline as a macro regime pivot.
Smaller sub-channels (blue outlines): The two smaller channels split the large channel in half at the macro midline. These channels are outlined in blue and each has its own yellow centerline.
Lower sub-channel: The lower sub-channel highlights the corrective price action from the 2021 impulse up to the 2024 impulse.
Upper sub-channel: The upper sub-channel highlights the corrective price action since the 2024 impulse.
Importance of centerlines: On this timeframe, the centerlines matter as much as the channel rails. How price interacts with them is one of the most important signals in this framework.
Wicks vs bodies: On a 3-month chart, wicks into a line are meaningful rejection, while sustained candle bodies above/below a line represent acceptance.
Macro quadrants: The centerlines of the smaller channels also divide the structure into macro quadrants, which can help interpret where price is being accepted versus where it is only being probed.I label the structure into four macro quadrants, ordered from top to bottom:
Quadrant 1: upper sub-channel above its centerline
Quadrant 2: upper sub-channel below its centerline
Quadrant 3: lower sub-channel above its centerline
Quadrant 4: lower sub-channel below its centerline
Takeaways from this chart
Quadrant 1 is the “big boss of supply.” On this timeframe, price repeatedly wicks into Quadrant 1 but fails to gain acceptance with candle bodies, including after both major volatility impulse moves.
Post-2021 (the sneeze): Price spent multiple quarters oscillating between Quadrant 2 and Quadrant 3, showing prolonged indecision over where price should be accepted.
Spring 2022 regime shift: By Spring/Summer 2022, the market resolved that indecision — Quadrant 2 began behaving as supply, while Quadrants 3 and 4 became the primary arena where acceptance was fought over.
Winter 2024: Price achieved acceptance deeper into the structure, including acceptance in Quadrant 4, followed by a test of the channel boundary.
Spring 2024 volatility event: The volatility impulse launched price into the upper sub-channel, resulting in a test of upper structure (including the upper boundary).
Fall 2024: After a period of post-impulse indecision, price shifted into clearer acceptance of Quadrant 2, which remains a key macro regime marker in this framework.
Gamestop short term buy 260204GME: bullish daily chart
Gamestop went through the short term resistance of $22.26 like I wrote in my previous post about GME.
Short term support: $21.85
But the weekly chart is still bearish, the mid term resistance is $25.79.
Short term indicators:
Par SAR: buy
EMA cross: buy
Supertrend: buy
Stoch RSI: buy
MACD: buy
Weekly chart: sell
Monthly chart: buy
Fundamentals are strong.
GME News Pop into Supply — Buy the Rumor, Sell the News SetupNYSE:GME 📊 | Buy the Rumor, Sell the News?
🔴 Resistance / Supply
• 24.64 → 25.01
• 25.23 (major sell zone)
🟢 Support / Demand
• 22.99 (imbalance / decision level)
• 22.52 → 22.05
• 21.45 (major support)
Trade the reaction — not the headline 🎯
GME | Will We See Another Meme Rally | LONGGameStop Corp. engages in offering games and entertainment products through its ecommerce properties and stores. The firm's stores and ecommerce sites operate primarily under the names GameStop, EB Games, and Micromania. It operates through the following geographical segments: United States, Canada, Australia, and Europe. The company was founded by Daniel A. DeMatteo in 1996 and is headquartered in Grapevine, TX.
GME, is poised for another jockey play pump anytime soon!GME is one of those stocks which is known for its sudden but short parabolic events -- and they dont come often. An event that only occur every couple of years.
The last big pump was from May 2024 when it tapped its peak at 64.0 levels -- and it did this after waiting 40 months. Thereafter, the meme stock did a hefty trim tapping 78.6 levels. and dropping back to sub 20 zone, a bargain area where most buyers re-converge for another few seasons in prep for a north pressure buildup.
This month, January 2026 -- a basing event has been spotted based on our diagram after 20 months of waiting. An upside pressure is imminent at current levels and its ripe for another jockey play soon for that elusive big move up north.
A seeding opportunity is ideal at current levels for a possible x3 play.
Spotted at 20.0
Target previous peak at 64 - 100.
TAYOR.
Trade mindfully.
GME Short-Term PUT Setup — Pre-Earnings Bearish Edge📈 GME Trading Info — Earnings Signal (2025-12-09)
🎯 Trade Direction
BUY PUTS
Confidence: 60% (Medium Conviction)
Risk Level: Moderate — Katy/LLM conflict detected
🔢 Options Setup
Strike: $23.00
Expiry: 2025-12-12 (3 days)
Entry Range: $0.90 – $0.92
Target 1: $1.35 (50% gain)
Target 2: $1.80 (100% gain)
Stop Loss: $0.65 (28% loss)
Position Size: 2% of portfolio
📊 Market Snapshot
Current Price: $23.44
24h Move: +0.59%
Implied Move: $2.27 (9.7%)
IV: 133% (high)
RSI: 82.0 (overbought)
Stochastics: 89.0 (overbought)
PCR: 0.71 (neutral)
🤖 Katy AI vs. LLM Conflict
Katy Prediction: Bearish → -0.97% move to $22.71
LLM Recommendation: Buy Calls
Katy Confidence: 50%
⚠️ Critical: Trade aligns with Katy’s bearish bias despite LLM call recommendation.
📰 Sentiment Overview
Mixed earnings preview: focus on “Ryan Cohen’s No-Hype Turnaround”
Overbought technicals suggest downside potential
Neutral options flow; unusual activity at $12 calls (speculative retail)
Institutional flow appears neutral
⚠️ Key Notes
Earnings volatility high — premiums expensive, fast moves expected
Katy AI shows consistent downward pressure (95% of predictions below current price)
Tight stop-loss essential; consider closing early if gains materialize
Low Katy confidence → position size conservative
BEYOND MEAT: How One Trader Pumped A Stock 1500%!
📈What It's All About:
The chart you are looking at is not one of a sh*tcoin, it’s a stock listed on the New York Stock Exchange! The company is called Beyond Meat, a pioneer of the artificial meat market. A set of commercial failures and debt problems brought the stock down by 99.79% from the highs when the pump started!
📈The Pump:
A Reddit account called "Capybara Stocks" disclosed buying roughly 3.1 million BYND shares around mid-October and published a detailed bullish thesis, arguing the note exchange plus equity issuance, which triggered dilution fears, actually reduced bankruptcy risk and improved the balance sheet.
His post highlighted heavy short interest/borrow costs and retail options flows that amplified the upside.
📈What Happened Next:
It was a typical short squeeze on an epic scale. With the 54% short float, a sudden buying spree started triggering stop losses and key options levels. People who sold the options and expected to make easy $100 were now looking at $1,000+ potential losses and were scrambling to buy shares to "cover" their sold options.
📈GameStop Case:
This scenario closely mirrors the GameStop stock pump ( NYSE:GME ) during 2020/21 when the stock was pumped by Reddit trading group WeTradeStocks from $17 to $483 within days (a 2,840% surge), driving some hedge funds into near bankruptcy.
📈What Now:
As BYND stock price has already lost 50% from the recent highs and seems to want to go lower, the company’s current prospects remain bleak with revenue projected to drop 14% next year.
But the CapybaraStocks trader made $10,000,000 in profits and says he kept a sizeable position in the stock as he believes in it “long term.” Many option traders made small fortunes, and the people who were on the opposite side of the trade went bankrupt overnight.
📈Conclusion:
Hats off to the legends who pumped the stock to the moon and HODLED!
To those who lost money: C’est la vie 😎
Yours Truly,
Greg🌹
GME Market Strategy: Risk-Managed Swing to Resistance🚨 GME: GameStop's Great Heist! 🎮💰 Bullish Swing/Day Trade Plan
Asset: GameStop Corporation (GME)Market: NYSE (Stock)Strategy: Swing/Day Trade with a "Thief's Layered Limit Order" Approach 😎
Get ready, traders! We're about to pull off a bullish heist on GameStop (GME) with a slick, calculated plan to outsmart the market! 📈 This setup is packed with technical firepower and a cheeky vibe to keep it fun yet professional. Let’s dive into the Thief’s Wealth Strategy Map and steal some profits! 🕵️♂️
📊 Technical Breakdown: Why GME is Ripe for the Taking
Our bullish setup is backed by a rock-solid technical foundation. Here’s the intel:
🔥 382 EMA Breakout: GME has smashed through the 382-period Exponential Moving Average, signaling strong bullish momentum. This breakout is our green light for action! 🚦
💥 Accumulation Zone Pressure: Buyers are stacking up in the accumulation zone, pushing prices upward like a crew of bullish bandits ready to raid the market.
🕯️ Heikin Ashi Reversal Candle: A gorgeous bullish Heikin Ashi candle has emerged, screaming BUYING POWER and confirming the trend reversal. The bulls are in control! 🐂
🗝️ Thief’s Edge: We’re using a layered limit order strategy to sneak into the market at multiple price points, maximizing our entry precision.
🕵️♂️ The Thief’s Entry Plan: Layered Limit Orders
This isn’t your average “buy and pray” strategy. We’re using a layered limit order approach to enter like sneaky market thieves. Set your buy orders at these levels:
🪙 $24.00
🪙 $24.50
🪙 $25.00
🪙 $25.50
🪙 $26.00
Pro Tip: Feel free to add more layers based on your risk appetite and account size. The more layers, the merrier the heist! 😜 You can also enter at any price level within this range if you prefer a single strike. Just keep it sharp and calculated!
🛑 Stop Loss: Protect Your Loot
🛡️ Set your stop loss at $23.00 to guard against unexpected market traps. ⚠️
Note: Dear Ladies & Gentlemen (Thief OGs), this is my suggested stop loss, but it’s your heist! Adjust it to suit your risk tolerance. Trade smart, and don’t get caught by the market cops! 👮♂️
🎯 Target: Cash Out Before the Barricade!
🎰 Our profit target is $31.00, where a police barricade zone (aka strong resistance) awaits. This level is flagged as overbought with a potential trap for greedy thieves. 🪤 Escape with your profits before the market clamps down!
Note: Thief OGs, this is my target, but you’re the boss of your trades. Take profits at your own discretion and secure the bag! 💸
🔗 Related Pairs to Watch (Correlated Assets)
To maximize your market intel, keep an eye on these correlated assets (all in USD):
🎥 NYSE:AMC Entertainment (AMC): Another meme stock darling, often moving in tandem with GME. Watch for similar bullish setups or divergences.
📊 AMEX:SPY (S&P 500 ETF): GME’s wild swings can be influenced by broader market sentiment. If SPY is bullish, GME’s momentum could get an extra boost!
📱 NYSE:BB (BlackBerry): Another retail-favorite stock with potential for correlated volatility. Check for breakout patterns here too.
Key Correlation Points:
🚀 NYSE:GME and NYSE:AMC : Often ride the same retail-driven waves, especially during short squeezes or social media hype.
⚖️ AMEX:SPY Influence: If SPY shows weakness, GME’s bullish momentum might face resistance. Stay alert!
🔍 NYSE:BB as a Signal: If BlackBerry is pumping, GME might follow suit.
📝 Final Notes for the Heist
This is a high-octane, bullish setup designed for swing or day traders with a taste for calculated risk. The Thief’s Layered Limit Order Strategy gives you flexibility to enter the market like a pro, while the technicals (382 EMA breakout, Heikin Ashi, and accumulation pressure) provide a solid foundation. 🏦
Stay sharp, manage your risk, and don’t get greedy—escape with your profits before the market throws up a barricade! 🚓
✨ “If you find value in my analysis, a 👍 and 🚀 boost is much appreciated — it helps me share more setups with the community!”
#Hashtags: #GME #StockMarket #SwingTrading #DayTrading #Bullish #TechnicalAnalysis #TradingStrategy #MemeStocks