Can the Indian Rupee Survive the Ultimate Dollar Surge?Macroeconomics and Economics: The Dollar Squeeze
The Indian rupee plunged to fresh historic lows in May 2026. USD/INR breached the 95 mark on May 4-5, 2026, then hit an all-time high of 95.80 on May 13 . Late May saw the pair approach 97 per US dollar, the deepest level on record.
Foreign portfolio investors pulled approximately $21 billion from Indian equities during March and April 2026. March alone delivered a record monthly outflow of ₹1.17 trillion, the largest single-month FPI exit ever. April followed with ₹60,847 crore ($6.5 billion) in additional withdrawals.
The massive capital flight aggressively strains domestic economic stability. Total 2026 FPI outflows reached ₹1.92 trillion in just four months, exceeding the entire 2025 total . Month-end dollar demand from oil importers further exacerbates the rapid currency depreciation.
Furthermore, global uncertainty consistently drives investors toward the US dollar as a safe-haven ass et. Investors redirected capital toward South Korea and Taiwan AI chip plays through Q2 2026. The absence of a major AI value chain in Indian equities accelerated the reallocation. Consequently, India faces imported inflation that threatens everyday household budgets.
Geopolitics and Geostrategy: The Hormuz Chokepoint
Geopolitical tensions in the Middle East directly cripple the Indian currency. The US-Israel war on Iran began February 28, 2026, triggering an immediate global oil shock. Iran responded by effectively closing the Strait of Hormuz to commercial shipping.
The strategic bottleneck severely disrupts global oil and gas supply chains. WTI crude surged from $65 pre-conflict to a $119.50 peak on March 9, 2026. Brent crude briefly approached $126 per barrel during the same window.
India imports approximately 85-88% of its crude oil requirements. Because international oil markets mandate dollar payments, India suffers a severe double blow from elevated prices and currency depreciation. Dented peace deal hopes guarantee prolonged geostrategic instability across the region.
Furthermore, sustained Iran tensions keep oil prices elevated through Q2 2026. Renaissance Investment Managers estimates $85-95 sustained oil could trigger $40-50 billion in additional FPI outflows. India's net oil imports equal roughly 3.5% of GDP, making it among the most oil-vulnerable economies globally. The government recently raised import duties on gold to reduce non-essential dollar drains.
Industry Trends, Business Models, and Leadership
A weaker rupee dramatically shifts global industry trends and corporate strategies. Import-dependent sectors face crushing margin compression as raw material costs explode . Management teams must immediately overhaul their business models to survive the currency shock.
Decisive leadership remains critical as executives hedge forex risks aggressively. Conversely, export-driven industries reap massive windfall profits from rupee weakness.
Pharmaceuticals, software services, and textiles benefit substantially from dollar-denominated revenue streams. Companies like Infosys, TCS, and Wipro capture material exchange rate disparities through 2026. Indian generic drug manufacturers also gain pricing power in US export markets.
Moreover, the RBI announced a substantial $5 billion USD/INR buy/sell swap in late May 2026. The central bank reactivated its monetary toolkit including possible rate hikes, special deposit schemes, and tighter outbound FDI scrutiny. The aggressive central bank posturing temporarily firmed the currency against relentless downward pressure. Bloomberg confirmed RBI intervention through state-run banks selling dollars in spot markets.
Technology, Cybersecurity, and High-Tech Innovation
India's massive technology sector navigates a complex dual reality amidst currency depreciation. IT service exporters generate tremendous rupee-denominated revenue boosts from dollar-paying global clients. Tata Consultancy Services, Infosys, and Wipro capture the largest windfall from the rupee's collapse.
However, domestic high-tech innovation suffers significantly due to exorbitant hardware import costs. Procuring advanced semiconductors and specialized electronics now drains domestic capital rapidly.
The AI capital flight away from India compounds the technology sector's structural challenge. FPIs hold roughly $1.75 trillion across three major global semiconductor firms versus just $750 billion in India's entire equity market. Indian firms cannot compete for the global AI infrastructure dollar without local chip manufacturing scale.
Furthermore, cybersecurity budgets face severe strain across enterprise India. Companies must purchase critical security infrastructure and software licenses in premium US dollars. Protecting digital assets becomes exponentially more expensive during a currency crisis. Tech leaders must balance windfall software profits against soaring infrastructure expenses.
Science, Patents, and Company Culture
Currency volatility directly impacts scientific research and global patent analysis. Indian firms filing international patents face sharply higher dollar-denominated legal and registration fees. The financial barrier stifles global intellectual property expansion for emerging startups.
Meanwhile, multinational corporations increasingly leverage Indian talent to optimize their operations. Indian-born CEOs lead numerous trillion-dollar American tech giants.
A robust company culture of engineering excellence consistently drives this remarkable corporate dominance. Ultimately, the falling rupee accelerates the outsourcing of scientific research to Indian laboratories. Global pharmaceutical, semiconductor, and software firms capitalize on currency arbitrage to fund cutting-edge innovation cheaply.
Moreover, India faces 2026 as potentially the worst FPI year since markets opened to overseas investment in 1993. Chief Economic Adviser V. Anantha Nageswaran noted profits for the 500 largest Indian publicly traded companies grew over 30% annually since the pandemic. Strong corporate profitability provides a domestic cushion as retail investors step up participation. However, the broader rupee trajectory depends on Hormuz developments, US bond yields, and the speed of FPI reversal.
INRUSD
DXY v's Brazil Russia India China B.R.I.C. CurrenciesNote how the two large pattern #HVF's kept you dollar long as the main directional trade from 2011 to 2022
But things may be turning around and this trade may, potentially be reversing.
Often when commentators have given up on the idea
of a multi polar world, end of dollar dominance , as price keep going the opposite direction.
Is when the trade actually starts to kick into gear.
These are major resource nations , with 40% of global pop.
30% of the land
and well over a 1/4 of global GDP
Would make sense to see this basket of currencies outperform our beloved Greenback.
USD / INR - 2025 & 2026 will decide the path3M candle (Q1 2025) printed a bearish signal with a top at $88.
Structure looks weak for now, a break below this candle could confirm a bearish shift.
DXY is cooling off due to a dovish Fed outlook, easing inflation, and broader macro rotation into risk assets. If the 100–102 zone breaks, expect extended downside which could support INR, gold, crypto, and other non-USD assets.
First Support - $63.64
INRUSD - Indian Rupee Collapse UPDATEMy initial post on INRUSD was back on Sept 2022 more than 2 years ago.
My update is more of the same going forward. INR will continue to collapse despite its nominal economic growth.
When the economy is very small relative to its population, the growth rate doesn't matter as if a major economy like the US has similar growth. It's like comparing apples to oranges. But I certainly understand how people can be misled. That's why I am trying to explain it to you here today.
RDY: Top candidate to go long indian shares...$RDY has a very strong monthly trend that is currently active, and also a strong daily chart, showing a trend is now active. We can go long risking a fall under the red line on chart, if aggressive, following the daily signal but aiming to capture the monthly trend as well. This would be a huge reward to risk position if it were to pan out favorably for us.
I see the $INRUSD chart as significantly strong, and similar to the period from 2016 to 2018, and $RDY has a good valuation here, as well as substantial growth potential going forward. Free cash flow yield is 7.93%, EPS growth is positive in the last quarter and in the last year, and they are not too indebted, the company certainly has good liquidity and sales are steadily albeit modetly growing.
Best of luck,
Ivan Labrie.
USDINR (U.S.Dollar / Indian Rupee) Currency Analysis 29/03/2021on a bullish impulsive wave we can see there exist a Hidden Bullish Divergence with MACD which is the sign of trend Continuation, followed by a Milled Bullish Divergence
there total of 2 Targets Defined by Fibonacci projection,
79.50 Rs seem to be a good target for the end of 2021
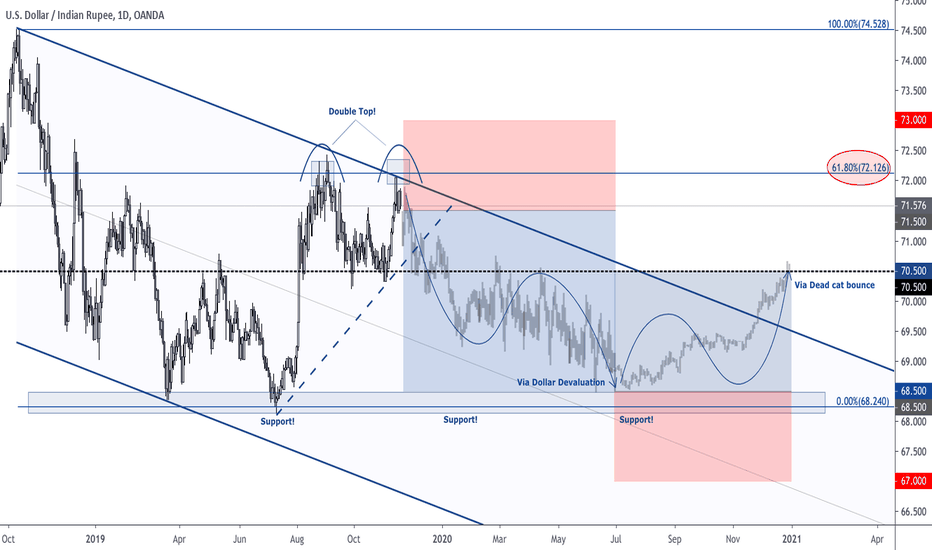
Large Swing In Play For USDINR in 2020Here we are tracking the 2020 macro map for USDINR, a high yielding EM currency. The expansion in volatility here will come from CB coordination, and being short USDINR which generally would also support a view for better risk appetite means it acts a great portfolio hedge for those looking for high carry.
On the INR side, macro figures are starting to indicate further upside although still stuck in low gears. The tax cuts from the fiscal side doing some of the heavy lifting thanks to Modi (India's version of Trump). Inflation is subdue with a lot more slack left in the labour market and a cheap commodity board.
Should investors see the deficit handled appropriately then all boxes are checked for capital flows into India. Demand for INR looks set to improve and combined with the USD devaluation theme it makes a great few months for INR to see some appreciation.
Risks to my thesis come from US-China protectionism, private capex not picking up (low odds after the attractive tax cuts) and to a lesser extent if RBI push the INR down by accumulating.
UShort
USDINR Daily Chart: An ending diagonal coming home?USDINR seems to have completed a 5 wave move as per ending diagonal pattern shown as 1-2-3-4-5, and also an impulse wave of higher degree shown as (1)-(2)-(3)-(4)-(5). Can expect a fall to 70.41 by 30/08 - 04/09
A move above 72.30 invalidates the pattern.
Wave count in Nifty too supports short term weakness.
ULong
USD/INR: Buy & Sell Full Trade Setup !!BUY & SELL Above Given Chart or
You Can Also set Own Risk reward.
Let see what Will be Next Move.
Warning- I m Not a Financial Advisor this idea Only For Educational Purpose Only.
Thank You !!
U
ULong
UShort