GBPJPY hourly pullback after inside day breakoutGBPJPY has an inside day breakout this morning as both GBPUSD and USDJPY are strong.
Here we got this little pullback long opportunity,
I‘ll be interested in this long, and the TP2 could be the entry of the bearish bat.
Let's see how it goes yo!
Inside Bar


JD inside day after 8ema correction JD had been so strong to make a new all time high a few days ago.
It gave an inside day after daily 8ema correction, which will be a very good trade for me!
I'll be willing to take the inside day breakout.
Let's see how it goes yo!

Support buy for CHWYNYSE:CHWY Buyers held the 50 day MA along with it being an inside day. I'll be looking at the possible support buy through the 41 against the lod.

GBPUSD inside 30 after inside day breakdownGBPUSD has a quite good trade here.
It's an inside day breakdown in a month that broke the inside month,
here I got this inside 30 after pulling back to hourly resistance.
Only want to do the breakdown short!
Let's see how it goes yo!

GBPCHF 4hr supply pullback short Both GBPUSD and USDCHF have inside month breakdown in may,
that is , to look for GBPCHF short opportunities is one of my main focus in the following days.
Here I got this 4hr supply pullback trade opportunity,
as the GBPUSD starts to bounce a little bit, I'll be waiting for this trade to short!
Let's see how it goes yo!

ETHBTC - Bullish Inside Bar / Pin BarA bullish inside bar / pin bar pattern has formed. If price can break out strongly enough to retake the trendline it had broken out of a week ago that would be extremely bullish and could mark a long term bottom in ETHBTC. Giddyup!

EURTRY daily bat battern and inside day combination shortEURTRY has a daily bearish bat pattern and got an inside day last Friday.
Worth a shot for a carry trade yo
Let's see how it goes !

USDJPY 4hr supply after inside week and inside day breakdownUSDJPY had been consolidated for quite a while.
Finally, it breaks both the inside day and the inside week to the downside today,
so I'll be very interested in taking some intraday short to get on the train!
This 4hr supply zone is quite a good trade
Let's see how it goes yo!


Possible feeler in COST against the 50 day MACost is trading within the 324-270 range (refer to weekly) and has put in back to back inside days with volume drying up. I'd be looking to grab a feeler through 311 against the 303.


GS inside day after ER!One of my most favorite trade!
JPM's breakdown previously had worked so well to hit the TP2,
I'll also be interested in this GS trade today and be willing to take both sided!
Let's see how it goes yo!

A very important ER and inside day for JPM and the marketJPM set to report its earning before the market opens today.
It closed as an inside day yesterday, and there are dual 0.618 and S/D combination
for the sell high @ 116 and the buy low @ 87.
Which, makes the direction of the inside day breakout very important!
Also, as the world suffers from coronavirus,
how do the earning reports perform under the strong pressure is the whole world's focus.
and JPM will be the one that ring the 1st bell!
Let's see how it goes yo, no matter where it breaks,
I'll be interested in some intraday trade with the direction it breaks.

EURUSD inside day after inside week breakdownIt's the last trading day in this week, and don't forget it's still a week that the inside week broke to the downside.
The inside day today I'll be much more interested in the breakdown than the breakout.
Although in the past a few days that the dollar had been quite weak,
but still, I'll respect the pattern to look for short today.
If it breaks to the upside, I may probably let it go and wait for next week to trade Euro.
Let's see how it goes yo

AUDJPY weekly AB=CD and inside week combination I don't tend to trade the weekly chart directly,
while this weekly pattern still worth some bullish trading plan in intraday trading!
Quite a good combination of AB=CD and inside week breakout,
I'll be willing to look for some setup to long in the following 3 days.
Let's see how it goes yo!

AUDUSD hourly structure pullback after inside week breakoutAUDUSD is the pair that broke the inside week this week,
to trade this perspective, there weren't many good set-ups in the past a few days.
Here we got this little structure breakout pullback trade that is worth a shot.
Also, no matter the result of this trade, Aussie will also be my main focus tomorrow on NFP.
Let's see how it goes yo!

AT&T (T) daily shooter long opportunityThe market started to show great sector rotations after such a huge correction.
To build some positions again, sectors that are more defensive despite the coronavirus are my main focus now.
T is one of the name that I'll be looking at.
Solid business, nice dividend yield in such price level, and a nice setup to trade!
If this daily shooter is able to break to the upside, I'm interested in taking some long here.
Let's see how it goes yo!

NZDUSD inside day breakdown with 4hr gap supply shortNZDUSD had been through several weekly harmonic patterns and finally broke a significant new low.
This is something to make sure the bearish mindset.
Today breaks the inside day to the downside, I would be willing to take this pullback short.
Let's see how it goes yo!

Gold 4h Shows Bearish SignGold 4h Shows Bearish Sign
Although Gold breaks new high yesterday
but failed to maintain above 1700
Now 4h chart alraedy fromed bearish
engulfing and bearish Inside Bar Break down
Therefore we can sell gold based on the Inside Bar Strategy
Entry : 1668.17
SL: 1683
TP1: 1650
TP2: 1630
TP3: 1610

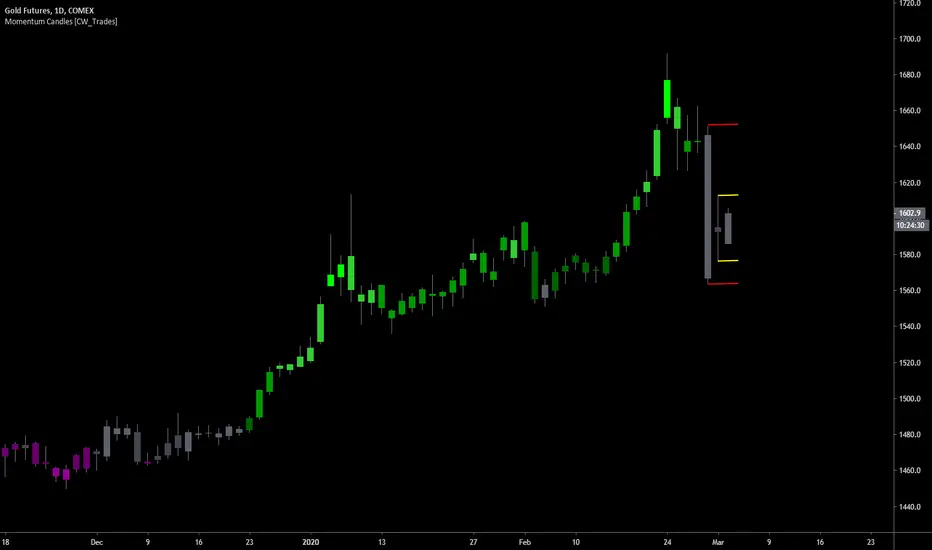
Gold Inside Candles#gc1! #gold – After last week’s market selloff which dropped gold price with it, gold created an inside candle on Monday which could be an indication of a reversal back to the upside ahead.
An inside candle is formed when price trades within the high and low range of the previous candle, making the candle an inside candle. The inside candle is therefore a two candlestick price pattern. An inside candle is also similar to a bullish or a bearish harami candlestick pattern. The main difference being that with an inside candle, the highs and lows are considered while the real body is ignored.
An inside candle is generally considered to be a reversal pattern formed when the second candle or candlestick is engulfed within the previous candlestick’s high and low.
In this gold chart, Friday’s selloff is the first candle in the inside candle pattern shown with two red lines extending from its high and low. Mondays candle is completely inside Fridays high and low and is a long-legged doji candle, where price has a small body and two long wicks extending above and below it. These long wick represent traders attempting to push price higher and lower on Monday, but ultimately closing price near the open which creates a small body. Doji candles represent trader indecision and indicate that they were mostly undecided as to which direction to move price during the course of the day.
The most recent candle, Tuesdays, is also creating another inside day for now as it is trading inside of Mondays total price range indicated by yellow lines.
What we want to see going forward in the immediate short-term is for a price move above Mondays high in price, or above the upper yellow line of Mondays doji candle. From there, a move above Fridays high in price(upper red line) would be further indication that gold traders are still bullish and ready to take price higher.
The overall view on gold remains bullish.
Bitcoin 8500 Inflection Point: Fake Now Or Break To 7Ks?#Bitcoin is about to trigger a new sell signal. Just because we operate a long only strategy does not mean we fail to observe bearish price action, or hold on to some limiting opinion or bias. It means we do nothing with the signal and instead WAIT until our criteria aligns for the next swing trade long position. In this video I briefly cover the levels and location where we believe there is a high probability for such a bullish reversal to materialize.
The following are key points that I make in the video so that you do not have to watch the whole thing.
1. In short term trading especially, you cannot hold onto opinions. We operate long only because it makes more sense for the risk tolerance allowed for this particular strategy. Our choice is not based on an opinion, it is based on the boundaries of our risk tolerance and realities of an unregulated market. Again, you do not have to trade both sides of a market to generate a positive return over time (see our track record).
2. IF price decisively clears the 8400 level, it can lead to a test of the next proportional support area (8K to 7350). This is relative to the .618 retrace of the most recent bullish impulse (6450 to 10,400). This does NOT mean it WILL test the zone, what it means is that the PROBABILITY of such an outcome in increased. Probabilities CHANGE relative to the unfolding price action. IF the 8500 area holds, (price action fake out) we are open to taking a swing trade long around current levels, but order flow MUST confirm the reversal first.
3. The 8K to 7350 zone is also an attractive location for both our swing trade strategy AND for long term inventory (position trade). IF price can establish a reversal pattern or structure within this area, we will be prompted to take a swing trade long also. In terms of inventory, we can add with or without a setup, but risk will have to be adjusted by the position size at the time of entry. Keep in mind, swing trades and position trades are completely SEPARATE strategies and must not be mixed together.
In the game of market timing, we face a highly random environment. There are no rules (except for regulatory and exchange rules) which do little to define how to play this game successfully. The ONLY control we have is the set of rules that we MUST create for ourselves. No rules means emotions, feelings and "common sense" will dominate your decision making process which the market will randomly reward (followed by overconfidence and an empty account). Rules not only protect capital, but also help to minimize randomness and assume risks that are quantified. We follow rules, and over time, that is what produces results. They don't have to be complex, but they must be present in order to operate with any consistency. One of our simplest rules? Wait for the candle to close before taking action.

LINK Is About to Go Nuclear*DISCLAIMER* The weekly candle is not yet closed!
That aside, if the weekly candle closes somewhere in the price range it is at right now, we are looking at a very bullish setup. The setup is an inside bar / pin bar fakeout, on the weekly, on major support, and is with the prevailing trend. You really can't ask for much more. It is important though to wait until the weekly candle closes to make any trading decisions.
