$QQQE NASDAQ 100 Equal-Weighted ETF: Breaking Out?Overview
The NASDAQ:QQQE NASDAQ 100 Equal-Weighted ETF has recently shown signs of breaking out from a period of consolidation. Since reaching its all-time high on October 27, 2025, the ETF has been trading within a wedging pattern. This technical formation typically indicates the potential for a resumption of the previous uptrend.
Recent Price Action
On the most recent trading day, the intraday high for NASDAQ:QQQE surpassed the previous high set on October 27th. This development reinforces the notion that the ETF may be poised to continue its upward movement.
Trading Strategy
In anticipation of a breakout and sustained uptrend, a half-size position has been initiated. The 21-day Exponential Moving Average (EMA), represented by the blue line on the chart, will serve as the reference point for setting a stop loss to manage risk.
Risk Management and Disclaimer
Readers are strongly encouraged to perform their own analysis and adhere to personal trading strategies. All investments involve inherent risks, so it is crucial to make careful and informed decisions when allocating capital in financial markets.
IWM

IWM near important key level that may break during premarketSunday Jan 25/2026
I like to trade IWM with Options because contracts are relatively cheap. You get contracts around $30-$50 and if traded properly you can make up to 100% or even more every day.
So what i'm seeing for this week, or even tomorrow, is that price has rejected an all time high and now is performing a pullback. But here is were context is very important and all those who know me, know that i trade based on context.
IWM has rejected last Friday's opening price and during the extended session we have achieved levels even below the closing price.
So, from a structural point of view we are below VWAP which i interpret as sellers being in control and we are on our way to that 1 hour EMA 200. This is going to be our key level. This level also holds a +OB that has not been tested. So we need to watch for that level. If the price retracts then we have our Fibonacci levels and 5 minute EMA 200 may be a good retracement level.
If we breakout down then we have a liquidity level in the 260s. If we bounce we can aim those 266s.
More important, we dont predict; we react on what price does. So tomorow we'll take an eye during premarket session. My idea is to take advantage of IWM during market opening.
Follow me for more.

didn't catch silver? Here are two alternatives to buy nowAfter selling PSLV ( and I regret it). Here are 2 setups showing the same accumulation before exploding. Ford and RTY. I will buy TNA because I am greedy if you are not, you may go for any ETF copying russel index

Opening (IRA): IWM March 20th 251 Monied Covered Call... for a 246.77 debit.
Comments: Starter position, buying a one lot and selling the -75 delta call against to emulate the delta metrics of a 25 delta put, but with the built-in defense of the short call and to take advantage of hightened IV on the call side.
Metrics:
Max Profit: 4.23 ($423)
BPE (Buying Power Effect): 246.77
ROC at Max: 1.71%
Will generally look to add at intervals, assuming I can get in at break evens better than what I currently have on.

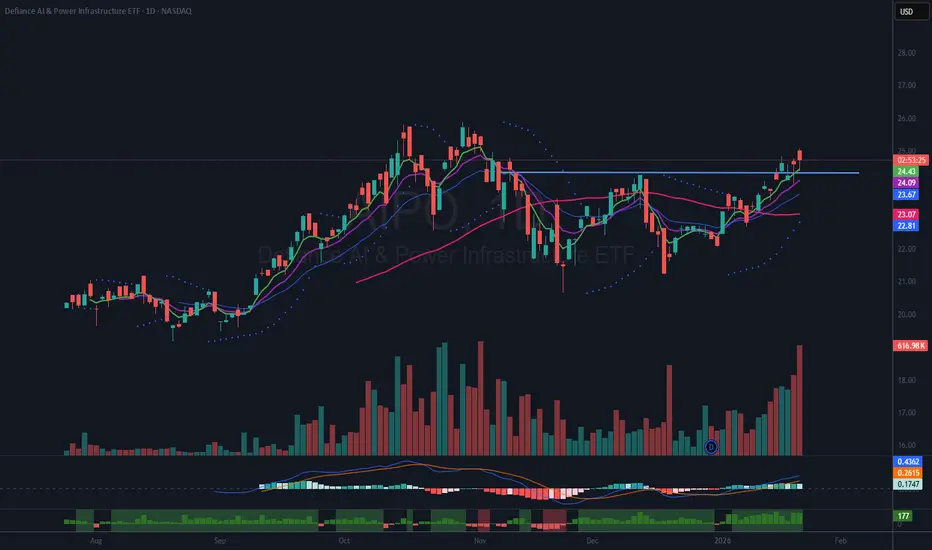
Analysis of the $AIPO – A.I. and Power Infrastructure ETFIntroduction
The NASDAQ:AIPO – A.I. and Power Infrastructure ETF is an investment vehicle that integrates exposure to companies involved in both power generation and artificial intelligence. This unique combination aligns with the growing demand for technological advancement and energy infrastructure, positioning it as a compelling option for those seeking to capitalize on the expansion of the A.I. sector.
Fundamental Perspective
From a fundamental standpoint, the ETF comprises companies considered to be at the forefront of the rapidly evolving artificial intelligence landscape. These organizations play a pivotal role in shaping the future of A.I., reinforcing the fund’s relevance in today’s market environment.
Technical Analysis
Technically, the NASDAQ:AIPO ETF appears poised to break out of its basing pattern, suggesting potential upward momentum. This observation supports the consideration of an entry point for investors who are monitoring technical signals.
Investment Approach
A half-sized position has been initiated with the intention of maintaining the investment over a longer time horizon. To manage risk, a stop loss has been established: the position will be reconsidered should there be two consecutive closes below the 21-period Exponential Moving Average (EMA), indicated by the blue line on the chart.
Key Holdings
Notable holdings within the fund include companies such as NYSE:PWR , NYSE:ETN , NYSE:GEV , NYSE:VRT , TSX:CCO , NASDAQ:CEG , NYSE:BE , among others. These constituents contribute to the fund’s exposure across both power infrastructure and artificial intelligence sectors.
Important Disclaimer
Readers are strongly encouraged to conduct their own analysis and adhere to individual trading strategies. All investments carry inherent risks, making it essential to make careful and informed decisions when allocating capital in financial markets.
Small Caps Pause on Tariffs – Key Levels to Trade IWMAMEX:IWM Daily Outlook 📈
Tariff headlines cooled the hot streak, but structure stays bullish while above 261.32. Small caps still showing relative strength vs SPY/QQQ — this is chop, not a trend reversal (for now).
🔑 Key Levels
• Pivot: 261.32 🎯
• Resistance: 265.75 → 267.18 🚧
• Support: 259.27 → 258.24 🛡️
🧭 Trade Thesis
Bull Case 🟢
– Reclaim 265.75 → run to 267.18
– Dips holding 261.32 = buy structure
– Best look: VWAP reclaim + OR hold
Bear Case 🔴
– Acceptance below 261.32 flips bias
– Targets 259.27 → 258.24
– Below 258 opens 255 zone
🎯 Plan
Buy weakness > chase highs
Flip short only if 261 fails
Risk defined at the pivot
Levels > Noise

Why “End the Fed” Is a Dangerous For Investors“Hate & End the Fed” sounds bold and rebellious. It plays well on social media.
In the real world, it is one of the most dangerous ideas an investor can support.
Not because the Federal Reserve is perfect — it isn’t.
But because its independence is the firewall that prevents politicians from abusing it and collapsing the dollar’s currency payment system.
What People Get Wrong About the Fed
The Fed does not:
Print money and spend it
Fund government deficits
Buy Treasury bonds at issuance
Decide fiscal policy
Those actions are illegal.
The Fed’s job is narrow and operational:
Run the payment system
Set short-term interest rates
Manage bank reserves
Act as settlement agent for Treasury
Ending the Fed would not end “money printing.”
It would remove the last institutional constraint between politics and the payment system.
What Replaces the Fed If It’s “Ended”?
There are only two possibilities:
Direct political control of money
A Treasury-run payment system
Both are historically disastrous.
Without an independent settlement authority:
Spending pressure becomes electoral pressure
Rates become political tools
Inflation is postponed, not prevented
Currency credibility erodes
Markets recognize this instantly.
Why Investors Should Care (Deeply)
Capital does not fear central banks.
Capital fears loss of constraint.
Once investors believe:
Monetary discipline is optional
Rates are politically set
The payment system can be bent for votes
They reprice risk:
Bond yields rise
FX weakens
Equity multiples compress
Capital seeks safer jurisdictions
This is how reserve currencies lose trust — slowly, then all at once.
The Irony
The loudest voices shouting “End the Fed” often claim they oppose money printing.
Ending the Fed would enable exactly that — not through a central bank, but through politicians with no operational firewall.
Right now:
Treasury must fund the TGA
Spending follows funding
The Fed only settles
Remove the Fed, and you don’t get freedom — you get political currency.
Final Thought
The Federal Reserve does not exist to protect bankers.
It exists to limit power — especially political power.
End that constraint, and the dollar’s payment system becomes a political instrument.
Laws
U.S. Constitution – Article I, Section 8: Congress may tax and borrow; it cannot print or spend by decree.
U.S. Constitution – Article I, Section 9: No money may be drawn from the Treasury without lawful appropriation.
Federal Reserve Act §14: The Fed may purchase Treasury securities only in the secondary market, not at issuance.
Federal Reserve Act §10B & §13(3): Fed lending must be collateralized; unsecured lending and funding Treasury are prohibited.
Treasury General Account (TGA) rules / post-1980s reforms: Treasury must spend from a positive TGA balance; no Fed overdrafts.
Markets don’t debate slogans.
They price consequences.
This is not POLITICAL! This is COUNTING!
#FAFO
If you enjoy the work:
👉 Drop a solid comment
Let’s push it to 6,000 and keep building a community grounded in raw truth, not hype.

RTY / IWM Weekly: Cup & Handle Projection to $3280A classic Cup and Handle formation has developed on the weekly chart of the [b ]Russell 2000 (RTY) ; this structure is also visible on the IWM ETF.
My target is based on the depth of the Cup, which projects a measured move to $3280 . This represents a potential 24% upside from current prices.
Not Financial Advice. For educational purposes only.

$ORCL: Basing Pattern and Trading OutlookCurrent Market Behavior
NYSE:ORCL is presently exhibiting an 18-day basing pattern, where its share price has been consolidating within a narrow range for nearly four weeks. This period of consolidation reflects a market equilibrium, as traders observe the stock for signals of a breakout or breakdown that may define the next trend. Such basing patterns are closely watched because they provide valuable information for identifying potential entry and exit points. A breakout above the consolidation range could indicate bullish momentum, while a breakdown might suggest a bearish scenario.
Potential Scenarios
• Breakout Potential: If NYSE:ORCL ’s price moves above the upper resistance of the base (as
highlighted on the chart), it may signal renewed buying interest and the potential start of
an upward trend.
• Breakdown Risk: A drop below the lower support of the base could point to the beginning
of a new downtrend, as selling pressure increases.
• Neutral Phase: During the basing period, price movements tend to be less volatile and
trading volume may decrease, reflecting a wait-and-see approach by market participants
who are looking for clearer direction.
Trading Plan
To capitalize on a potential upside move, an alert has been set at the upper boundary of the consolidation range. If this alert is triggered, the plan is to seek a favorable risk-reward entry, utilizing a tight stop loss to manage risk effectively.
Risk Disclaimer
Readers are strongly encouraged to perform their own analysis and adhere to their personal trading strategies. All investments entail inherent risks, so it is vital to make careful and informed decisions when allocating capital in financial markets.

$SNDK Wedging Pattern AnalysisOverview of Recent Price Action
Since breaking out in September, Sandisk ( NASDAQ:SNDK ) has experienced a significant upward move, gaining over 400%. The stock reached its recent high on November 12th and has since been consolidating those gains. Following the peak, SNDK retraced to test the 50-day moving average (DMA), shown in red, and has been oscillating around the 21-day exponential moving average (EMA), indicated in blue.
Technical Pattern: Volatility Contraction
The current price action has formed a wedging pattern that closely resembles the Volatility Contraction Pattern (VCP), a setup popularized by Mark Minervini. This is one of Minervini’s preferred patterns for trading, as it often precedes significant price movements when the pattern resolves.
Current Position and Trade Management
Today, a half-sized position was initiated in anticipation of a breakout above the downward-sloping trendline that defines the wedge. The 21 EMA will serve as a reference point for managing risk; a decisive close below this moving average will act as a trigger for the stop loss. If the stock breaks out of the wedge as anticipated, there will be an opportunity to add to the position.
Risk Management and Disclaimer
Readers are strongly encouraged to conduct their own analysis and adhere to their individual trading strategies. It is important to recognize that all investments carry inherent risk. Careful and informed decision-making is essential when allocating capital in financial markets.

$SOFI Volatility Contraction Pattern Analysis (VCP)Overview of SOFI's Recent Price Action
In late May and early June 2025, SOFI experienced a significant breakout. Following this breakout, the stock price surged approximately 137% to reach its all-time high. By September, SOFI had already gained around 120%, but this rapid ascent was accompanied by increased volatility, resulting in pronounced swings in price. These wide price movements continued until the stock achieved its 137% gain. Upon reaching its peak, volatility intensified further as the process of price discovery accelerated.
Volatility Contraction Phase
Starting in early December, the volatility began to contract, and this contraction has persisted since then. This pattern of decreasing volatility suggests a potential resolution point in the near future.
Trading Approach and Setup
Based on these observations, the hypothesis is that the volatility contraction pattern will resolve to the upside. In preparation for a possible breakout, an alert has been set on the upper downtrend line. If this alert is triggered, it will prompt a search for a favorable risk-reward entry. At present, SOFI remains on the watchlist as a B+ / A setup, indicating a potentially strong opportunity if market conditions confirm the hypothesis.
Important Considerations for Investors
It is strongly recommended that readers conduct their own analysis and follow their individual trading strategies. All investments carry inherent risks, and making thoughtful, informed decisions is essential when allocating capital in financial markets.

$QQQ Wedging Pattern AnalysisVolatility Contraction Pattern (VCP) Overview
The QQQ ETF is currently positioned in a noteworthy technical setup known as the Volatility Contraction Pattern (VCP), which has gained recognition through the work of Mark Minervini. The VCP is one of Minervini’s favored patterns for trading, characterized by a series of price contractions and tightening ranges that often precede a significant move.
Support and Resistance Levels
An important aspect of the current chart is the clearly defined area of support and resistance. These levels are visually represented on the chart, with the price having moved both above and below. Presently, the price action is “coiling” and “tightening,” which further supports the formation of the VCP.
Potential Breakout Direction
Although the VCP can result in a breakout in either direction, it typically resolves in alignment with the prevailing trend. In this case, the dominant trend has been upward, suggesting a higher probability of an upward breakout.
Trade Management and Risk Considerations
An alert has been placed on the upper downtrend line to monitor for a potential breakout. If the alert is triggered, it will be an opportunity to evaluate a favorable risk-reward entry point.
Risk Disclaimer
Readers are strongly encouraged to perform their own analysis and adhere to their personal trading strategies. All investments entail inherent risks, so it is vital to make careful and informed decisions when allocating capital in financial markets.

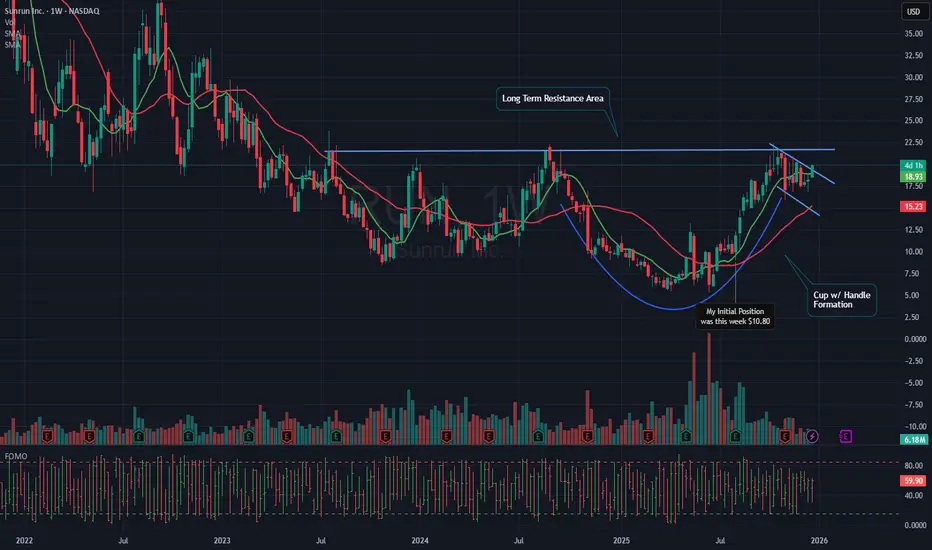
$RUN Cup w/ Handle Breakout AnalysisOverview
SUNRUN has experienced a notable upward movement today, gaining 8.89% as of this writing. This increase has propelled the stock above what appears to be a Cup with Handle formation, a technical pattern often associated with a bullish breakout. Given this development, the current price area could be a favorable point for initiating a new position. Typically, a breakout is confirmed when the price moves above a long-term resistance level.
Position Details
I established a full-size position in SUNRUN in early August at a price of $10.80 per share. Later, in November, I added a smaller amount at $17.95 per share, which increased my average cost to $11.68 per share. Currently, I am up 69% on this position. I did not add more shares today, as I missed the initial surge and prefer not to pursue the price higher. My plan is to wait for the stock to consolidate, even if that occurs at a higher price, since there is no clear area to set a reasonable stop loss for additional shares at this time.
Outlook and Watchlist Recommendation
I am sharing this update because I believe SUNRUN has the potential for further significant gains and should be considered for your watchlist. I will continue to update this analysis when a favorable risk-reward entry point becomes apparent.
Important Disclaimer
Readers are strongly encouraged to perform their own analysis and adhere to personal trading strategies. Keep in mind that all investments carry inherent risk. Making thoughtful and informed decisions is crucial when allocating capital in financial markets.
Santa Rally / V-Shaped Recovery WatchNASDAQ:QQQ continues to respect the 50 & 100 DMA, just like every selloff since July. Momentum indicators are exiting oversold territory, suggesting a familiar upside rotation.
AMEX:SPY confirms.
AMEX:IWM remains structurally bullish on the monthly (cup & handle).
CRYPTOCAP:BTC shows classic oversold mean reversion behavior.
Key risk: loss of 100 DMA.
Bias: upside continuation while support holds.

$QCOM Delayed News RallyOverview of the Qualcomm News Rally
On October 27th, Qualcomm Technologies, Inc. announced the launch of its next-generation AI inference-optimized solutions for data centers. These new products, the Qualcomm® AI200 and AI250 chip-based accelerator cards and racks, are built on the company’s NPU technology leadership. They deliver rack-scale performance and superior memory capacity, enabling fast AI inference with exceptional performance per dollar per watt. This marks a significant advancement for scalable, efficient, and flexible generative AI across various industries.
Market Reaction and Stock Performance
Following the announcement, trading volume on October 27th surged—possibly reaching the highest levels ever recorded for the stock. Qualcomm’s share price responded positively, gaining approximately 22% and ultimately closing up just over 11% for the day. However, after this initial rally, profit-taking led to a selloff, and the stock reached a closing low on November 20th.
Trading Strategy and Position Management
After observing the market reaction to the news, I chose not to pursue the upward price movement immediately. Instead, I patiently waited for a pullback, which turned out to be deeper than anticipated. Over the following weeks, I identified the downtrend and drew a trend line. When the stock price broke above this downtrend line, I entered a half-size position, setting a stop just below the day’s low. The stock climbed swiftly, then retreated to test the 50-day moving average (red), where it formed what I interpreted as a reversal candle yesterday. This morning, the reversal appeared confirmed, suggesting the potential for a continued uptrend. With this confirmation, I increased my holdings to a full-size position, placing a stop for the added shares just below today’s low.
Disclaimer and Investment Considerations
Readers are strongly encouraged to conduct their own analysis and follow their individual trading strategies. It is important to recognize that all investments involve inherent risk. Thoughtful and informed decision-making is essential when allocating capital in financial markets.

Santa Rally Setup: Why I Think Markets Rip Into 2026Santa Rally Setup: Why I Think Markets Rip Into 2026
Looking at NASDAQ:QQQ across 2H/D/W/M:
• 2H: breaking downtrend → measured move toward ~$640
• Daily: curling out of oversold + volume shelf suggests $621 magnet
• Weekly: divergence risk = key “line in the sand” (lose lows = pain train)
• Monthly: pullback still looks “normal” within broader uptrend
AMEX:IWM remains the most bullish: 4-year cup & handle breakout + retest behavior.
₿ CRYPTOCAP:BTC : oversold conditions, watching downside toward ~70k if weakness continues.
Not financial advice.
What are you watching: QQQ / SPY / IWM / BTC?

Post-Fed Breakdown: 25 bps Rate Cut + QE Restart = Risk-On Fuel Post-Fed Breakdown: 25 bps Rate Cut + QE Restart = Risk-On Fuel
The FOMC just delivered exactly what risk assets wanted:
25 bps rate cut
Restart of QE with $40B/month in Treasury purchases
This is the liquidity cocktail that historically lights up small caps, high beta, and speculative momentum stocks. The liquidity train is rolling again.
🔹 What This Means for Markets:
QE = immediate expansion of liquidity in the system
Lower rates = easier credit + higher equity multiples
Small caps ( AMEX:IWM ) historically outperform in the early QE phase
High beta + speculative names tend to catch the strongest flows
This is the exact macro environment where markets rip even if fundamentals are messy.
🔹 What I’m Watching:
1️⃣ AMEX:IWM – Small Caps
If we get a retest in AMEX:IWM , I’ll be looking to buy calls.
These QE environments are where the Russell 2000 becomes a rocket ship.
2️⃣ Momentum Leaders:
NASDAQ:WULF – Strong relative strength, liquidity-sensitive, crypto-adjacent.
NASDAQ:EOSE – A pure rate-sensitive, high beta energy storage play.
Both names should catch strong speculative flows if the market confirms.
3️⃣ The QE Effect:
When the Fed buys Treasurys, liquidity bleeds into every corner of the market.
Historically, QE ignites multi-week rallies in:
Small caps
High-beta tech
Energy storage
Crypto-adjacent equities
Meme/spec cycles
🔹 My Game Plan:
Wait for clean setups — don’t chase the first candle.
Look for IWM dips, not spikes.
Keep NASDAQ:WULF and NASDAQ:EOSE on top of the momentum list.
Align trades with liquidity — don’t fade QE.
The liquidity faucet is turning back on. This is where swing traders make their year.

An Urgent Warning to ALL Traders & InvestorsWhat in the world just happened to the market today? NASDAQ:QQQ AMEX:SPY AMEX:IWM
That’s exactly what we’re breaking down—calmly, logically, and from an investor’s perspective.
In this video, I walk through the major indexes ( NASDAQ:QQQ , AMEX:SPY , and AMEX:IWM ) across multiple timeframes to explain the pullback, what *could* be driving it (macro fears, rates, inflation/GDP concerns), and the two paths the market may take next.
We also cover the VIX spike (but still at relatively low levels), COR3M/market stress, and what I’m seeing in crypto (BTC and ETH) as part of the broader “risk-on/risk-off” puzzle.
The key takeaway: this is a choppy “kangaroo market.” I lay out the bullish bounce scenario vs. the bear structure scenario, and the specific levels that would confirm either direction—so you can stay prepared, not emotional.
Not Financial Advice - DYOR

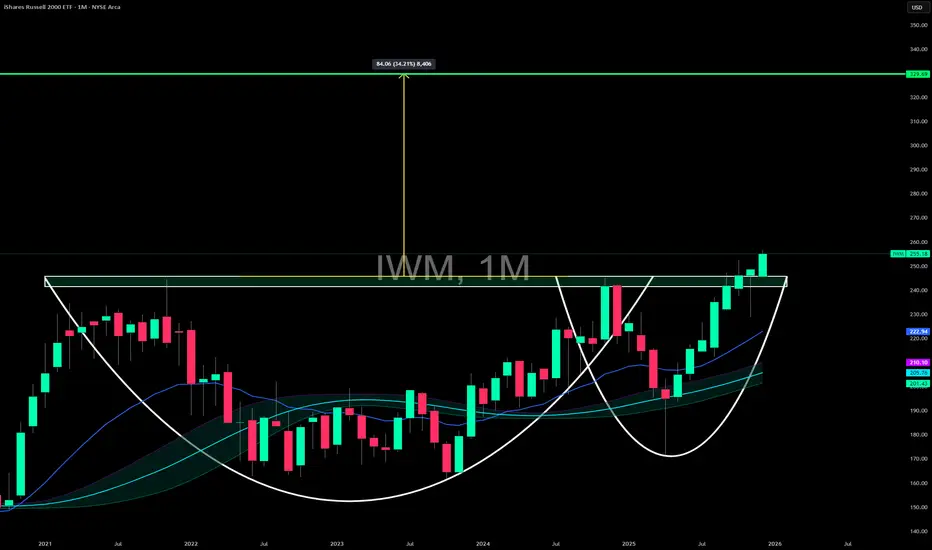
MASSIVE move inbound...🚨 AMEX:IWM is coiling for a MASSIVE move.
We’re breaking out of a 4-year Cup & Handle on the monthly chart—one of the most powerful continuation patterns you can get.
📈 Measured move? ~$330.
Yes… $330.
This checks every box:
• 4 years of underperformance vs. AMEX:SPY and NASDAQ:QQQ
• Small–mid caps are among the most undervalued in the entire market
• Rate cuts are rocket fuel for risk-on segments like AMEX:IWM
• Broad participation = healthier market = Russell strength
This is the breakout I’ve been waiting on.
🔥 Small caps might finally be waking up.
Buckle up.
Analysis of USA Rare Earth $USAR Investment PotentialOverview of Government Investment in Strategic Minerals
USA Rare Earth ( NASDAQ:USAR ) has emerged as a potential candidate for government investment, following in the footsteps of other strategically significant companies. For instance, the Department of Defense (DoD) acquired a 15% stake in MP Materials for $400 million in July 2025, becoming the company's largest shareholder. Additionally, the administration has taken equity positions in Lithium Americas and Trilogy Metals. These actions are part of a broader initiative aimed at securing domestic supply chains for critical minerals.
Current Status and Prospects of USAR
At present, USA Rare Earth is considered a speculative investment due to its lack of profitability. Nevertheless, the company's future prospects appear favorable as it continues to develop rare earth mines and processing facilities. The strategic importance of these resources adds to the potential upside of the company.
Technical Analysis and Trading Strategy
A positive chart pattern has been identified for USAR, characterized by a rounded bottom, a recent pocket pivot, and a flat base formation. As of today, the stock is retracing toward its 21 Day Exponential Moving Average (EMA), indicated in blue on the chart. Ideally, further consolidation around this level would allow the stock to form a clear higher low. Should NASDAQ:USAR achieve this and resume its upward trend, initiating a starter position is planned. If the stock subsequently breaks above the established resistance area, the intention is to build out the position further.
Risk Considerations and Recommendations
Readers are strongly encouraged to conduct their own analysis and to adhere to their individual trading strategies. It is important to recognize that all investments carry inherent risk. Careful and informed decision-making is essential when allocating capital in financial markets.

$SHOP: Higher Low and Flat Base Set-UpOverview of Recent Price Action
SHOP recently experienced a pullback of approximately 25% from its all-time high (ATH). Such retracements are a typical pattern for stocks that have been in a sustained long-term uptrend. The recent dip allowed the stock to reset its base, which means that any subsequent upward movement could mark the beginning of a new stage two uptrend.
Technical Strength and Higher Low Formation
Notably, SHOP has established a higher low, indicating that the stock may be regaining strength. This technical development suggests a potential shift in momentum, which could attract additional buying interest as the stock stabilizes and positions itself for a possible breakout.
Position Entry and Current Set-Up
A half-sized position was initiated yesterday as SHOP reclaimed the 21-day Exponential Moving Average (EMA). An additional allocation was made today after the stock surpassed the 50-day Moving Average (DMA). Currently, SHOP is trading just below a flat base, with the anticipation that it may soon break out above this level.
Potential Price Target
While specific price targets are not typically set, it is reasonable to expect that the stock could attempt to challenge its previous all-time high. If SHOP achieves this, it would represent a gain of about 12% from the breakout point.
Risk Disclaimer
Readers are strongly encouraged to conduct their own analysis and adhere to their personal trading strategies. It is crucial to understand that all investments carry inherent risks. Making informed decisions is essential when allocating capital within the financial markets.

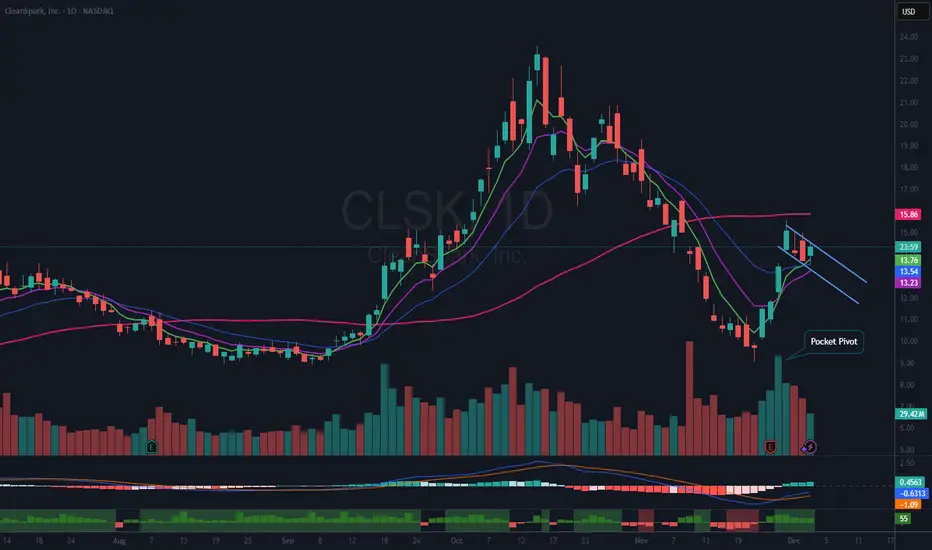
CleanSpark $CLSK Bull Flag Pattern and Earnings AnalysisOverview of Recent Earnings
On Tuesday, November 25, 2025, at 4:02 PM ET, CleanSpark, Inc. (CLSK), a Nevada-based energy technology and clean Bitcoin mining company, reported its financial results for the fiscal fourth quarter ended September 2025. The company posted a loss of $0.01 per share on revenue of $223.65 million. This result fell short of the consensus earnings estimate of $0.04 per share on revenue of $238.76 million, missing consensus by 125.00%. Despite the earnings miss, revenue demonstrated significant year-over-year growth, increasing by 150.52%.
Market Reaction and Technical Analysis
Following the earnings report, investors responded positively to CleanSpark’s revenue growth, as evidenced by a stock price increase of over 30%. The price movement on the chart indicates that market participants appreciated the strong top-line performance, even though the company missed earnings expectations.
Currently, the chart displays an orderly pullback on decreasing volume, forming a classic bull flag pattern. This technical setup suggests a period of consolidation after the recent sharp upward move, with the potential for another breakout should positive momentum continue. Notably, the stock has touched and bounced off the 21-day Exponential Moving Average (EMA), which is represented by the blue line on the chart.
Trading Strategy and Risk Management
An alert has been set on the upper downtrend line of the bull flag formation. If this alert is triggered, it will serve as a signal to initiate a position in the stock. To manage risk, a stop will be placed just below the most recent low, which provides an attractive risk-reward ratio for the trade.
In summary, while CleanSpark missed its earnings estimate, the substantial revenue growth and positive market reaction, combined with a constructive chart pattern, present a favorable technical and fundamental outlook for the stock.
Risk Disclaimer
Readers are strongly encouraged to conduct their own analysis and adhere to their personal trading strategies. It is crucial to understand that all investments carry inherent risks. Making informed decisions is essential when allocating capital within the financial markets.
IWM - Buy The Rumor Sell The News?Today the IWM saw massive bullish flow, almost piercing the all time high double top.
Many high beta stocks absolutely ripped higher today on huge rate cut expectations.
There a strong chance they may keep small caps strong into the rate cut, which could set up a buy the rumor sell the news.
The rate cut is next week December 10th and it sure has fueled this rally.
we have been trimming some of our long positions into this strength and still have long exposure in key names.
Today we closed
AMEX:UMAC NASDAQ:DPRO FOR 15 - 17% GAINS
NYSE:SLB CALLS 45% GAIN
NYSE:ACN CALLS 102% GAIN
