GME: Buy on H1bull div
macd kiss forming
accumulation feather
I don't think there will be a short squeeze, but the stock seems to be undervalued.
Keylevel

Probable Longs For XAU Can look for a Bullish formation coz we are bearish for a time now and we have a falling wedge pattern so could look for a long position and if it does the our key level can be the target if not we break the support then we can continue bearish towards our lower key level...
Any ways this is just my thought of the market for next week...

Staley Key Level SR SetupKey chart levels are important technical levels at which a financial instrument could face increased buying or selling pressure. Traders look out for key chart levels to place their buy and sell orders around those lines, which accelerates price-moves and increases volatility when the price reaches those levels. When looking to sell a currency pair, traders can look for the short or faster moving average to cross below a falling slower moving average as a sell signal. The most well-known moving average crossovers involve the 50 (51) and 200 moving averages. Support occurs when falling prices stop, change direction, and begin to rise. ... Resistance is a price level where rising prices stop, change direction, and begin to fall. Resistance is often viewed as a “ceiling” keeping prices from rising higher. When you combine these powerful tools with patience and good technical analysis you have a solid setup. This set up is made to be clean and beginner friendly. Please give it a try, and put your own spin on it.

LONG EUR/USD.LONG EUR/USD, ***IF there is a clear rejection around the current level, wich is on the 1,19500 monthly key level (psychological level), it is also on the 50% level of the fibonacci taken on the monthly and it is on the -27,20% level of the fibonacci taken on the daily. IMPORTANT : I am only showing an analysis on one of the many timeframes that I use.

SHORT GBP/JPY.SHORT GBP/JPY, ***IF there is a clear rejection around the current area, wich is on the 150,500 monthly key level (psychological level) and it is also on a daily key level. The market is over extended and is showing signs of a divergence (pink lines on the RSI and on the chart). IMPORTANT : I am only showing an analysis on one of the many timeframes that I use.


NZD/USD good long setupnzd usd broke the very strong resistance level and market is back at that broken structure to retest the broken zone
look for the long confirmations on lower time frames and enter long with your own money management
discipline with patience always pays
patience is the key


CAD/JPY Potential Take Off To 85.07 Mark 🚀🚀🚀💡 Trade Idea
📈 CAD/JPY | Buy Order @ 84.26
🎯 Target Profit 85.07
🛑 Stop Loss 83.87
❌ Do not risk more than 1 % of your account on each trade
🙂 Good Luck !
Description:
The price is posted a correction count after rallying yesterday. This selloff stalled near the daily support where we have the 50% Fibonacci retracement level. the confluence zone might lead to a move upward to the 85.07 mark.
-------------------------------------------------------------------------------------
Please press “Like” if you appreciate the trading idea 👍
“Follow” for more trading ideas in the future 👀
“Comment” below to share your thoughts with us and other traders 👥
-------------------------------------------------------------------------------------
Risk Disclaimer: All trading ideas published by “collegeofpips” are for educational purposes only. These posts can help you to enhance your trading skills, but please do your own research before opening any trading position. ⚠️

GBP/CAD - Price residing in interesting spotPrice cycled downwards, currently residing at a key level in price and a trendline test. Lets see how this 4HR closes.
Simple structure on the HTF. Identify trend and key levels.

XMRUSD Scalping tradeHello Traders!
This is a sell trade for XMRUSDT
Entry 200
Stop-loss 209 (4.6% loss)
Target 180 (10% gain)
Don't forget to hit the like button

ADAUSDT Scalping tradeHello Traders!
This is scalping Trade fro ADAUSDT
Entry 1.0300
Target 0.9430 8.3% Gain
Stop-loss: 1.0800 4.88% Risk

Audusud Only buysThis pair is not done. The banking institutions are showing their prints that they are not done distributing this pair. This is an hpt based on the monthky bias. We should get this mive by the end of the month

BNBUSDT Scalpers key levelHello Traders!
This is the key level for scalpers for BNBUSDT.
Scalp with care. Find a pattern or strong candlestick pattern to enter the trade near these key levels.
Only Enter when you find a clear Pattern.
Levels are derived from some secret methods.
If you are scalping with the care then you will not lose any Trade.
Good luck traders.
Support the idea with likes. :)

ADAUSDT: Scalpers key levelHello Traders!
This is the key level for scalpers for ADAUSDT.
Scalp with care. Find a pattern or strong candlestick pattern to enter the trade near these key levels.
Only Enter when you find a clear Pattern.
Levels are derived from some secret methods.
If you are scalping with the care then you will not lose any Trade.
Good luck traders.

LONG EUR/GBP.LONG EUR/GBP, ***IF there is a clear rejection around the current level, wich is around a monthly key level. Also, the market is over extended (seen on the RSI), wich indicates a possible retracement. IMPORTANT : I am only showing an analysis on one of the many timeframes that I use.

VETUSDT Scalpers Key LevelsHello Traders!
This is the key level for scalpers for VETUSDT.
Scalp with care. Find a pattern or strong candlestick pattern to enter this trade near these key levels.
Only Enter when you find a clear Pattern.
Levels are derived from some secret methods.
If you are scalping with the care then you will not lose any Trade.
Good luck traders.

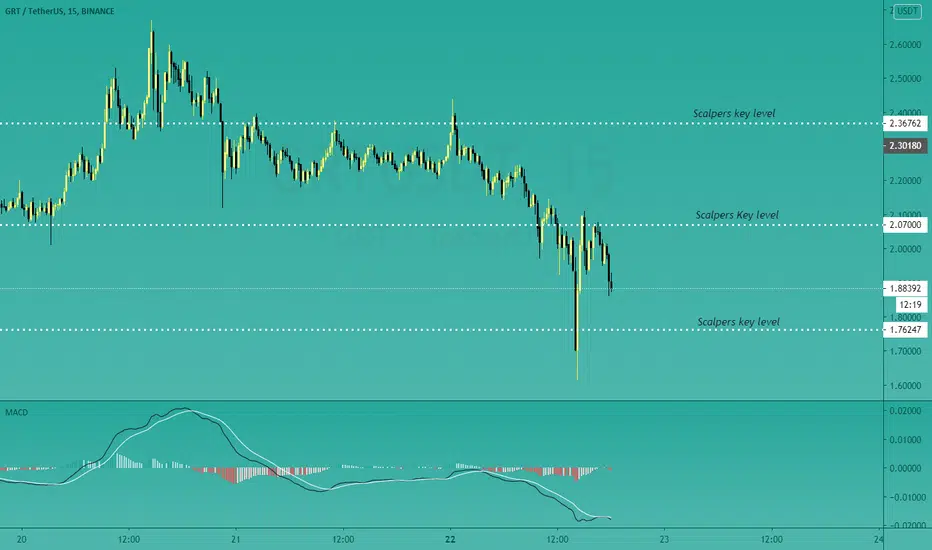
GRTUSDT: Scalpers key levels Hello Traders!
This is the key level for scalpers for GRTUSDT.
Scalp with care. Find a pattern or strong candlestick pattern to enter this trade near these key levels.
Levels are derived from some secret methods.
If you are scalping with the care then you will not lose any Trade.
Good luck traders.
USDCHFWaiting for the 4H to close above marked key level once it's done there is a higher probability that price can go up.

Break and Retest To The Downtrend Price has continued to push down on the higher time frames. Now price has broken below a daily and weekly key level a it is showing signs of retest of that key level. Most likely if it retest at that level it will continue going down.

GBPUSD BuyAfter breaking the consolidation, price is in a clear uptrend making Higher Highs and Low. I will be only looking for buys up to the weekly key level.

GBP/JPY - Simple Daily StructureWhy have we been looking for long positions on GJ for the past few weeks and months you ask?
Well, on the daily chart we can clearly see we have resided in an Ascending channel for some time now. However, we have now rallied up to the top of our ascending channel with a third touch.
You can see some key levels marked in on the right hand side. These are key levels on the lower time frames that we have been using to take long setups on the pair.
Where will price head next? We are right at the top of the range for this pair.
See our related idea for some long positions on this pair!

ETHUSD - Key LevelEthereum is at the key level of resistance, would you like to engage in a shorting opportunity?
RSI is at Overbought position which gives a good consideration, the conservative trader can wait for a candle confirmation before engaging the trade.
