Bulls fight back but bearish signals lingerRecent mixed price and momentum signals on the S&P 500 suggest traders should keep an open mind on whether to play the index from the long or short side in the near term.
For the bulls, the strong bounce from a zone comprising the 50-day moving average and May 23 uptrend over the past two sessions suggests the buy-the-dip trade remains alive despite Friday’s sharp pullback, pointing to the potential for an eventual retest of the record high at 6766.
However, bearish divergence with RSI (14) raises questions about the sustainability of the move, especially with MACD having already crossed the signal line from above before proceeding to trend lower. Bullish momentum is weakening, not building, likely keeping bears interested for the moment.
For those looking to play the index from the long side, there are few setups worth considering. If we were to see a break above 6700 resistance, longs could be established above the level with a stop below, targeting the record high of 6766 initially. Alternatively, another pullback and bounce from the 50DMA/May uptrend support zone would provide a decent entry level, allowing for longs to be set with a stop below for risk management purposes. Potential targets include Tuesday’s high, 6700 or 6766.
For the bears, a failure to clear 6700 resistance would create a short setup, allowing for trades to be established beneath the level with a stop above for protection. The 50DMA/May uptrend support zone screens as a logical initial target, with 6500 and 6360 other options after that.
Good luck!
DS
M-oscillator

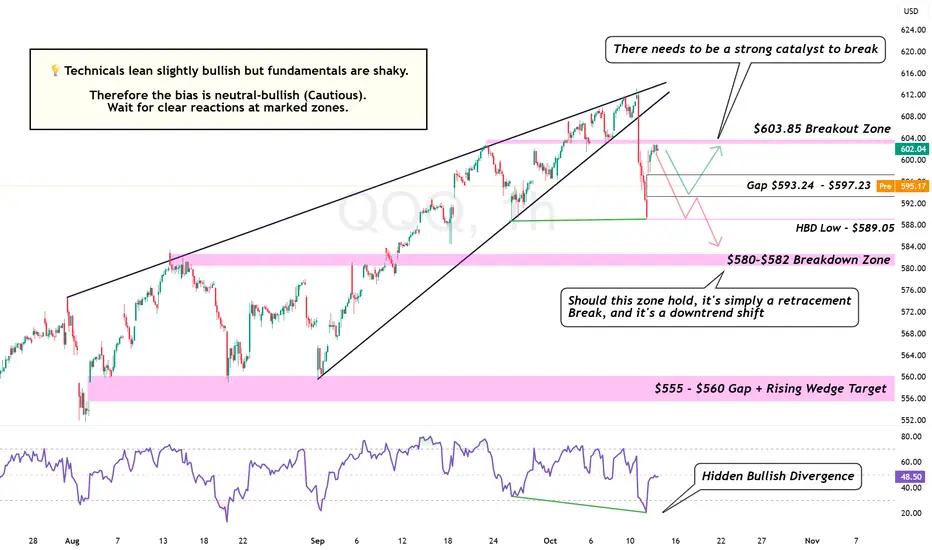
QQQ: Bull Trap or Bounce Time? The $593 Line in the SandQQQ is gapping down right into a massive technical test: the $593 Gap Support.
This is not a regular drop. Our chart is showing a rare conflict:
Bullish Setup: A Hidden Bullish Divergence (HBD) is screaming for a bounce.
Bearish Risk: A loss of the low could trigger a rapid descent to the $580 Zone.
The bias right now is neutral-bullish — cautious optimism.
If bulls hold the gap, expect a short-term rebound toward $603–$605 where sellers will likely re-emerge.
But if $593 gives way, this turns into a full-on correction targeting $582 → $560, completing the wedge breakdown target.
This is the moment of truth.
Bulls need to defend $593 or risk a complete sentiment shift.
Key Levels:
$603.85 — Breakout Zone
$593.24–$597.23 — Gap Support
$589.05 — Structural Floor
$580–$582 — Breakdown Zone
$555–$560 — Rising Wedge Target
Bias: 🟡 Neutral-Bullish (Cautious)
Timeframe: 1H
Indicators: RSI Hidden Bullish Divergence, Rising Wedge Breakdown
BTC Bearish DivergenceBitcoin Showing Major Cracks — Divergences Are Screaming
My Weekly Polynomial Average (113,700) has just been broken — a key structural shift.
Next leg down towards the major Fibonacci extension (1.618) points toward a $76,900 target.
Bitcoin’s bearish divergence has been running far too long — and history shows this kind of setup never ends quietly.
RSI divergence: nearly 19 months
MACD divergence: close to 10 months
That’s a massive disconnect between price momentum and underlying strength. The market’s been grinding higher on fumes while the internals have been rolling over for more than a year.
We’ve seen this before. In 2007, the S&P 500 ran an extended divergence for almost a year — price kept pushing higher while internals weakened. The result? The global financial crisis that followed soon after.
Now, Bitcoin looks eerily similar — cracks forming beneath the surface while sentiment remains euphoric. When these long divergences finally resolve, the unwind tends to be fast and ugly.
Caution here isn’t bearishness — it’s survival instinct.

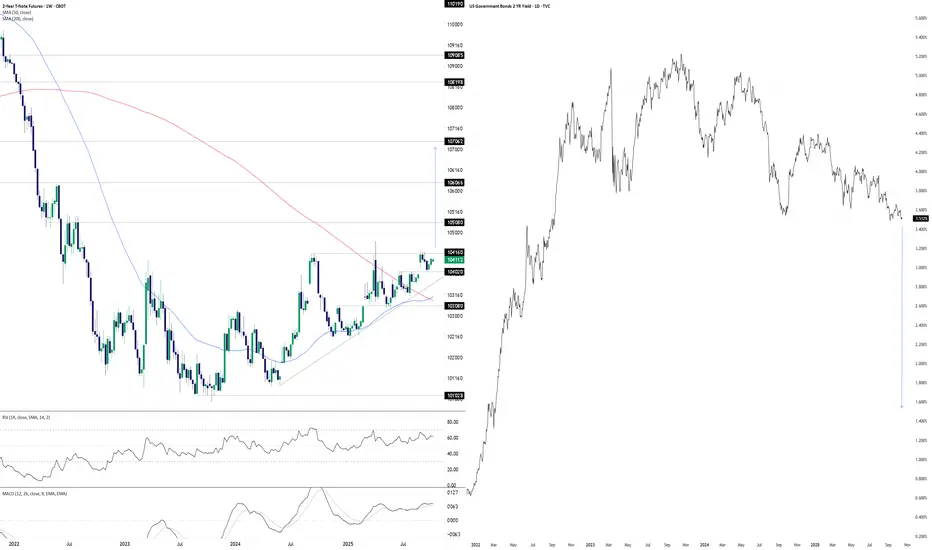
Something’s Brewing at the Front EndDonald Trump wants lower interest rates. He may well get his wish soon, at least at the front of the U.S. Treasury curve. The chart you’re looking at has two panes. On the left, we have U.S. two-year Treasury futures. On the right, we have two-year U.S. Treasury yields. The former uses a weekly tick, the latter daily.
With futures coiling in a well-defined ascending triangle pattern for more than a year, you get the sense that should we see a weekly close above 104’16’0, it may act as a catalyst to spark further upside, potentially explosive. The contract has been rejected at the level six separate times since July 2024, including four failed breakout attempts over the same period. This reinforces its importance. Given its proximity to the level with RSI (14) and MACD generating bullish momentum signals, attempt number seven—if we see it—stands a decent chance of sticking.
If we see a sustained break above 104’16’0, 105’08’0, 106’06’6 and 107’06’2 loom as the levels to watch, especially the latter as it aligns with the extension target based on the triangle’s height. If it were to be achieved, it points to a nominal two-year Treasury yield of around 1.5%.
That’s obviously far lower than where it currently resides, pointing to negative real rates given the Fed’s 2% inflation target and, in all likelihood, economic conditions far weaker than recent years or monetary policy being guided by factors other than fundamentals.
While the setup is tradable, if it plays out, it will have ramifications far beyond rate futures given the economic signal it would provide. When you look at recent moves in hard assets with perceived scarcity value, it appears many investors and traders are already positioning for such an environment.
Good luck,
DS
How to Trade with Stochastics in TradingViewMaster Stochastics using TradingView’s charting tools in this comprehensive tutorial from Optimus Futures.
The Stochastic Oscillator is a momentum indicator that helps traders identify potential turning points in the market by comparing the current closing price to the recent high–low range. It’s designed to show when momentum may be shifting from buyers to sellers — or vice versa.
What You’ll Learn:
- Understanding the Stochastic Oscillator as a momentum tool plotted from 0 to 100
- How the %K line represents the current close relative to the recent high–low range
- How the %D line acts as a moving average of %K and serves as a signal line
- Key thresholds: readings above 80 suggest overbought conditions, while below 20 suggest oversold conditions
- Why overbought and oversold levels are not automatic buy or sell signals — and how strong trends can keep Stochastics extended
- Identifying bullish and bearish crossovers between %K and %D
- Spotting bullish and bearish divergence between price and momentum
- Using Stochastics to confirm trend direction across different timeframes
- How to add Stochastics on TradingView via the Indicators menu
- Understanding the default settings (14, 3, 3) and how adjusting them affects responsiveness
- Practical examples on the E-mini S&P 500 futures chart
- Applying Stochastics across multiple timeframes — daily, weekly, or intraday — for confirmation signals
This tutorial will benefit futures traders, swing traders, and technical analysts who want to incorporate Stochastics into their trading process.
The concepts covered may help you identify momentum shifts, potential reversal zones, and trend confirmations across different markets and timeframes.
Learn more about futures trading with TradingView:
optimusfutures.com
Disclaimer
There is a substantial risk of loss in futures trading. Past performance is not indicative of future results. Please trade only with risk capital. We are not responsible for any third-party links, comments, or content shared on TradingView. Any opinions, links, or messages posted by users on TradingView do not represent our views or recommendations. Please exercise your own judgment and due diligence when engaging with any external content or user commentary.
This video represents the opinion of Optimus Futures and is intended for educational purposes only.
Chart interpretations are presented solely to illustrate objective technical concepts and should not be viewed as predictive of future market behavior. In our opinion, charts are analytical tools — not forecasting instruments.

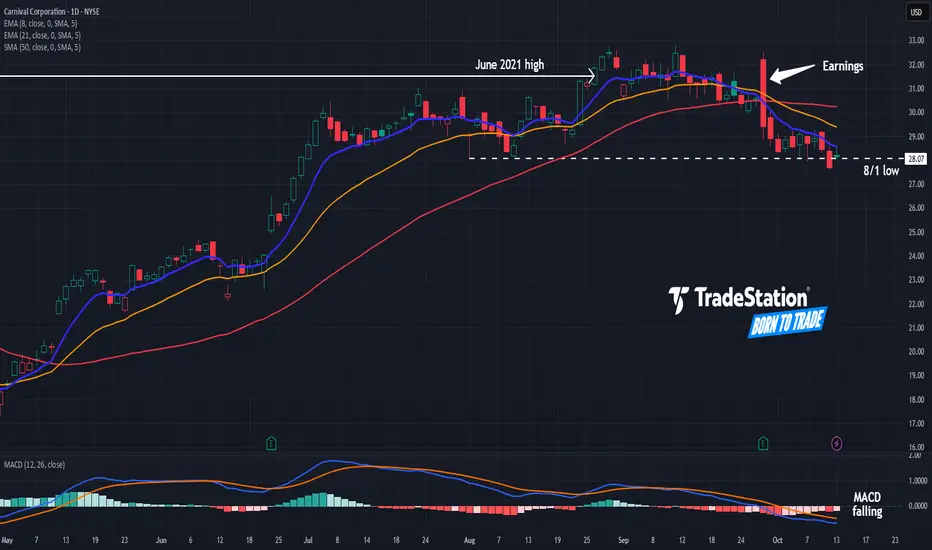
Carnival May Be SinkingCarnival sailed higher in the spring, but some traders may think the cruise-ship operator is sinking.
The first pattern on today’s chart is the large bearish engulfing candle on September 29 after results and guidance surprised to the upside. Such a rejection of positive news may suggest investors were less optimistic about its fundamentals.
Second, prices ended that session below the 50-day simple moving average. They have remained there since, which may reflect a weaker intermediate-term trend.
Third, CCL stalled near its June 2021 high. Was long-term resistance confirmed?
Next, the stock bounced near $28 in August. It remained above that level in early October, only to break support on Friday.
Finally, the 8-day exponential moving average (EMA) is below the 21-day EMA. MACD is also falling. Those signals may be consistent with short-term bearishness.
TradeStation has, for decades, advanced the trading industry, providing access to stocks, options and futures. If you're born to trade, we could be for you. See our Overview for more.
Past performance, whether actual or indicated by historical tests of strategies, is no guarantee of future performance or success. There is a possibility that you may sustain a loss equal to or greater than your entire investment regardless of which asset class you trade (equities, options or futures); therefore, you should not invest or risk money that you cannot afford to lose. Online trading is not suitable for all investors. View the document titled Characteristics and Risks of Standardized Options at www.TradeStation.com . Before trading any asset class, customers must read the relevant risk disclosure statements on www.TradeStation.com . System access and trade placement and execution may be delayed or fail due to market volatility and volume, quote delays, system and software errors, Internet traffic, outages and other factors.
Securities and futures trading is offered to self-directed customers by TradeStation Securities, Inc., a broker-dealer registered with the Securities and Exchange Commission and a futures commission merchant licensed with the Commodity Futures Trading Commission). TradeStation Securities is a member of the Financial Industry Regulatory Authority, the National Futures Association, and a number of exchanges.
TradeStation Securities, Inc. and TradeStation Technologies, Inc. are each wholly owned subsidiaries of TradeStation Group, Inc., both operating, and providing products and services, under the TradeStation brand and trademark. When applying for, or purchasing, accounts, subscriptions, products and services, it is important that you know which company you will be dealing with. Visit www.TradeStation.com for further important information explaining what this means.
NG: Head shoulders on natural gasHello, dear traders!
What we have: head and shoulders on H4, divergence on H4, shooting star on the weekly timeframe.
Target - the nearest support level.

Start of Altseason and Ethereum's RiseHello friends 👋
I've posted my Ethereum analysis for you ✍️. Given the oversold zone on the RSI 📉 and Ethereum's past history 📜, I predict we will see a significant surge in the next two months 🚀—around 130% 💹, reaching a price of $8,000 USDT for Ethereum 💎.
Furthermore, the altcoin season is also expected to happen during this period 🌕.
I hope you'll also share your own thoughts about the market in the comments section 💬.
📢 Important Note: This is solely an analysis/prediction, and the responsibility for any trading or investment decisions is entirely your own! ⚠️

Is the Bitcoin market bearish?📊 Bitcoin Market Psychology Analysis
Market psychology analysis is one of the most fascinating and practical approaches to understanding Bitcoin's current position! 🎯
🎭 Market Psychology Cycle Phases:
1. Hope Phase 🟦
Likely the current point for many assets
· 📈 Description: After a panic-driven crash, the market stabilizes and consolidates within a relatively stable range
· 💰 Price hasn't returned to previous lows and shows occasional small positive breakouts
· 😌 Sentiment: Fatigue from the downturn, but quiet hope for gradual improvement
· 👴 Experienced investors accumulate while newcomers remain cautious
· 📊 Indicator: Moderate trading volume typically
2. Optimism & Belief Phase 🟩
· 🚀 Description: Price begins breaking key resistance levels
· 📰 Media gradually starts paying attention again
· 😨 Sentiment: FOMO (Fear Of Missing Out) among experienced investors
· 😞 Regret over selling at the bottom
· 📈 Indicator: Beginning of increasing trading volume
3. Greed & Euphoria Phase 🟨
· 📈 Description: Full-blown bullish phase - price rises consistently and rapidly
· 🗞️ Positive news dominates everywhere
· 👥 Friends and acquaintances talk about massive profits
· 💭 Sentiment: Belief that "this time it's different" and "price only goes up"
· 💸 Greed for more profits and borrowing to buy
· 📊 Indicator: Very high trading volume and positive media coverage
4. Denial Phase 🟧 - Danger Point!
· 📉 Description: Price falls from the peak
· 🤦 Many investors consider this just a "temporary correction"
· 🔮 Expect a return to the peak
· ❌ Sentiment: Strong denial
· 🛒 Buying during the decline hoping for recovery
· 📊 Indicator: Trading volume remains high
5. Fear, Panic & Capitulation Phase 🟥
· 🚨 Description: Sharp and rapid decline
· 📉 Price experiences consecutive breakdowns
· 😱 Sentiment: Intense fear, panic selling
· 💔 Acceptance of heavy losses - absolute despair
· 📊 Indicator: Very high selling volume
6. Apathy & Depression Phase ⬜
· 😴 Description: Market remains stagnant with low volatility for extended periods
· 💤 Prices are low and boring
· 🚫 Sentiment: Complete disinterest in the market
· 👋 Most people have accepted defeat and exited the market
· ☠️ Talk of "Bitcoin's death" resurfaces
· 📊 Indicator: Very low trading volume and minimal media attention
---
💡 Golden Insight:
Understanding these phases can help you make the best trading decisions! ✨
---
📌 Market Psychology + Technical Analysis = Trading Success 🚀
---
💬 Let's Interact!
I'd love to hear your thoughts! 👇
· 🤔 Which phase do you think we're currently in?
· 📊 What's your market outlook for the coming months?
· 💭 Share your technical analysis perspective
· 🎯 Have you used market psychology in your trading strategy?
· 📉 What indicators do you find most reliable?
· 💡 Any successful trades based on market sentiment?
· 🔮 Where do you see Bitcoin in the next 6 months?
Let's learn from each other! Share your comments and analysis below 👇
Your experience and insights are valuable - let's build our trading knowledge together! 🌟
Feel free to ask any questions or share your trading experiences! 💪

3 Things: Fear, Bitcoin, And The Doji Candlestick PatternIt was in the night i was taking a walk and then
i heard a viper. It hissed at me.
It grabbed a frog with one swift.It bothered me
because i am usually used to hearing them vipers.
But this time i was scared.I always
use auto suggestion. From the bible
it says "You shall trample the great lion and the snake"
Fear is real, but confidence is not acting
in the absence of fear its acting in the presence of it.
People will mistreat you so that
you have fear this is the fear that stops
action.
If you can act in the presence of fear
who knows what you will find
at the end of that action
Look at the RSI below its showing you
very good strength on the bitcoin price action
Bitcoin has found its support.This means
people holding bitcoin are not willing to sell anymore
at this price..This is your entry right now.
Remember do not use margin
just buy the actual bitcoin
and stuff it in your hardware
wallet
You can see the fear by the Doji candlestick
pattern.
Remember these 3 things:
Doji - which means indecision or doubt or fear
RSI - which means price strength
Support price - which means buyers are not willing to sell
Be prepared for the next Bitcoin bull market by
December of this year.
Rocket boost this content to learn more
Disclaimer:Trading is risky please risk management
and profit taking strategies.
Also feel free to use a simulation trading account
Before you trade with real money.Do not use margin.
More slowly.Another chart about how it's pointless to look at a situation using 4 H, 1 D, or even 1 W.
What are you guys talking about?
When will this monthly divergence finally materialize?
Wait, wait and wait.

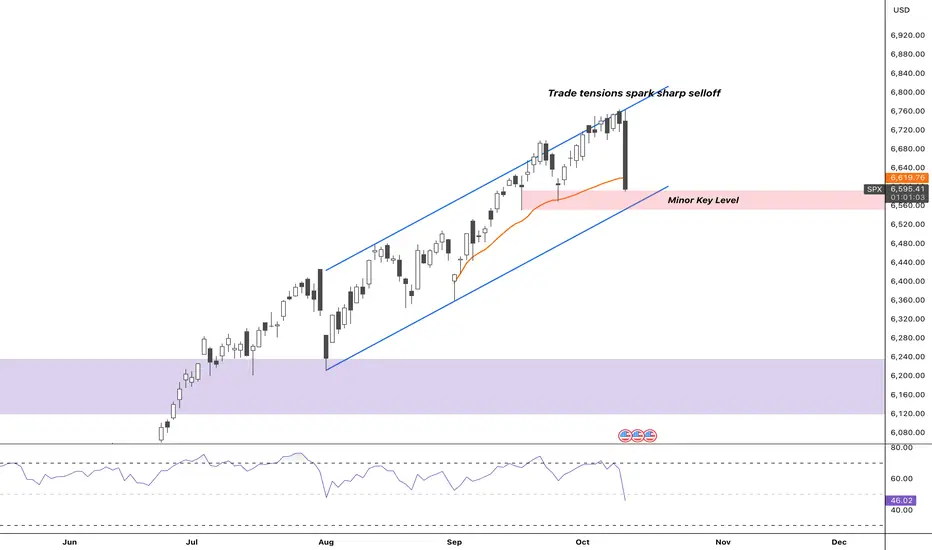
SPX Pulls Back Hard — Testing Channel Support After Trade ShockPost:
SPX saw a sharp reversal after Trump’s renewed tariff threats on China, sparking a broad risk-off move. The index broke sharply from the upper channel, tagging the 21-day EMA and now sitting right on a minor key level within the ascending channel.
Momentum clearly flipped short-term, but the question now is whether there’s enough downside energy to break through both this key level and the channel’s lower boundary — a move that would shift structure from controlled pullback to confirmed trend break.
Key Levels:
• 6,535–6,550: Minor key level + channel support
• 6,750–6,780: Prior rejection zone
• 6,200: Major support if channel breaks
Focus: Watch for confirmation — either buyers step in at channel support, or momentum extends into a deeper structural break.
KR price is showing signs of strength; now it just needs volumeKroger (KR) has moved into an uptrend on the daily chart, forming a higher trough followed by a higher peak. Upside momentum is improving, confirmed by a break of the downsloping trendline, while the RSI has risen above 50 — a positive sign for near-term strength.
The longer RSI holds above 50, the greater the likelihood of continued price appreciation. One area that appears lacking, however, is volume, with the OBV not yet showing a corresponding pickup in accumulation.
Nevertheless, the EMAs are aligned in a bullish formation, and if they begin to develop angle and separation alongside a firm RSI, KR’s price is likely to show further underlying strength.

Bearish Divergence Builds in U.S. Small CapsThe U.S. small-cap contract has struggled above 2492 recently, delivering multiple failed bullish breakouts from the high established on September 23. With bearish divergence between price and RSI (14) evident, the longer this iffy price action persists, the more it may encourage bears to seek out a larger downside flush.
Should we see another failed breakout attempt above 2492, shorts could be established beneath the level with a stop above the recent highs to protect against reversal. 2450 is the first downside level of note, albeit a minor one. For shorter-term types, it’s a potential target, although uptrend support running from September 2 screens as a more important level should we see a pullback. If the price were to crack that level convincingly, it may spark a faster unwind towards the 50-day moving average, which the contract bounced strongly from the last two times it was tested. Both levels provide targets for longer-term traders.
As a reminder, the underlying Russell 2000 index remains very much a play on the U.S. interest rate outlook and, consequently, broader domestic economic conditions. With nearly four rate cuts priced by the Fed’s September meeting next year, it’s provided meaningful tailwinds for non-profitable, capital-reliant firms without sparking any real concern about a looming U.S. recession.
However, with few signs the government shutdown will end anytime soon, coupled with prominent headlines surrounding private debt markets and iffy price action in other riskier asset classes, it’s not difficult to see potential macro landmines. Tailwinds from any increase in rate cuts would likely be overridden quickly if driven by concerns about increased volatility stemming from another economic downturn.
For small-cap bulls, there is such a thing as too much of a good thing when it comes to the magnitude and speed of rate cuts. Be careful what you wish for.

Silver MonthlyTarget for the next several months is ~20 usd
The sooner we hit it, the sooner we can start another bullish leg.
Short Term Targets are bullish ~23 usd
Anything can happen in this market, as JPM, Deutsche, USB, HSBC have all been fined for spoofing or manipulating the silver market in the past 3-4 years.

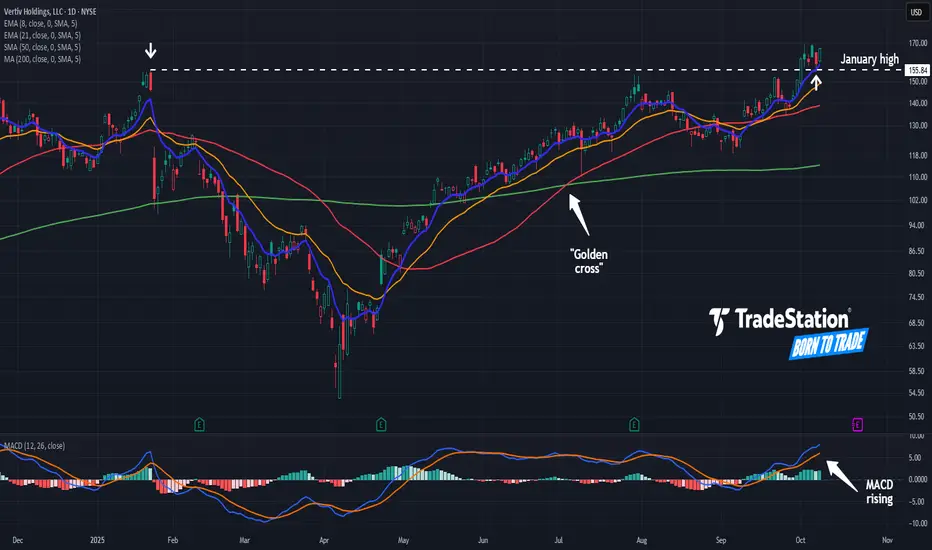
Vertiv May Have Broken OutVertiv was an early leader in the AI rally, and now it may be breaking out again.
The first pattern on today’s chart is the January high of $155.84. The provider of data-center power and cooling products began October by breaking above that level. This week, it pulled back to test it. Has old resistance become new support?
Second, prices wavered on either side of their 50-day simple moving average (SMA) for a few months and could now be accelerating from that line.
Third, the 50-day SMA had a “golden cross” above the 200-day SMA in July. That may suggest its longer-term uptrend is resuming.
Next, the 8-day exponential moving average (EMA) is above the 21-day EMA. MACD is also rising. Those signals may indicate the short-term trend has grown bullish again.
TradeStation has, for decades, advanced the trading industry, providing access to stocks, options and futures. If you're born to trade, we could be for you. See our Overview for more.
Past performance, whether actual or indicated by historical tests of strategies, is no guarantee of future performance or success. There is a possibility that you may sustain a loss equal to or greater than your entire investment regardless of which asset class you trade (equities, options or futures); therefore, you should not invest or risk money that you cannot afford to lose. Online trading is not suitable for all investors. View the document titled Characteristics and Risks of Standardized Options at www.TradeStation.com . Before trading any asset class, customers must read the relevant risk disclosure statements on www.TradeStation.com . System access and trade placement and execution may be delayed or fail due to market volatility and volume, quote delays, system and software errors, Internet traffic, outages and other factors.
Securities and futures trading is offered to self-directed customers by TradeStation Securities, Inc., a broker-dealer registered with the Securities and Exchange Commission and a futures commission merchant licensed with the Commodity Futures Trading Commission). TradeStation Securities is a member of the Financial Industry Regulatory Authority, the National Futures Association, and a number of exchanges.
TradeStation Securities, Inc. and TradeStation Technologies, Inc. are each wholly owned subsidiaries of TradeStation Group, Inc., both operating, and providing products and services, under the TradeStation brand and trademark. When applying for, or purchasing, accounts, subscriptions, products and services, it is important that you know which company you will be dealing with. Visit www.TradeStation.com for further important information explaining what this means.
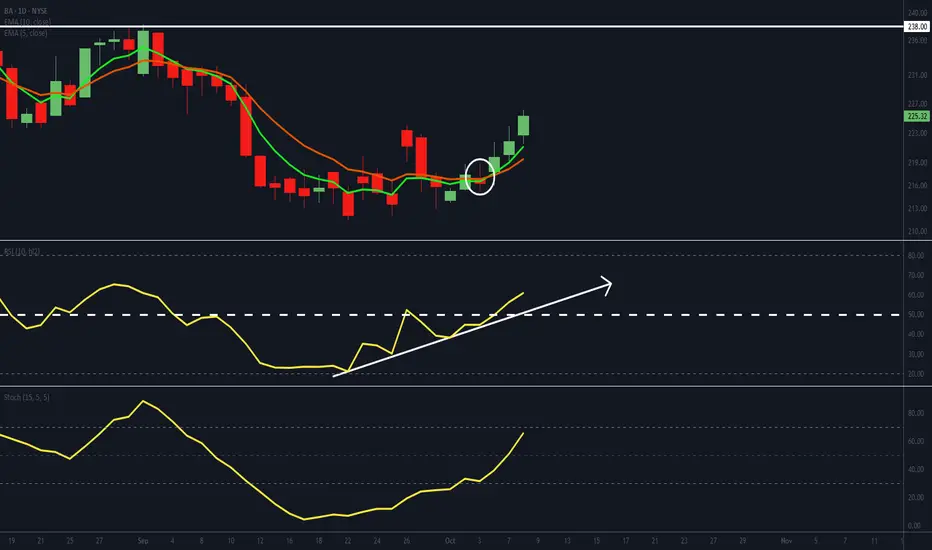
BA setting up for potentially strong move
- BA's EMAs have crossed bullishly and are developing angle and separation.
- Its RSI has popped above 50, suggesting a shift to positive momentum.
- Its stochastic is on the borderline to cross through 70. A move above, will add to the positive momentum argument. The longer it maintains above 70, the greater the likelihood of further price appreciations.
- Overhead resistance is at 238. A break above will be regarded as a bullish development.
Netflix Buy Alert!! The Rising 3 Soldiers Candlestick Patterns I did my first stream about two days ago.I was so sacred and nervous.
"This is a public stream, I better make sure I know what am talking about. I better make sure I show the pips my very best setups for trading."
I tell you I was super depressed because I want to be a good trading leader.
So I have been grinding trying to make sure I perfect my trading strategy and system and skills.
Because I want to show you the best of the best trades I can find.
No more just forex...or stocks I just want to be a great
technical analyst.
So today I did another stream and I had one person watching me trade live.
If you watch me trade analysis live you will really enjoy it 👍😊
It was an awesome stream.This is my business goal to become a streamer.
But am hoping for more viewers tomorrow.
Look at Netflix NASDAQ:NFLX
It's
Above the 50 MA
Above the 20 EMA
Above the 200 EMA
Notice the rising 3 soldiers 🟩🟩🟩Bullish candlestick patterns?
Notice how the last green candle
Gaps up? In green 🟢
The candlestick patterns are your confirmation of entry.
Netflix also has an earnings report coming soon.
This makes it's a perfect candidate for what Tim Sykes calls an earnings winner.. according to his book penny stock guide.
They are rumours that Netflix will partner with Warner Music to make movies based on it's artists such as Bruno Mars.
This report hasn't been confirmed yet.
Do you see how pop culture is linked to the financial markets? Like I told you yesterday?
This is a great stock to trade and ride the 🚀.
Rocket Boost This Content To Learn More.
Disclaimer ⚠️ Trading is risky please learn about risk management and profit taking strategies.Also feel free to use a simulation trading account.

Bearish Setup Builds in GBP/AUDSitting in a descending triangle pattern, a downside break of 2.0300 in GBP/AUD may elicit further selling, putting lower levels in play.
Should we see a decisive break of 2.0300, shorts could be established with a tight stop above for protection, targeting 2.0065, which the price tagged on multiple occasions earlier this year before staging a decisive break higher.
While bearish momentum is not strengthening, signals from RSI (14) and MACD both favour playing the pair from the short side, sitting below 50 and 0, respectively.
Good luck!
DS

Stock Influencers + 3-Step Rocket Booster Strategy Some days back there was a superstar actress that did an advertisement
For this company.
It was full of nice imagery,but then this ad caused that big Gap up you see
To the left of this chart?
This famous actress, Sydney Sweeney, 👖caused that gap 🤔
Influence is a big part of the financial markets.Maybe you are thinking
Becoming a trader means
You old school and you won't roll with the "latest" pop trends.
But that won't be the case.
Infact trading and pop culture are very much related.You will be shocked.
Just check the breakingnews tab below the price on tradingview.
Financial markets will always be a part of pop culture. Why?
Because entrepreneurs and investors always work together.
Remember that I actually noticed that one of my followers comes from the Andrew tate community.
Yes man, 😊 am a mini - influencer in the financial markets.
So this skill is not a small thing rich people will value your knowledge the moment you master trading.
This pattern follows the 3 Step
Rocket 🚀 Booster Strategy:
👉The price has to be above 50 EMA
👉The price has to be above 200 EMA👉The price should gap up
That last step you can clearly see on the chart.
And what I love about this chart is that the support is clear. From the appearance of the gap.
This gives you confidence that the price wont go lower.
Liquidity is above 500K volume
The price is "sitting" on the 50 EMA.
I need to document this strategy because I want a 🔥 fire trading system that works.
Join me on this trading journey to discover a powerful trading system.
Disclaimer ⚠️ Trading is risky please learn about risk management and profit taking strategies.Feel free to use a simulation trading account before you use real money.

The #1 Stock Buying Secret:Buying Undervalued Stocks A long time ago their was this
Young girl that I pursued.
She said no to my proposal.
She even told me,
"Lubosi I can't be your girlfriend,
My boyfriend works for the mines,
He won't be happy"
This happen during our date when I took her for ice cream.
I felt stupid and like an amateur.
When you enter the Ascending Triangle
+ The Long lower shadow candlestick patterns
You will find this stock.
What I love about this idea
Is the fact that it's following
The 3 month moving average + it's undervalued.
You can see the reversal by using
👉The Stochastic indicator.👈
It's in a oversold channel.
Buying undervalued stocks
Is the Hallmark of trading.
Remember don't use margin.
You want to taste your
Strategies for about 1 year
On a simulation trading account before you use real money.
Rocket Boost This Content To Learn More.
Disclaimer ⚠️ Trading is risky please learn about risk management and profit taking strategies. Also feel free to use a simulation trading account before you use real money.

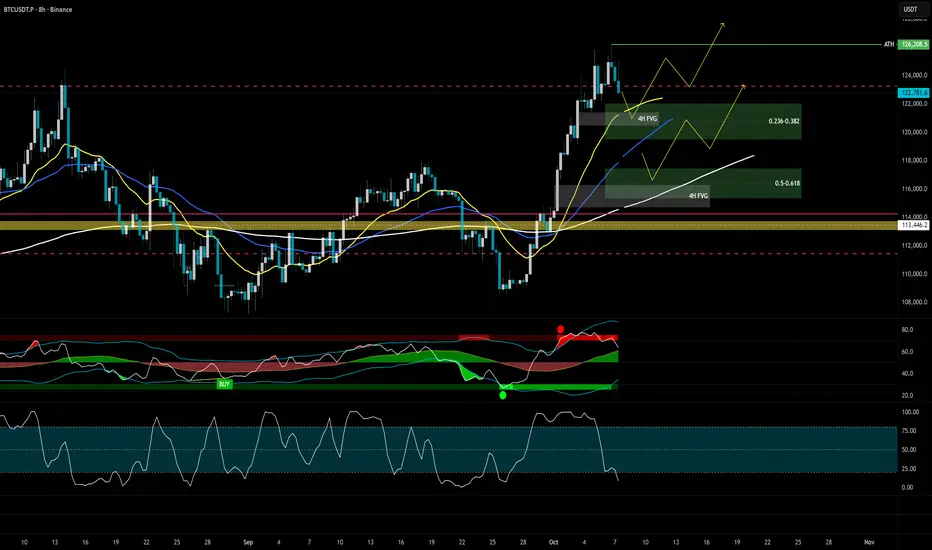
BTC 8H chart - bullish fibonacci pullback zones for resersalCRYPTOCAP:BTC 8H. Not worried about the pullback. Expecting it to hold bullish fibonacci pullback zones.
I have high probability two scenarios in mind approx. 4-8% pullback.
Notice lower oscillator indicator, Stoch RSI on 8H already starting to build momentum at the bottom zone.
Might take couple of days to consolidate in those levels.
Trying to find a base (USD/CHF)Setup: Possible bottom. Two failed breaks below 0.79 + RSI bullish divergence.
Signal : Waiting for daily close above down trendline
Plan B A weekly close below 0.79 shows long term downtrend stil in tact