BTC vs. The Fed: The "Neutral Coil" Before the ExplosionDescription: Today represents the collision of a massive macro catalyst (FOMC) and a technically "coiling" market. As professional traders, we do not gamble on the outcome of the speech; we identify the breakout levels that the speech will trigger.
1. The Macro Setup: Priced to Perfection According to the CME FedWatch Tool, the market has priced in an 89.6% probability of a rate cut.
The Trap: When certainty is this high, the "upside" of the news is often limited (priced in), while the downside risk of a "hawkish surprise" is violent. The market is leaning one way, which makes the reaction unpredictable.
2. The Technical Reality: Dead Neutral Replacing complex algorithms with standard, time-tested indicators reveals a market that is holding its breath.
RSI (14): Currently sitting at 48.45. This is effectively 50—dead neutral. Bulls and bears are in perfect equilibrium waiting for a trigger.
Bollinger Bands: Price is chopping directly on the 20 SMA (Middle Band). We are neither overbought nor oversold. We are in "fair value" territory, which is typically where trends go to pause before a volatility expansion.
ADX (Trend Strength): The ADX has dropped to 25, signaling that the previous directional trend has exhausted itself.
3. The Levels to Watch (The Trade) Because the technicals are neutral, we must wait for price to leave this "value zone" to confirm the winner.
Bullish Confirmation: We need a decisive Daily Close above the 0.382 Fib level ($97,600) and the upper resistance knot. Reclaiming this level opens the door to test the $100k psychological barrier.
Bearish Invalidation: If the Fed disappoints, watch the recent swing lows around $84,800. A loss of this support invalidates the recovery and exposes the lower Bollinger Band.
Summary: Do not front-run the Fed. The indicators (RSI 48, ADX 25) are telling us there is no trend right now. Wait for the volatility to break the range, then follow the momentum.
DISCLAIMER: Trading involves significant risk. This analysis is for educational purposes only and is not financial advice. Do your own due diligence.
Macro

Bitcoin Range Play: 94.2k Gate or 84k MagnetMarket Overview
__________________________________________________________________________________
Price is compressing beneath a dense 92,285–94,213 resistance band into the FOMC, with higher timeframes still tilted down. The tape shows a corrective range: rallies into resistance are being faded while demand sits much lower.
Momentum: Bearish-to-range bias under 94,213 as HTF trend filters (12H/1D) point Down; bounces are tactical and short-lived without confirmation.
Key levels:
- Resistances (HTF): 92,285–94,213 (240–1D confluence), 98,330 (Weekly).
- Supports (HTF): 90,900–91,100 (2H shelf), 89,550 (240 PL), 83,900–84,400 (1D/1H ISPD cluster + D Pivot Low).
Volumes: Normal to moderate overall; noteworthy 1H rejection on very high volume above ~93.5k (bearish context while below resistance).
Multi-timeframe signals: 1D/12H/6H Down, 4H Up tactical, 2H/1H/30m/15m Up tactical; HTF downtrend plus overhead resistance argues for patience or fades until a clean reclaim.
Harvest zones: 77,100 (Cluster A) / 83,700–84,400 (Cluster B) — ideal dip-buy areas for inverse pyramiding, with Cluster B aligned to the Daily Pivot Low.
Risk On / Risk Off Indicator context: NEUTRE VENTE — risk-off regime, confirming the cautious momentum beneath HTF resistance.
Trading Playbook
__________________________________________________________________________________
With HTF down-filters active, adopt a neutral-sell stance below 94,213 and let the FOMC be your catalyst filter.
Global bias: Neutral-sell below 94,213; key invalidation for shorts on a daily close > 94,600 with persistence.
Opportunities:
- Tactical sell: Fade 92,285–94,213 if rejection/weak breadth; target 91.9k/89.55k.
- Breakout buy: Daily close and hold > 94,213 (≥2–3 bars on execution TF) opens 98.33k.
- Dip-buy: 83,700–84,400 cluster only on ≥2H reversal; deeper 77.1k on capitulation with strong signal.
Risk zones / invalidations:
- Break below 89,550 unlocks the magnet toward ~84k cluster; longs invalidated there if no reversal.
- Daily close > 94,600 invalidates the fade and favors 98.33k follow-through.
Macro catalysts (Twitter, Perplexity, news):
- FOMC decision/presser today; tone likely dictates whether 94,213 breaks or 89.55k/84k retests.
- US bank access headlines (OCC letter, PNC spot BTC) are structurally supportive but not overriding HTF resistance yet.
- Hard-asset beta bid (silver > $60) hints at medium-term constructive backdrop if policy is supportive.
Harvest Plan (Inverse Pyramid):
- Palier 1 (12.5%): 77,100 (Cluster A) + reversal ≥2H → entry
- Palier 2 (+12.5%): 74,000–72,500 (-4/-6% below Palier 1) → reinforcement
- TP: 50% at +12–18% from PMP → recycle cash
- Runner: hold if break & hold first R HTF (94,213)
- Invalidation: < HTF Pivot Low or 96h no momentum (D Pivot Low 83,900)
- Hedge (1x): Short first R HTF on rejection + bearish trend → neutralize below R (94,213)
Multi-Timeframe Insights
__________________________________________________________________________________
Timeframes are split: HTF downtrend governs, while lower TFs attempt tactical bounces into stacked resistance.
1D/12H/6H: Downtrend intact beneath 92,285–94,213; failure wicks above ~93.5–94.2k reinforce sell-the-rip; downside magnets remain 89,550 then the ~84k cluster.
4H: Tactical Up but counter to HTF; range structure with supply at 93.5–94.2k and support ~89.6k offers fade entries unless 94,213 is reclaimed decisively.
2H/1H/30m/15m: Up tactical momentum stalls below 94,213; watch 92,285 retests for lower highs. A clean 2H reversal at 89,550 can bounce to 92,285; loss of 89,550 exposes ~84k.
Major confluence: 83,700–84,400 aligns ISPD (1D/1H) with the D Pivot Low — the highest quality demand if tested; 92,285–94,213 is the key supply wall to beat.
Macro & On-Chain Drivers
__________________________________________________________________________________
Into the FOMC, positioning is cautious; structural headlines are improving but flows are not yet decisive.
Macro events: The Fed decision and guidance dominate; a dovish tilt could force a squeeze through 94,213 toward 98.33k, while a hawkish tone favors renewed tests of 89,550/84k. Silver’s surge above $60 underscores hard-asset demand if policy eases.
External Macro Analysis: Broader risk appetite is mixed; elevated implied vol and event risk align with a wait-and-see stance — consistent with our neutral-sell bias until 94,213 is reclaimed.
Bitcoin analysis: Price pinned under 93–97k resistance; several analysts flag limited resistance to ~106k on a confirmed break above ~97k; HTF bull structure intact only while mid-60ks stay unbroken on the really big picture.
On-chain data: ETF net flows modest (7d ~ flat); spot CVD softened; OI lighter; structure fragile unless HTF levels are reclaimed.
Expected impact: Macro/on-chain currently cap upside under resistance; a dovish FOMC could flip the tape to breakout mode, otherwise the path of least resistance is range-backfill into 89.55k and possibly the ~84k cluster.
Key Takeaways
__________________________________________________________________________________
BTC sits in a corrective range beneath 94,213 with HTF down-filters active and event risk front and center.
- Trend: Bearish-to-range while below 94,213; respect the 92,285–94,213 supply until a decisive reclaim.
- Most relevant setup: Fade rejections at 92,285–94,213 with targets to 91.9k/89.55k; switch long only on ≥2H or daily confirmation at ~84k or above 94,213.
- Key macro factor: FOMC decision likely sets direction; dovish break > 94,213 versus hawkish roll back into 89.55k/84k.
Stay disciplined: wait for your signal, then commit — this is a boss fight, not a button mash.

Bitcoin Pre‑FOMC: 92.3k Reclaim or 84k Reload__________________________________________________________________________________
Market Overview
__________________________________________________________________________________
Bitcoin remains in a controlled range beneath 92,285–94,213, with sellers defending overhead supply while buyers cluster around the mid-to-high 80Ks. Momentum is two‑sided but tilts cautious as macro risk remains event‑driven into the Fed.
Momentum: Range with a bearish tilt under 92,285; rallies fade at HTF resistance while 88–84k buys time for consolidation.
Key levels:
- Resistances (4H/1D): 92,285–94,213; 98,330 (weekly underside).
- Supports (4H/1D): 89,258–88,122; 83,871–84,405 (dense cluster with D Pivot Low).
Volumes: Mostly normal on 1–6H with occasional 15m spikes; overall moderate.
Multi-timeframe signals: 12H Down vs 1D Up; 4H attempts up but stalls at 92,3k; net NEUTRAL SELL bias until reclaim.
Harvest zones: 75,700 (Cluster A) / 83,600–84,400 (Cluster B) — ideal dip‑buy areas for inverse pyramiding if a flush prints a ≥2H reversal.
Risk On / Risk Off Indicator context: Neutral sell bias; it confirms the cautious momentum and favors disciplined fades at resistance unless 92,3k is reclaimed.
__________________________________________________________________________________
Trading Playbook
__________________________________________________________________________________
Strategically, treat this as a range with overhead supply; lean patient and reactive, not predictive.
Global bias: NEUTRAL SELL while price is capped below 92,285; invalidation of the cautious stance on a sustained reclaim and hold above 92,285.
Opportunities:
- Buy: 84,0–84,6k cluster only on ≥2H bullish reversal; scale toward 90,2–90,6k, then 92,3–94,2k.
- Breakout: Long on break & retest of 92,3k with breadth; target 94,2k then 98,3k.
- Tactical sell: Fade 92,3–94,2k rejection with weak breadth; manage to 90,4k then 88,3–88,0k.
Risk zones / invalidations: Break and daily/12H hold above 94,6k would invalidate the near‑term short bias; loss of 83,6–83,9k would invalidate the long-at‑84k thesis.
Macro catalysts (Twitter, Perplexity, news):
- FOMC decision and guidance are the near‑term pivot; a dovish tilt could clear 92,3k, a firm tone risks a re‑test of 88k/84k.
- ETF flows slightly negative — a mild headwind to risk‑on.
- External dashboard: Risk On / Risk Off Indicator in sell mode; credit‑sensitive gauges soft, early‑cycle tech mixed — mid‑cycle feel.
Harvest Plan (Inverse Pyramid):
- Palier 1 (12.5%): 75,700 (Cluster A) + reversal ≥2H → entry
- Palier 2 (+12.5%): 72,500–71,200 (-4/-6% below Palier 1) → reinforcement
- TP: 50% at +12–18% from PMP → recycle cash
- Runner: hold if break & hold first R HTF (92,285)
- Invalidation: < HTF Pivot Low (83,900) or 96h no momentum
- Hedge (1x): Short first R HTF on rejection + bearish trend → neutralize below R
__________________________________________________________________________________
Multi-Timeframe Insights
__________________________________________________________________________________
Across frames, the market grinds in a capped range: higher timeframes hold key resistance while midframes lean downtrend, keeping the tape tactical.
12H/6H/2H/30m/15m (Down bias): Price capped below 92,3k with frequent fades; supports at 89,0–88,1k and the 84k cluster attract mean‑reversion bounces.
1D/4H (Up attempt but constrained): Structure can repair if 92,3k breaks and holds; until then, path of least resistance is sideways‑to‑down inside the range.
1H (Mixed): Local supply at 90,9–91,3k acts as a lid; reclaiming this band is often a precursor to testing 92,3k.
__________________________________________________________________________________
Macro & On-Chain Drivers
__________________________________________________________________________________
Macro is event‑driven into the Fed, with mixed risk gauges and soft crypto fund flows tempering trend conviction.
Macro events: Fed decision and press conference in focus; a dovish read supports a 92,3k reclaim while a firm stance risks extending the range or probing 88k/84k. Global yields firmed on ECB tone; gas prices soft aid disinflation.
External Macro Analysis: The Risk On / Risk Off Indicator leans sell; credit‑risk gauges cautious; early‑cycle tech mixed — a mid‑cycle profile that aligns with a neutral‑sell technical bias unless 92,3k flips.
Bitcoin analysis: ETF net outflows are a mild headwind; corporate bids provide dip demand but not trend control. 92k is the ceiling to clear; 88k is pivotal support.
On-chain data: Ownership concentration rising as small holders ebb; whale transfers noted but directional intent unclear; realized volatility remains muted, consistent with “controlled vol.”
Expected impact: Macro/on‑chain context supports a patient, reactive stance — bullish if 92,3k is reclaimed with volume, cautious if 88k breaks toward the 84k cluster.
__________________________________________________________________________________
Key Takeaways
__________________________________________________________________________________
Range with a cautious tilt persists beneath 92,3k as the market awaits the Fed.
- Trend: Neutral to bearish inside 92,285–94,213 resistance; buyers defend 88–84k.
- Best setup: Buy only on confirmed 84k reversal or 92,3k break‑and‑retest; fade weak rejections into 92,3–94,2k.
- Macro: FOMC guidance is the catalyst that can resolve the range and validate or negate the 92,3k reclaim.
Stay patient and surgical — in this Tarkov‑style map, the best loot is in defended zones, not in blind pushes.

BTC Range Play: ISPD Cluster Holds, Eyes on FOMCMarket Overview
__________________________________________________________________________________
Bitcoin is consolidating just above a tightly packed multi-timeframe demand cluster, with price boxed between well-defined supports and the 92k–92.5k ceiling as the market waits for the FOMC catalyst.
Momentum: Neutral with a slight bullish tilt while 89,100–89,400 holds; sellers continue to defend 92,000–92,500.
Key levels:
- Resistances (HTF): 91,000–91,400; 92,000–92,500; 99,000–100,000
- Supports (HTF): 89,100–89,400 (multi‑TF cluster); 87,800–88,200 (pivot low); 86,000
Volumes: Moderate on intraday and HTF; no sustained extremes.
Multi-timeframe signals: 1D/12H neutral; 6H/4H/2H lean neutral‑buy at the ISPD floors; LTFs remain choppy under 91k.
Harvest zones: 89,400 (Cluster A) / 89,100–89,300 (Cluster B) — ideal dip‑buy zones for inverse pyramiding with confirmation.
Risk On / Risk Off Indicator context: Sell bias (risk‑off) dominates; it contradicts the mild buy tilt at support and argues for patience into FOMC.
Trading Playbook
__________________________________________________________________________________
The dominant structure is a range with demand control at 89.1k–89.4k and supply at 91k–92.5k; adopt a reactive stance, buying confirmed reversals at the floor and fading clean rejections at HTF resistance.
Global bias: Neutral‑buy above 89,100–89,400; invalidation on a sustained break below 87,800.
Opportunities:
- Buy the dip: 2H+ bullish reversal at 89,100–89,400; partial size, add only on confirmation.
- Breakout buy: Close and hold above 92,500 opens 95k–100k; enter on retest that holds.
- Tactical sell: Fade rejection at 91,000–91,400 (or 92,000–92,500) only with bearish candle + weak volume.
Risk zones / invalidations: A daily/12H close below 87,800 would invalidate the neutral‑buy and expose 86,000; failure to follow through within 48–72h after entry also invalidates.
Macro catalysts (Twitter, Perplexity, news): FOMC with a widely expected 25 bps cut; JOLTS/CPI and Powell’s tone to steer liquidity; gold firm and USD/yields steady keep risk sensitivity elevated.
Harvest Plan (Inverse Pyramid):
- Palier 1 (12.5%): 89,400 (Cluster A) + reversal ≥2H → entry
- Palier 2 (+12.5%): 85,800–84,000 (-4/-6% below Palier 1) → reinforcement
- TP: 50% at +12–18% from PMP → recycle cash
- Runner: hold if break & hold first R HTF (91,400)
- Invalidation: < HTF Pivot Low (87,800) or 96h no momentum
- Hedge (1x): Short first R HTF on rejection (91,400) + bearish trend → neutralize below R
Multi-Timeframe Insights
__________________________________________________________________________________
Across TFs, price is coiling above a dense demand cluster while capped by layered supply into 92k–92.5k.
1D/12H: Sideways/neutral under 92k–92.5k; structure constructive above 87,800 with a clean pivot low; a decisive close above 92,500 is needed to unlock 95k–100k.
6H/4H/2H: Compression above 89,100–89,400 ISPD floors; repeated defenses signal high‑quality demand, but upside needs volume through 91,000–91,400 to avoid another lower high.
1H/30m/15m: Noisy mean‑reversion inside 89,250–91,000; intraday reversals work best when aligned with ≥2H signals. Confluence at the ISPD floors is the edge; macro risk is the main divergence.
Macro & On-Chain Drivers
__________________________________________________________________________________
Macro risk dominates into the FOMC while the external risk regime tilts risk‑off; that keeps Bitcoin’s range intact until a decisive post‑Fed move.
Macro events: Markets largely price a 25 bps cut; Powell’s guidance on path/duration is key. CPI/JOLTS add event risk; gold is firm and USD/yields steady, keeping risk assets sensitive.
External Macro Analysis: Risk On / Risk Off Indicator = sell regime with late‑cycle tone; speculative appetite and credit show stress while semis/small caps are conflicted. This supports a cautious technical bias until confluence improves.
Bitcoin analysis: Bounce from 86–87k reclaimed 90k; 87,800–88,200 is the HTF pivot low; 91k–92.5k caps. Structural resumption needs sustained strength toward 99k–100k. ETF daily inflow positive, but 7‑day average muted.
On-chain data: Demand modest; capital momentum slightly positive; 96–106k quantile remains pivotal for trend resumption; holding the ISPD cluster stabilizes, a breakdown opens an air pocket.
Expected impact: Risk‑off macro tempers upside until post‑FOMC; a supportive Powell could unlock a push through 92.5k, while a hawkish surprise risks losing the 89k cluster.
Key Takeaways
__________________________________________________________________________________
BTC is range‑bound into FOMC, with demand clustered at 89.1k–89.4k and supply stacked at 91k–92.5k.
The overall trend is neutral with a mild buy bias above the ISPD floors. The most relevant setup is buying a confirmed 2H+ reversal at 89.1k–89.4k, then adding only as 91k–91.4k breaks on volume. A risk‑off macro regime into FOMC argues for patience and hard invalidations. Stay nimble and let the post‑Fed move define the next leg; harvest volatility, don’t chase it.

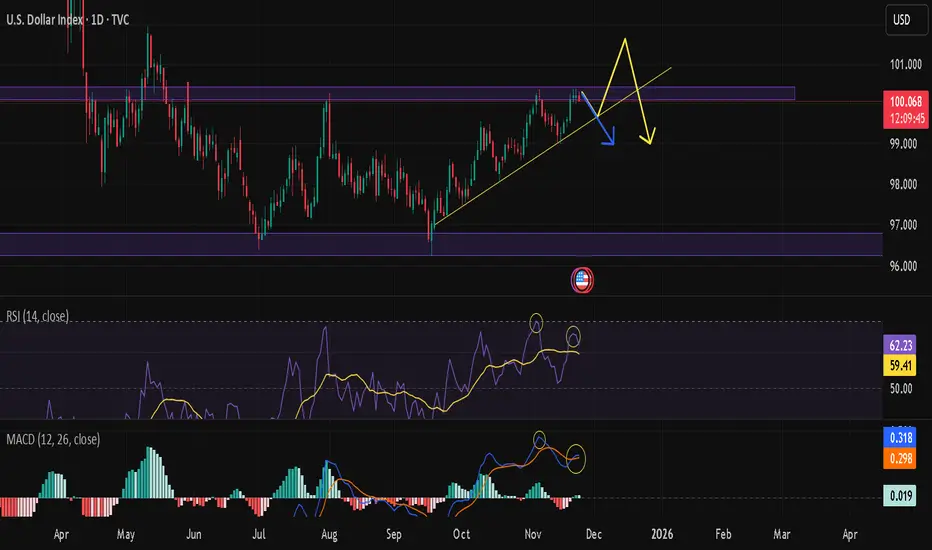
DXY at a KEY “Decision Point” on the Supply ZoneAfter an extended bullish duration, the DXY is now challenging a technically critical “Supply Zone” (100.150 – 100.600). Further away from key levels, both pump and dump up and down, momentum oscillators on all time frames give us mixed signals of exhaustion from buyers and that we are near to making a big decision in the direction of our market.
A comprehensive technical look that includes the broader structures and multi-month macroeconomic supply-demand analysis.
TECHNICAL OUTLOOK
Critical Resistance (Purple Zone): We are currently sitting right inside that 100.150 – 100.600 corridor. This is a level we know well—it’s packed with strong selling pressure and smart money order blocks. Think of this zone as a huge mental hurdle for the bulls; trying to go "Long" here without seeing a clean, high-volume breakout is just asking for trouble with a bad risk/reward setup.
Trend Structure: That ascending yellow trendline connecting the lows since September has been holding the price up so far. But look closer—the space between the price and this trend support is squeezing tight (Compression). This usually tells us one thing: volatility is kicking in and a big move is brewing.
Negative Divergence (RSI) : Here’s the warning sign. While the daily chart is trying to make new highs or just hanging on at resistance, the RSI is losing steam and making lower highs. This "Bearish Divergence" is a classic signal that the trend is running on fumes.
Momentum (MACD) : The MACD histogram is fading out, which confirms the bulls are getting tired. It hints that profit-taking—and the sellers taking over—is likely just around the corner.
MACROECONOMIC AND FUNDAMENTAL DYNAMICS
Fed Expectations : The market is scrambling to rethink the Fed's rate path for 2025. We are watching the data like hawks right now; even a small sign of cooling in jobs or PMI data could spark a rejection from this resistance and send the DXY correcting downwards.
Bond Yields : Any pullback in the US 10-Year Treasury Yields (US10Y) is going to add fuel to the fire for sellers on the Dollar Index.
Liquidity Hunt: Watch out for the "fakeout." Market makers might try to push the price just above that 100.600 level to grab liquidity and hunt the stops of early shorters before slamming it back down. Keep your eyes peeled on the Price Action here.
STRATEGY AND OUTLOOK
Since we are banging our heads against resistance, opening new long positions here just isn't juicy enough risk-wise.
Bearish Scenario: If we see a hard crash with volume breaking that ascending yellow trendline, that seals the deal for a reversal. If that happens, we’re looking at intermediate supports first, with the main target being that 96.50 level down low.
Bullish Scenario : Unless we get a solid daily candle close above 100.800, any rallies should be looked at as opportunities to sell. If the price stays above that level, then this idea is dead in the water.
Conclusion: It’s a "sit on your hands" moment. Waiting for that trend support to break is the safest confirmation we can get before jumping in.
Disclaimer : Just sharing my personal notes and educational analysis here, not financial advice.
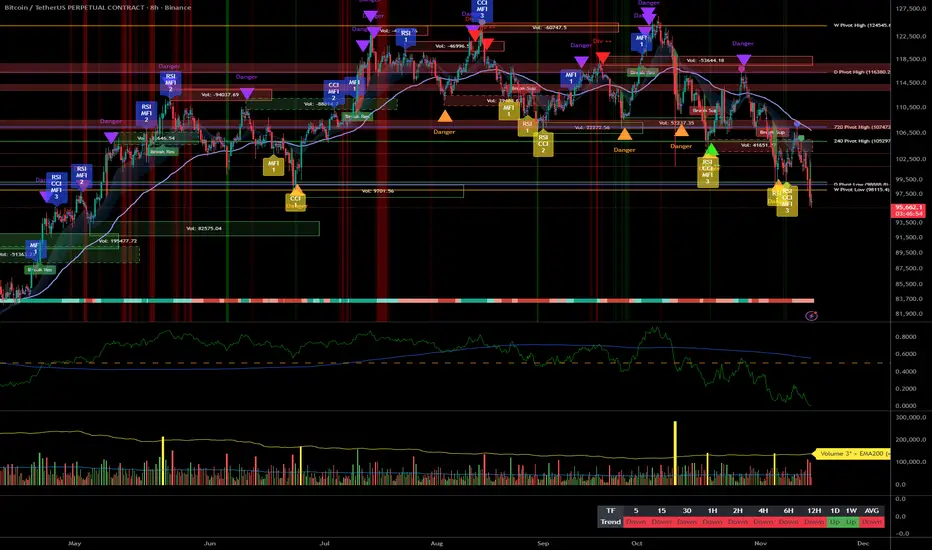
Bitcoin Squeeze Into HTF Cap: Harvest Zones MappedMarket Overview
Bitcoin ripped from the 80,620 daily pivot low into a stacked multi‑timeframe cap at 93,105. The bounce is strong, but on 12H/1D it remains a counter‑trend rally pressing a decision point as macro risk tone is still cautious.
Momentum: Bearish bias with a counter‑trend squeeze into 93,105; trend filters (12H/1D) remain down while weekly stays up.
Key levels:
- Resistances (HTF): 93,100–93,105 (720/240 PH), 107,462 (1D PH), 126,219 (1W PH)
- Supports (HTF/MTF): 91,700–90,300 (240 PH/PL zone), 89,300 (240 PL), 80,600 (D Pivot Low + ISPD cluster)
Volumes: Very high volume on the daily rebound; normal to moderate intraday — powerful buy response, but treat it as a catalyst into resistance.
Multi-timeframe signals: 1D/12H down vs 1W up; intraday (1H/30m/15m) up but compressing under 93,105 — aligns with fade‑the‑rip unless 93,105 is reclaimed with persistence.
Harvest zones: 80,600 (Cluster A) / 83,800–84,500 (Cluster B) — ideal dip‑buy zones for inverse pyramiding only with ≥2H reversal signals.
Risk On / Risk Off Indicator context: NEUTRE VENTE — confirms a cautious, sell‑the‑rally stance unless we see multi‑day improvement.
Trading Playbook
__________________________________________________________________________________
With HTF trend filters down, favor a defensive stance: fade strength into 93,105 and only buy confirmed reversals at deep floors.
Global bias: Neutral‑sell while price is below 93,105; invalidation on sustained acceptance above 93,105 (12H–1D).
Opportunities:
- Tactical sell: Fade 93,100–93,300 on rejection; targets 91,700 then 90,250; invalidate on 12H acceptance above 93,105.
- Tactical buy: 2H reversal at 84,500–83,800 (Cluster B); first TP 89,300; invalidate on 2H close beneath the acted floor.
- Strategic buy: 2H+ reversal at 80,600 (Cluster A) for a swing back toward 93,105.
Risk zones / invalidations: A break below 84,500 opens 80,600; daily acceptance above 93,105 flips risk toward 96,000–101,000.
Macro catalysts (Twitter, Perplexity, news): Expansionary PMIs with softer oil and tame Swiss CPI support risk; FOMC ahead can flip the Risk On / Risk Off Indicator; spot ETF inflows are modestly positive but not decisive.
Harvest Plan (Inverse Pyramid):
- Palier 1 (12.5%): 80,600 (Cluster A) + reversal ≥2H → entry
- Palier 2 (+12.5%): 77,400–75,800 (-4/-6% below Palier 1)
- TP: 50% at +12–18% from PMP → recycle cash
- Runner: hold if break & hold first R HTF (93,105)
- Invalidation: < HTF Pivot Low 80,600 or 96h no momentum
- Hedge (1x): Short first R HTF (93,105) on rejection + bearish trend → neutralize below R
Multi-Timeframe Insights
__________________________________________________________________________________
Across TFs, price is pressing a multi‑TF pivot at 93,105 while lower clusters remain the highest‑quality demand.
1D/12H/6H/4H/2H: Counter‑trend rally into 93,105; structure remains heavy below this cap, with first pullback support at 91,700–90,300 and deeper floors at 89,300 and 80,600.
1W: Uptrend intact; reclaim and hold above 93,105 would unlock 96,000–101,000, keeping the larger cycle constructive.
1H/30m/15m: Local uptrend but compressing under 93,105; watch for false break wicks to fade or a clean reclaim + retest to follow higher.
Confluence: 80,600 aligns multi‑TF ISPD floors, AGG(Median) and the D Pivot Low; 93,105 is a 720/240 PH cluster — the key decision gate.
Macro & On-Chain Drivers
__________________________________________________________________________________
Macro reads lean cautiously risk‑on (PMIs >50, softer oil, cool Swiss CPI) but the tech risk regime remains unfavorable, keeping BTC sensitive to policy tone.
Macro events: Broadly expansionary PMIs, oil softer, and subdued Swiss CPI ease inflation impulse; the market awaits the Fed decision, which can reprice risk quickly.
External Macro Analysis: Risk On / Risk Off Indicator master read is bearish with credit stress (HYG) and high‑beta weakness (ARKK) confirmed; semis/small caps in conflict — a mid‑cycle mix that argues for prudence and choppy volatility.
Bitcoin analysis: Modest spot‑ETF inflows and widening institutional access (Vanguard, BoA) add a tailwind, but not enough to overrule HTF resistance without confirmation.
On-chain data: Fresh stablecoin mints suggest dry powder, while some very old coins moving adds supply risk; options skew remains defensively tilted at longer tenors.
Expected impact: Macro/on‑chain backdrop tempers the squeeze; favors selling the 93k rip and buying only confirmed dips at 83.8–84.5k and 80.6k until the regime improves.
Key Takeaways
__________________________________________________________________________________
BTC is squeezing into a heavy HTF cap at 93,105 while the risk regime stays NEUTRE VENTE.
The broader trend is bearish on 12H/1D, so the highest‑probability setup is to fade 93,105 and accumulate on confirmed reversals at 83.8–84.5k and 80.6k. Macro is mixed: PMIs supportive but the risk regime and credit tone remain cautious. Stay patient at the gate and let the level decide the next run.

BTC Risk-Off Drop: 84.6k Floor or 80.6k Test?
__________________________________________________________________________________
Market Overview
__________________________________________________________________________________
Bitcoin just absorbed a high-energy risk-off flush from the 90–92k supply shelf and is sliding toward a dense 84.6k demand cluster. Momentum remains down on HTFs; bounces are corrective unless key resistances are reclaimed.
Momentum: Bearish bias with a corrective bounce attempt; structure prints lower highs across HTFs and rejects 90–92k.
Key levels:
- Resistances (HTF): 88,500–89,000 (breakdown block) / 90,248–91,969 (4H supply) / 95,358 (1D Kijun).
- Supports (HTF): 86,000–86,200 (minor shelf) / 84,568–84,629 (ISPD cluster) / 80,619 (D Pivot Low).
Volumes: Very high on the daily selloff; moderate-to-normal on intraday rebounds.
Multi-timeframe signals: 1D/12H/6H/4H/2H/1H trends are Down; only notable exception is a 1D ISPD “BUY” context at 84.6k that requires a clear reversal signal to act.
Harvest zones: 84,600 (Cluster A) / 79,100–79,600 (Cluster B). These are the preferred dip-buying locations for inverse pyramiding when a ≥2H reversal prints.
Risk On / Risk Off Indicator context: NEUTRE VENTE — confirms the downside momentum and argues for fading rallies unless 88–88.5k is reclaimed with strength.
__________________________________________________________________________________
Trading Playbook
__________________________________________________________________________________
With HTFs pointing Down, the stance is defensive: fade rallies into supply and only buy the 84.6k floor on confirmed reversal.
Global bias: NEUTRAL SELL while below 90,248–91,969; invalidation for shorts on sustained daily close above 92,000.
Opportunities:
- Tactical buy: 84,568–84,629 test only on ≥2H bullish reversal; scale out into 86,200 then 87,600–88,000.
- Breakout buy: Reclaim and hold above 88,000–88,500 with follow-through into 90.2–92.0k; manage risk tightly.
- Tactical sell: Fade rejections at 87,600–88,000 or 90,248–91,969; targets 86,200 → 84,600 → 80,600 if momentum persists.
Risk zones / invalidations: A sustained close below 84,200 likely opens 80,619 then 79,100–79,600; a sustained daily close above 92,000 negates the near-term bearish read.
Macro catalysts (Twitter, Perplexity, news): BOJ tightening risk and yen volatility keep risk premia elevated; FOMC/dot plot can flip tone — wait for post-event persistence; ETF 7d flows negative despite a small daily inflow, limiting macro support.
Harvest Plan (Inverse Pyramid):
- Palier 1 (12.5%): 84,600 (Cluster A) + reversal ≥2H → entry
- Palier 2 (+12.5%): 81,200–79,500 (-4/-6% below Palier 1; Cluster B included) → reinforcement
- TP: 50% at +12–18% from PMP → recycle cash
- Runner: hold if break & hold first R HTF 90,248–91,969
- Invalidation: < 80,600 HTF Pivot Low or 96h no momentum
- Hedge (1x): Short first R HTF on rejection + bearish trend → neutralize below R
__________________________________________________________________________________
Multi-Timeframe Insights
__________________________________________________________________________________
Across the stack, structure is bearish with a corrective rebound; the 84.6k floor is the key battleground.
1D/12H group: Rejected 90–92k; drifting toward 84.6k. A clean ≥12H reversal at 84.6k could fuel a tradable bounce; failure exposes 80,619 then 79.1–79.6k.
6H/4H/2H group: Lower-high sequence intact; best sells at 88.5–89.0k and 90.2–92.0k. Breakdown retests under 86.0k stay valid with momentum.
1H/30m/15m group: Bounce is corrective into supply; very high volume printed on the leg down. Intraday long only on confirmed reversal at 84.6k; otherwise fade into resistance.
Major confluence: 84.6k is a tight 1D+30m floor cluster; 90.2–92.0k is dominant HTF supply. This confluence frames the range to harvest.
__________________________________________________________________________________
Macro & On-Chain Drivers
__________________________________________________________________________________
Risk-off impulses were amplified by yen-carry tremors and soft Asia data, while crypto flows remain mixed.
Macro events: BOJ tightening risk (2Y JGB near 1%) and USD/JPY volatility spilled into risk assets; FOMC/dot plot ahead can reset the volatility regime; energy/geopolitical tension adds a risk premium.
External Macro Analysis integration: The Dashboard flags the Risk On / Risk Off Indicator as BEAR with stress in credit (HYG) and high beta (ARKK) — this confirms the technical NEUTRAL SELL bias.
Bitcoin analysis: ~$4k air-pocket drop, ~$300M long liquidations; traders eye 82–80k on further stress versus an 88k reclaim to neutralize near-term risk; ETF 7d flows remain negative.
On-chain data: Liquidity thin; options skew defensive with heavy puts near 84k and elevated IV into December — rallies prone to fade without spot absorption.
Expected impact: Macro/on-chain backdrop supports a cautious, sell-rallies stance unless 88–88.5k is reclaimed and funding/spot absorption improves.
__________________________________________________________________________________
Key Takeaways
__________________________________________________________________________________
BTC is in a risk-off downswing, probing toward a high-quality 84.6k floor while HTFs remain bearish.
The trend is bearish-to-neutral below 90.2–92.0k; the most relevant setup is buying a confirmed 84.6k reversal or fading rejections at 88.5–89.0k and 90.2–92.0k. Macro risk from BOJ/FOMC and weak ETF flows argues for patience and tight risk. Stay methodical — harvest volatility, don’t chase.

BTC Playbook: Rebound into Supply, Cluster A Prime__________________________________________________________________________________
Market Overview
__________________________________________________________________________________
Bitcoin rebounded strongly from the 80k area and is now pressing into stacked higher-timeframe supply near 93k–96k amid thin liquidity and cautious macro flows. The short-term bounce runs into HTF headwinds while higher-quality demand sits lower.
Momentum: Bearish tilt within a corrective rebound; price is testing HTF resistance while higher-timeframe trend filters remain down.
Key levels:
- Resistances (HTF): 93,000–96,000 (12H/1D supply), 107,500 (1D pivot high)
- Supports (HTF/MTF): 91,000–91,300 (local pivot), 89,300 (240 PL), 84,600–82,600 (1D/12H floors)
Volumes: Very high on the daily rebound; normal to moderate intraday, which argues against chasing into supply.
Multi-timeframe signals: 1D/12H down; 6H/4H/2H neutral-to-down into resistance; 1H/30m up but at supply. This aligns with fading 93k–96k and reserving longs for deeper, confirmed floors.
Harvest zones: 80,600 (Cluster A) / 79,700–80,000 (Cluster B) — prime dip-buy area for inverse pyramiding if reached and confirmed.
Risk On / Risk Off Indicator context: Neutral Sell; it contradicts the short-term bounce and supports a cautious “sell rips, buy only quality dips” approach.
__________________________________________________________________________________
Trading Playbook
__________________________________________________________________________________
The dominant higher-timeframe trend is still down; adopt a tactical stance: fade 93k–96k unless the market reclaims and holds above it, and reserve dip-buys for confirmed floors.
Global bias: Neutral Sell while below 96,000; invalidation of the bearish tilt on a sustained 1D/12H close and hold above 96,000.
Opportunities:
- Tactical sell: Fade 93,000–96,000 rejections on a 4H/12H bearish close; targets 91,300 then 89,300.
- Breakout buy: Only on 1H/4H close and hold above 96,000; buy the retest toward 100k.
- Dip buy: 84,600–82,600 flush or 80,600–79,700 Cluster A with ≥2H bullish reversal; scale on confirmation.
Risk zones / invalidations: Clean acceptance above 96,000 invalidates near-term shorts; a daily close below 84,600 raises odds of revisiting Cluster A.
Macro catalysts (Twitter, Perplexity, news):
- CME outages and thin post-holiday liquidity raise whipsaw/gap risk, favoring patience at edges.
- Hard-asset strength (silver ATH; gold bid) and Eurozone disinflation support a rate-cut narrative but do not negate HTF supply overhead.
- US spot ETF 7-day flows are still negative, tempering risk appetite into month-end.
Harvest Plan (Inverse Pyramid):
- Palier 1 (12.5%): 80,600 (Cluster A) + reversal ≥2H → entry
- Palier 2 (+12.5%): 77,400–75,800 (-4/-6% below Palier 1)
- TP: 50% at +12–18% from PMP → recycle cash
- Runner: hold if break & hold first R HTF (96,000)
- Invalidation: < 79,700 (HTF Cluster A floor) or 96h no momentum
- Hedge (1x): Short first R HTF on rejection + bearish trend → neutralize below R
__________________________________________________________________________________
Multi-Timeframe Insights
__________________________________________________________________________________
Across timeframes, short-term momentum is fighting into higher-timeframe supply while the broader trend filters stay bearish.
1D/12H: Downtrend intact; price sits beneath the 96k daily Kijun and the 96k supply band. Acceptance above 96k is required to unlock 100k+.
6H/4H/2H: Neutral-to-down; the rebound leg is pressing 93k with layered supply up to 96k. Best risk-reward is fading into that band or waiting for deeper pullbacks.
1H/30m/15m: Up but at resistance; strong daily volume on the bounce helps, yet intraday signals should not override HTF filters at 93k–96k.
__________________________________________________________________________________
Macro & On-Chain Drivers
__________________________________________________________________________________
Macro remains cautiously supportive of hard assets, but market plumbing and liquidity are fragile, which can amplify moves at technical edges.
Macro events: CME outages/resumptions and a holiday-thin session increase gap/whipsaw risk; silver printed an all-time high and Eurozone disinflation aids rate-cut expectations; overall risk tone is mildly constructive but fragile.
Bitcoin analysis: Above roughly 91.5k, technicians eye a path toward upper resistance; 93k is the first gate, with a medium-term retrace band floated at 107k–117k if upside confirms.
On-chain data: Liquidity remains fragile with defensive positioning; options skew shows heavy puts near mid-80s and calls into 100k; elevated realized losses warn against chasing.
Expected impact: Technical bias stays Neutral Sell unless 96k is reclaimed; macro is a tailwind to hard assets but not yet strong enough to overrule HTF supply.
__________________________________________________________________________________
Key Takeaways
__________________________________________________________________________________
The market is in a corrective rebound into HTF supply.
- Trend: Broadly bearish on HTF while intraday momentum is positive into resistance.
- Setup: Fade 93k–96k on weakness; buy only confirmed dips at 84.6–82.6k or 80.6–79.7k.
- Macro: Hard-asset bid and disinflation help, but ETF outflows and thin liquidity argue for patience.
Stay nimble at the edges; wait for the market to show its hand at 93k–96k or on a quality drop into Cluster A.

BTC Playbook: 93k Pivot vs 98k Path__________________________________________________________________________________
Market Overview
__________________________________________________________________________________
Price is pressing into a well-defined 92,800–93,500 resistance band while macro leadership stays risk-off, making this a decision area. Momentum is rebuilding off 89k supports, but higher timeframes lean cautious until acceptance above 93,150.
Momentum: Bearish-to-neutral with a tactical counter-trend bounce; sustained strength needs a clean break-and-hold above 93,150.
Key levels:
- Resistances (HTF): 92,800–93,500 (240 Pivot High zone), 98,115 (W Pivot Low), 107,474 (D Pivot High)
- Supports (HTF/ITF): 90,500–90,800 (recent base), 89,012 (240 Pivot Low), 86,261 (240 Pivot Low)
Volumes: Moderate on 1D/12H; normal on intraday (6H/4H/2H/1H).
Multi-timeframe signals: 1D Up vs 12H/6H/4H/2H Down; intraday 1H Up but into HTF resistance. Defer to 12H Down unless 93,150 is accepted with persistence.
Harvest zones: 80,200 (Cluster A) / 76,600–77,100 (Cluster B) — ideal deep dip-buying areas for inverse pyramiding if market overreacts.
Risk On / Risk Off Indicator context: Neutral sell — confirms the cautious stance under resistance and argues for patience on longs.
__________________________________________________________________________________
Trading Playbook
__________________________________________________________________________________
The dominant read is neutral-sell into HTF resistance; adopt a reactive approach: fade failed breakouts, flip to long only on confirmed acceptance.
Global bias: Neutral-sell while below 93,150; bias flips constructive on ≥2H/4H acceptance above 93,150. Invalidation of the fade: sustained hold above 93,150.
Opportunities:
- Tactical sell: Fade 92,800–93,500 if 2H/4H prints rejection and volume fades; add on loss of 91,000 toward 89,012.
- Breakout buy: Engage on ≥2H/4H close above 93,150 with successful retest; first target 98,115.
- Reactive buy: Probe 89,012 only on strong reversal signal (≥2H) with improving volumes.
Risk zones / invalidations:
- Break below 89,012 would invalidate reactive longs and opens 86,261 risk.
- Sustained hold above 93,150 would invalidate shorts from the 92,800–93,500 fade zone.
Macro catalysts (Twitter, Perplexity, news):
- Liquidity tailwind: PBOC injections + equities <2% from ATH, but thin holiday liquidity can distort moves.
- ETFs: 7-day BTC spot ETF flows negative despite a small daily inflow — headwind near resistance.
- Rates: Elevated Fed cut odds support dips, but headline risks (stablecoins/geopolitics) can spark risk-off spikes.
Harvest Plan (Inverse Pyramid):
- Palier 1 (12.5%): 80,200 (Cluster A) + reversal ≥2H → entry
- Palier 2 (+12.5%): 75,400–77,000 (-6%/-4% below Palier 1) (Cluster B included) → reinforcement
- TP: 50% at +12–18% from PMP → recycle cash
- Runner: hold if break & hold first R HTF (93,150)
- Invalidation: < HTF Pivot Low (not provided) or 96h no momentum
- Hedge (1x): Short first R HTF (93,150) on rejection + bearish trend → neutralize below R
__________________________________________________________________________________
Multi-Timeframe Insights
__________________________________________________________________________________
Higher timeframes are mixed with 1D Up versus 12H Down; execution should respect the 12H filter until 93,150 is reclaimed with persistence.
12H/6H/4H/2H: Downtrend bias pressing into 92,800–93,500 supply; rejection here favors a rotation to 91,000 then 89,012. Acceptance and hold above 93,150 unlocks 98,115.
1D/1H: 1D Up but capped by 93,150; 1H Up is counter-trend into HTF resistance, so expect chop under 93k unless volume expands on breakout.
Confluences/divergences: Persistent HTF resistance at 93,150 aligns with risk-off macro; 1D strength is an exception that requires flow/volume confirmation to extend.
__________________________________________________________________________________
Macro & On-Chain Drivers
__________________________________________________________________________________
Macro is cautiously constructive on liquidity, but BTC-specific flows are not yet a tailwind, keeping technical resistance meaningful.
Macro events: PBOC liquidity injections aid risk; S&P 500 near ATH with thin US holiday liquidity; elevated cut odds into December create a soft landing narrative but headline risk persists.
Bitcoin analysis: BTC reclaimed 90k with negative/neutral funding; overhead supply 91.9–93k; ETF 7-day flows negative, dampening confidence at resistance.
On-chain data: Liquidity pockets discussed around low 80ks; heavy puts near mid-80ks; recovery impulses need stronger demand inflow and key cost-basis reclaims.
Expected impact: If ETF flows stabilize and price accepts above 93,150, path opens toward 98,115; otherwise the 92,800–93,500 zone favors tactical fades.
__________________________________________________________________________________
Key Takeaways
__________________________________________________________________________________
BTC is testing a critical resistance while macro risk-on is tentative and flow support is uneven.
- Trend: Neutral-to-bearish below 93,150; constructive only on confirmed acceptance above.
- Setup: Fade 92,800–93,500 rejections; switch long on ≥2H/4H hold above 93,150 targeting 98,115.
- Macro: ETF 7-day flows remain negative, capping conviction at resistance despite broader liquidity support.
Stay patient at the boss gate; wait for a clean unlock above 93,150 or harvest the rejection.

BTC Thanksgiving MapBTC walks into the Thanksgiving session strong: we’ve broken out of last week’s grind and are now holding above 90k after a clean impulse up. ETF flows have stopped bleeding, macro is slowly leaning toward 2025 cuts, but holiday liquidity is thin - moves can overshoot in both directions.
For today I treat 90–90.5k as the pivot.
Above it, I respect the breakout and look for continuation into 91.5–92k, with a possible extension into the 92–93k resistance band where I expect supply and will take profits.
If we lose 90k and start accepting below, I switch to defense and respect a mean-reversion into 89–89.5k, with a deeper flush possible toward 87–88k if sentiment sours.
One or two trades at these extremes are enough for me - I am not interested in chasing chop in the middle of the range. Map, not signal.

Bitcoin at 1D Floor: 86.5k Gate or 81.3k Retest__________________________________________________________________________________
Market Overview
__________________________________________________________________________________
Bitcoin is in a momentum drawdown after an extreme-volume flush, hovering around a 1D floor while macro risk remains tilted risk-off. Bounces are possible, but overhead supply is close and must be respected.
Momentum: Bearish with tactical bounce risk after capitulation-like selling; 12H trend is down while 1D is still up but contested.
Key levels:
- Resistances (HTF): 86,500 (4H–1D), 89,900–90,300 (12H–1D), 99,000–100,000 (1D/1W).
- Supports (HTF): 84,100–84,200 (1D floor), 81,300–81,600 (1H–12H cluster), 80,700 (30m floor).
Volumes: Very high on 2H–6H during the flush; moderate on 1D as the move cools.
Multi-timeframe signals: 12H/6H/4H/2H/1H are down; 1D uptrend is under pressure. Unless 86,500 is reclaimed, rallies likely fade into 86,500 and 89–90k.
Harvest zones: 84,100 (Cluster A) / 81,300–81,600 (Cluster B). These are ideal dip-buy areas for inverse pyramiding, prioritizing confirmed reversals on ≥2H.
Risk On / Risk Off Indicator context: Neutral sell bias; it confirms the risk-off tone and cautions against aggressive long exposure until HTF levels are reclaimed.
__________________________________________________________________________________
Trading Playbook
__________________________________________________________________________________
Adopt a cautious, tactical stance: trend is down on midframes, so buy only with confirmations at floors and sell into first resistances.
Global bias: Neutral sell while below 86,500; invalidation of the bearish bias on a clean reclaim/hold above 86,500.
Opportunities:
- Tactical buy on ≥2H reversal at 84,100 or 81,300–81,600; scale out into 85,200/86,500.
- Breakout buy only on 12H close and hold above 86,500 targeting 89,900–90,300.
- Tactical sell on rejection at 86,500 or 89,900–90,300 with rising volume.
Risk zones / invalidations:
- A sustained close below 81,300–81,600 would invalidate the dip-buy thesis and expose 80,700 then 78–76k.
- Acceptance above 86,500 invalidates near-term shorts and opens a squeeze toward ~90k.
Macro catalysts (Twitter, Perplexity, news):
- Fed tone eased (openness to cuts), but risk appetite has not recovered; supportive longer-term, not a near-term trigger.
- US spot BTC ETFs show persistent outflows; weak demand caps sustained rallies.
- PMIs and policy headlines may add volatility right at 84.1k/86.5k gates.
Harvest Plan (Inverse Pyramid):
- Palier 1 (12.5%): 84,100 (Cluster A) + reversal ≥2H → entry
- Palier 2 (+12.5%): 80,700–79,100 (-4/-6% below Palier 1) (Cluster B included)
- TP: 50% at +12–18% from PMP → recycle cash
- Runner: hold if break & hold first R HTF (86,500)
- Invalidation: < HTF Pivot Low 81,300 or 96h no momentum
- Hedge (1x): Short first R HTF (86,500) on rejection + bearish trend → neutralize below R
__________________________________________________________________________________
Multi-Timeframe Insights
__________________________________________________________________________________
MTFs are broadly aligned lower, with only the 1D still showing an up bias that is being tested.
12H/6H/4H/2H/1H/30m/15m: Downtrend with lower highs/lows; sellers defend 86,500 and 89–90k. Very high intraday volumes suggest reflex bounces, but structure remains corrective below 86,500.
1D: Up bias under pressure; price is hovering at the 1D ISPD floor near 84,100. A confirmed 1D/12H reversal at 84,100 or a deeper dip into 81,300–81,600 could stage a corrective bounce into 86,500.
Confluence: Multi-TF demand at 81,300–81,600 aligns with AGG ≈ 81,428; overhead supply at 86,500/90k frames a clean battlefield—treat 86,500 as the gatekeeper.
__________________________________________________________________________________
Macro & On-Chain Drivers
__________________________________________________________________________________
Macro easing in rates is being overshadowed by crypto-specific de-risking and weak ETF demand.
Macro events: Fed officials signaled openness to cuts and yields eased, but equities—especially tech/AI—remain under pressure; near-term tone stays risk-off to volatile.
Bitcoin analysis: ~$1.9B liquidations cleared late longs; key reclaim at 86,500 is needed to confirm a reflex rally. True Market Mean near ~81.9k sits just above the 81.3–81.6k demand cluster.
On-chain data: Weak spot ETF flows, reduced leverage, and defensive options skew imply cautious positioning; sustained sub-82k risks a deeper test toward 73.7k–76.5k.
Expected impact: Until 86,500 is reclaimed, macro/on-chain headwinds favor sells into strength and only tactical buys at defined floors with confirmation.
__________________________________________________________________________________
Key Takeaways
__________________________________________________________________________________
Market is in a bearish phase with tactical bounce potential at well-defined floors.
- Trend: Bearish on midframes; 1D up bias is fragile.
- Best setup: Confirmed ≥2H reversal at 84,100 or 81,300–81,600, then trim into 86,500.
- Macro: Weak ETF flows keep the risk-off tone in play despite easier rates.
Stay patient, let the levels come to you, and treat 86,500 as the gatekeeper for any sustained run.

BTC Playbook: Floors Defended, 93.8k Is the Gate__________________________________________________________________________________
Market Overview
__________________________________________________________________________________
Bitcoin is stabilizing after a swift drawdown, still trading beneath stacked HTF resistances while buyers defend key floors. The structure is corrective with risk-off macro leadership, so rallies face supply unless we reclaim a major pivot.
Momentum: Bearish-to-neutral drift with sell-the-rip behavior until a clean reclaim above 93,813 resets the tone.
Key levels:
- Resistances (HTF): 93,813 (2D pivot) / 95,000–96,000 / 97,000–98,000
- Supports (HTF): 91,500–90,500 (12H/1D floors) / 89,500 (2D pivot low) / 88,517–88,534 (2H/4H cluster)
Volumes: Moderate on 1D; bursts of very high volume recently on 12H/4H around S/R are acting as catalysts.
Multi-timeframe signals: 12H/6H/4H/2H remain Down while 1D is Up; bias stays tactical until 12H stabilizes, and 93,813 is the gate to shift momentum.
Harvest zones: 91,500 (Cluster A) / 88,517–88,534 (Cluster B) — prime dip-buy belts for inverse pyramiding with confirmation on ≥2H.
Risk On / Risk Off Indicator context: NEUTRE VENTE, confirming the corrective tone; treat dip-buys as tactical and demand stronger confirmation than usual.
__________________________________________________________________________________
Trading Playbook
__________________________________________________________________________________
The dominant trend is corrective; adopt a tactical stance, buying defended HTF floors with confirmation and fading weak bounces into resistance.
Global bias: Neutral Sell until 93,813 is reclaimed and held; invalidation of the dip-buy thesis if 88,500 breaks on a sustained close.
Opportunities:
- Buy: 90,456–91,496 retest with a ≥2H bullish reversal; target 93,813 then 95–96k.
- Breakout: 12H/1D break-and-hold above 93,813 opens 95–96k then 97–98k.
- Tactical sell: Fade rejections at 93,813 or 95–96k if volume expands and MTF trend stays Down.
Risk zones / invalidations: A daily/12H close below 90,456 risks a slide into 89,500 then 88,5k; failure at 88,5k exposes lower ladders.
Macro catalysts (Twitter, Perplexity, news):
- Nvidia beat lifted AI equities, but crypto bounce lagged; dollar strength capped risk appetite.
- Fed tone mixed; December cut odds priced lower, keeping near-term liquidity tighter.
- US spot ETF 7-day trend negative (Score F −6), muting long follow-through despite occasional positive daily prints.
Harvest Plan (Inverse Pyramid):
- Palier 1 (12.5%): 91,500 (Cluster A) + reversal ≥2H → entry
- Palier 2 (+12.5%): 86,000–87,800 (-4/-6% below Palier 1) (Cluster B included) → reinforcement
- TP: 50% at +12–18% from PMP → recycle cash
- Runner: hold if break & hold first R HTF (93,813)
- Invalidation: < HTF Pivot Low (89,500) or 96h no momentum
- Hedge (1x): Short first R HTF on rejection + bearish trend → neutralize below R
__________________________________________________________________________________
Multi-Timeframe Insights
__________________________________________________________________________________
HTFs are mixed: 1D stabilizing upward while 12H/6H/4H/2H remain in a controlled downtrend, keeping upside attempts contained by 93,813.
12H/6H/4H/2H/1H/30m: Downtrend with lower highs under 92–94k; best-quality demand sits at 88,517–88,534, with tactical support at 90,456–91,496 for reactive bounces.
1D/2D: 1D Up vs. 2D range; 2D Pivot Low at 89,500 anchors the mid-belt, while 2D Pivot High at 93,813 caps rallies; a decisive reclaim above 93,813 would align HTFs and release upside toward 95–98k.
Confluences/divergences: ISPD DIV shows tactical buy context on dips, but Risk On / Risk Off Indicator is NEUTRE VENTE; respect HTF floors, demand ≥2H–1D confirmation.
__________________________________________________________________________________
Macro & On-Chain Drivers
__________________________________________________________________________________
Macro risk is still in charge, with tighter rate-cut odds and a firm dollar weighing on crypto while ETFs/institutional bids help cushion extremes.
Macro events: Nvidia’s blowout earnings fueled AI equities; crypto lagged as the dollar firmed and the Fed’s mixed tone reduced near-term cut odds; BOJ normalization watch adds global rates volatility.
Bitcoin analysis: Structure printed 7-month lows; sellers defend 100k. Reclaiming 93,813 first, then 100k, is needed to reset trend toward the mid/high 90ks.
On-chain data: Weak spot demand, put-leaning options, falling OI; active-investor realized price near ~88.6k aligns with Cluster B (88,5k), bolstering demand quality there.
Expected impact: Macro tilt tempers breakouts; dip-buys at HTF floors remain viable if confirmed, with 93,813 as the main trigger to shift to offense.
__________________________________________________________________________________
Key Takeaways
__________________________________________________________________________________
BTC is in a corrective regime with tactical bids at HTF floors and strong caps overhead.
- Trend is neutral-to-bearish until 93,813 is reclaimed; range-to-down behavior favors confirmation-based entries.
- Highest-probability setup: buy confirmed reversals at 90,456–91,496 or 88,517–88,534, take profits into 93,813/95–96k, keep a runner only if 93,813 turns to support.
- Macro factor to watch: negative 7-day ETF trend and a firm USD dampen risk-on impulses.
Trade like a patient tactician: wait for clean confirmations at the floors and respect 93,813 as the gatekeeper.

BTC corrective map: cluster buys vs 95.7k supply__________________________________________________________________________________
Market Overview
__________________________________________________________________________________
BTC remains in a corrective phase just above 93k after a sequence of lower highs, sitting on stacked demand while overhead supply caps bounces. Momentum is cautious and event-driven; treat key zones like checkpoints in a tough dungeon.
Momentum: Bearish-to-neutral drift with sellers fading bounces under 95.7k; 1D holds uptrend but 12H remains down.
Key levels:
- Resistances (3D/1D/4H): 95,700 (3D), 98,300 (1D), 100,400 (4H pivot zone).
- Supports (1D/12H/2–6H/3D): 93,900 (12H–1D floors), 92,900–93,400 (Cluster A, 2H–6H), 90,950 (3D pivot low).
Volumes: Moderate overall; notable very high spikes on 15m selloffs.
Multi-timeframe signals: 1D Up vs 12H/6H/4H/2H Down; average trend Down. Longs are tactical until 12H flips Up and price reclaims 93,900.
Harvest zones: 93,400 (Cluster A) / 93,915–93,924 (Cluster B) — ideal dip-buy zones for inverse pyramiding when ≥2H reversal confirms.
Risk On / Risk Off Indicator context: Neutral sell — risk-off tilt that tempers long follow-through, aligning with the corrective momentum.
__________________________________________________________________________________
Trading Playbook
__________________________________________________________________________________
With a corrective regime and mixed MTF, stay tactical: favor reactive buying at defined demand with confirmation and fading into first HTF resistance.
Global bias: Neutral sell while below 93,900–95,700; invalidation of bearish bias on strong reclaim and hold above 98,300.
Opportunities:
- Tactical buy: 92,900–93,400 reaction (≥2H reversal) aiming 93,900 → 95,700.
- Breakout buy: Acceptance above 93,900 opens 95,700; continuation through 98,300 targets 100,400.
- Tactical sell: Fade 95,700 or 98,300 rejections back toward 93,900/93,200.
Risk zones / invalidations:
- A sustained close below 92,400 hands control to sellers; a break below 90,950 invalidates the long thesis and exposes lower supports.
Macro catalysts (Twitter, Perplexity, news):
- FOMC Minutes, US jobs, and NVDA earnings could drive acceptance/rejection around 93k clusters.
- ETF outflows act as a headwind to durable breakouts.
- ECB balanced tone, Japan tax/policy shifts constructive medium term but not immediate.
Harvest Plan (Inverse Pyramid):
- Palier 1 (12.5%): 93,400 (Cluster A) + reversal ≥2H → entry
- Palier 2 (+12.5%): 89,700–87,800 (-4/-6% below Palier 1)
- TP: 50% at +12–18% from PMP → recycle cash
- Runner: hold if break & hold first R HTF (95,700)
- Invalidation: < HTF Pivot Low (90,900) or 96h no momentum
- Hedge (1x): Short first R HTF (95,700) on rejection + bearish trend → neutralize below R
__________________________________________________________________________________
Multi-Timeframe Insights
__________________________________________________________________________________
Across timeframes, HTF support is dense near price, but LTFs lean down and supply is heavy overhead.
1D: Still Up structurally; sitting on higher-timeframe demand with 93,900 as the nearby reclaim that improves odds toward 95,700/98,300.
12H/6H/4H/2H: Downtrends intact; bounces sold below 95,700; key support cluster at 92,900–93,400 for potential reversals.
1H/30m/15m: Weak intraday structure with sell spikes; liquidity magnets at 92,900 and 91,100–91,300; need strong wick rejections for tactical longs.
Major confluence: ISPD Cluster A (92,900–93,400) over AGG ≈ price with 3D pivot low at 90,950 below; together they frame asymmetric long attempts if ≥2H confirms.
__________________________________________________________________________________
Macro & On-Chain Drivers
__________________________________________________________________________________
Macro is mixed-to-risk-off: ETF outflows, policy/event risk, and stronger USD tone cap upside until reclaimed levels prove persistence.
Macro events: FOMC Minutes, US labor data, and Flash PMIs set the near-term volatility path; NVDA earnings can sway risk appetite; ECB is balanced but flags correction risk; Japan’s tax/policy headlines constructive medium term.
Bitcoin analysis: Sub-100k/102k regime with 97,500–100,000 as key reclaim to improve structure; below 92,000 opens deeper supports cited by multiple desks.
On-chain data: Not provided; flows narrative leans risk-off via ETFs, dampening sustained rallies.
Expected impact: Event-driven two-way trade; until 97,500–100,000 is reclaimed, respect downside tails and use confirmed reactions at clusters.
__________________________________________________________________________________
Key Takeaways
__________________________________________________________________________________
BTC trades in a corrective environment with dense support beneath and strong supply above.
- Trend is neutral-to-bearish short term while 12H remains Down; 1D resilience allows tactical bounces if 93,900 is reclaimed.
- Best setup: Confirmed ≥2H reversal in 92,900–93,400, scale out at 93,900 → 95,700; fade 95,700/98,300 if rejection.
- Key macro factor: ETF outflows plus FOMC/Jobs/NVDA volatility may decide the next leg.
Stay patient, define risk at 90,900, and harvest volatility only on confirmed signals.

BTC at HTF Shelf: Execute Only on ≥2H Reversal__________________________________________________________________________________
Market Overview
__________________________________________________________________________________
Risk-off momentum drove Bitcoin into a dense multi-timeframe demand shelf, where price is probing for a reaction after losing 98k–100k. The next impulse likely comes from the battle around 95.8–95.9k and whether buyers can stage a clean reversal.
Momentum: Bearish drive into HTF demand; intraday trend remains down while daily is mixed-to-up in the background.
Key levels:
- Resistances (12H/1D): 97,300–98,200; 100,000; 101,600–103,000
- Supports (2H/4H/12H/1D): 95,820–95,920; 95,200–95,000; 92,000
Volumes: Very high on 12H and below (sell waves); normal on 1D — momentum is flow-driven, not a pure volume vacuum.
Multi-timeframe signals: 12H/6H/4H/2H/1H downtrends; 1D uptrend — execution should respect 12H Down unless ≥2H prints a confirmed reversal at 95.8–95.9k.
Harvest zones: 95,900 (Cluster A) / 95,000–95,200 (Cluster B) — ideal dip-buy zones for inverse pyramiding if a ≥2H reversal confirms.
Risk On / Risk Off Indicator context: Neutral Sell — confirms the risk-off push and argues for patience on longs unless the cluster defends with real follow-through.
__________________________________________________________________________________
Trading Playbook
__________________________________________________________________________________
We operate in a corrective, risk-off tape pressing into HTF demand; take a tactical stance and let ≥2H confirmation lead.
Global bias: Neutral Sell while under 98,000–100,000; key invalidation for shorts = reclaim and close above 98,000 with follow-through.
Opportunities:
- Buy: Only on a ≥2H bullish reversal from 95,800–95,900; target 96,600–97,000 then 97,800–98,200.
- Breakout: Reclaim >98,000 with momentum → ride into 100,000 then 101,600–103,000.
- Tactical sell: Fade failed retests at 97,800–98,200 or a ≥2H close below 95,800 with a failed retest.
Risk zones / invalidations: A sustained ≥2H close below 95,800 would invalidate the bounce idea and open 95,200–95,000, then 92,000.
Macro catalysts (Twitter, Perplexity, news): Heavy spot ETF outflows reinforce risk-off; global equities in broad risk-off; upcoming FOMC/CPI could shift dollar/liquidity and the crypto beta.
Harvest Plan (Inverse Pyramid):
- Palier 1 (12.5%): 95,900 (Cluster A) + reversal ≥2H → entry
- Palier 2 (+12.5%): 92,100–90,100 (-4/-6% below Palier 1)
- TP: 50% at +12–18% from PMP → recycle cash
- Runner: hold if break & hold first R HTF (97,800–98,200 zone)
- Invalidation: < HTF Pivot Low 95,000 or 96h no momentum
- Hedge (1x): Short first R HTF on rejection (97,800–98,200) + bearish trend → neutralize below R
__________________________________________________________________________________
Multi-Timeframe Insights
__________________________________________________________________________________
HTF uptrend (1D) conflicts with intraday downtrends, placing the burden of proof on buyers at the 95.8–95.9k shelf.
12H/6H/4H/2H/1H/30m/15m: Downtrends with very high sell-side volume; repeated tests of 95.8–95.9k raise risk of a flush if it fails, while failed breakdowns can spring sharp squeezes into 97.3–98.2k.
1D: Still up but losing momentum; the 95.8–96.0k cluster aligns with multiple prior pivot lows — a defendable shelf if buyers print a clean reversal and reclaim 97.8–98.2k.
Divergences/confluences: ISPD DIV = BUY at the cluster while Risk On / Risk Off Indicator = Neutral Sell — confluence for reactive bounces only, not blind catching; wait for ≥2H confirmation.
__________________________________________________________________________________
Macro & On-Chain Drivers
__________________________________________________________________________________
Macro risk-off and ETF outflows pressure BTC; the path hinges on whether flows stabilize and the 95.8–95.9k shelf holds.
Macro events: Global equities are risk-off; energy/geopolitics keep volatility elevated; upcoming FOMC/CPI loom as catalysts that can swing liquidity and risk appetite.
Bitcoin analysis: Breakdown below 100k with a six-month low near ~97k; weekly close vs ~101k is pivotal. Heavy ETF outflows and liquidations weigh unless key resistances are reclaimed.
On-chain data: Long-term holders have been distributing, but sellers show signs of exhaustion — a setup for relief if flows stabilize and levels reclaim.
Expected impact: If the shelf holds and outflows cool, a relief bounce toward 97.8–98.2k and 100k is likely; otherwise, a clean failure risks 95.0k then 92k.
__________________________________________________________________________________
Key Takeaways
__________________________________________________________________________________
We are in a corrective, high-volatility test of a dense demand cluster.
- Trend: Intraday bearish within a mixed HTF context; respect 12H Down unless ≥2H prints a clean reversal.
- Best setup: Reactive long only on a ≥2H reversal at 95.8–95.9k; otherwise fade failed retests at 97.8–98.2k.
- Macro factor: ETF outflows are the main headwind; watch FOMC/CPI for a regime nudge.
Stay patient, let the shelf prove itself, and treat each move like a boss fight — confirm the phase before committing.
BTC Range Grind: Floors to Harvest, 103.5k Cap__________________________________________________________________________________
Market Overview
__________________________________________________________________________________
Bulls defend a mid-range after a corrective leg, with price trapped under 103,500–105,000 supply and resting atop 101,700–100,400 HTF floors. Momentum is mixed intraday but the higher-timeframe trend still leans up.
Momentum: Slightly bearish intraday within an HTF uptrend; range behavior below 103,500–105,000.
Key levels:
- Resistances (HTF): 103,500 (pivot high); 104,800–105,000 (supply shelf); 106,400–106,900 (upper supply).
- Supports (HTF): 101,700 (1D floor); 100,400 (12H floor); 98,400–99,100 (multi‑TF demand cluster).
Volumes: Mostly normal; occasional moderate spikes on 1H/30m around tests of 101,700 and 103,100–103,600.
Multi-timeframe signals: 1D/12H Up; 6H/4H/2H/1H Down. This favors buying confirmed dips into 101,700/100,400 while avoiding chases into 103,500–105,000 unless reclaimed on strength.
Harvest zones: 100,400 (Cluster A) / 98,400–99,100 (Cluster B). These are ideal dip-buy zones for inverse pyramiding with confirmation.
Risk On / Risk Off Indicator context: NEUTRE VENTE (risk-off tilt). It tempers long conviction and asks for confirmation, aligning with the intraday pullback despite the HTF up-bias.
__________________________________________________________________________________
Trading Playbook
__________________________________________________________________________________
The dominant structure is a range inside an HTF uptrend; adopt a buy‑the‑dip stance at HTF floors with strict confirmations and reduced size given a risk-off backdrop.
Global bias: Neutral Buy while above 100,400–101,700; key invalidation = sustained 12H close below 100,400.
Opportunities:
- Buy the dip: Confirmed 2H/4H reversal at 101,700 or 100,400 toward 103,500.
- Breakout buy: Reclaim and hold above 103,500 on 1H/2H opens 104,800–105,000.
- Tactical sell: Clean rejection at 103,500–105,000 if 2H/4H trend remains Down and breadth weak.
Risk zones / invalidations: A 12H close below 100,400 would invalidate the dip-bid and expose the 98,400–99,100 cluster; acceptance below 100k risks a deeper slide.
Macro catalysts (Twitter, Perplexity, news):
- US government reopening vote may unlock risk appetite short term.
- Fed tone: cuts discussed; reserves near “ample” and QT wind‑down—liquidity supportive but lumpy.
- CPI print can flip the tone and break the 103,500/100,400 range.
Harvest Plan (Inverse Pyramid):
- Palier 1 (12.5%): 100,400 (Cluster A) + reversal ≥2H → entry
- Palier 2 (+12.5%): 96,400–94,400 (-4/-6% below Palier 1) → reinforcement
- TP: 50% at +12–18% from PMP → recycle cash
- Runner: hold if break & hold first R HTF (103,500)
- Invalidation: < HTF Pivot Low 100,400 or 96h no momentum
- Hedge (1x): Short first R HTF (103,500) on rejection + bearish trend → neutralize below R
__________________________________________________________________________________
Multi-Timeframe Insights
__________________________________________________________________________________
Across timeframes, HTF structure remains constructive while intraday trends lean lower, creating buy-the-dip opportunities into defined floors.
1D/12H: Uptrend intact; price capped by 103,500–105,000 supply with key demand at 101,700 and 100,400. A daily/12H bullish close off these floors keeps the path open to 103,500 then 104,800–105,000.
6H/4H/2H: Down within range; prefer long confirmations at 101,700/100,400; short bounces only if sell volume expands and 2H/4H momentum stays Down.
1H/30m/15m: Micro down-to-sideways; frequent wicks under 103,100–103,600. Use only as execution layers aligned with HTF signals.
Major confluence: Strong overlap of HTF floors at 100,400–101,700 versus a persistent supply cap at 103,500–105,000; macro risk-off explains the intraday pressure despite HTF Up.
__________________________________________________________________________________
Macro & On-Chain Drivers
__________________________________________________________________________________
Macro liquidity is tentatively supportive, but the current risk regime is cautious; together they favor selective dip-buys rather than break-chasing.
Macro events: A potential US government reopening, dovish-leaning Fed messaging (cuts discussed; reserves near “ample”; QT wind‑down), and CPI as a near-term risk event that can swing risk appetite.
Bitcoin analysis: Price hovering above 100k with signs of seller fatigue; a large short-liquidity pocket is noted above, implying squeeze potential if spot bids return and 103,500 is reclaimed.
On-chain data: Stablecoin mints (USDC/PYUSD) point to improving on-chain dollar liquidity; range bias near ~100k with dense supply 106k–118k supports the current capped-range picture.
Expected impact: While HTF structure supports buying confirmed dips, the risk-off regime argues for patience and confirmation; a reclaim of 103,500 could quickly target 104,800–105,000, with squeeze risk if flows improve.
__________________________________________________________________________________
Key Takeaways
__________________________________________________________________________________
BTC is in a range beneath 103,500–105,000 while HTF demand at 101,700/100,400 continues to attract bids.
- Trend: Neutral within an HTF uptrend; intraday pressure persists under supply.
- Setup: Primary is a confirmed dip-buy at 101,700 or 100,400, with a secondary breakout buy on strong hold above 103,500.
- Macro: Dovish Fed tone and a potential US reopening help, but CPI and a risk-off regime demand discipline.
Stay patient at floors, avoid chasing into supply, and let confirmation do the heavy lifting—just like timing a boss window in a tough raid.

BTC Playbook: Buy Floors, Fade 104k Until Confirmed__________________________________________________________________________________
Market Overview
__________________________________________________________________________________
Bitcoin faded from 104k and is cycling back into layered demand near 100.4k, with higher timeframes still constructive while intraday pressure and a risk‑off overlay dominate.
Momentum: Range with downside skew after a sharp 104k rejection and tests of 100,409 and the 99k pocket.
Key levels:
- Resistances (HTF): 102,900–103,300; 103,900–104,050; 105,600–106,000
- Supports (HTF): 100,409; 99,490; 98,760–98,944
Volumes: Very high on intraday (30m–2H); normal on 1D.
Multi-timeframe signals: 1D/12H Up; 6H/4H/2H/1H Down. HTF structure stays constructive, but LTF pressure and the risk‑off overlay cap bounces into 104k–106k.
Harvest zones: 100,400 (Cluster A) / 98,800–98,900 (Cluster B) — ideal dip‑buying areas for inverse pyramiding with confirmation.
Risk On / Risk Off Indicator context: Neutral sell bias; it currently contradicts the HTF Up filter, so treat bounces as tactical until it flips.
__________________________________________________________________________________
Trading Playbook
__________________________________________________________________________________
The dominant posture is tactical: buy confirmed dips into floors and fade weak tests of overhead supply while the macro overlay stays risk‑off.
Global bias: Cautious long into floors while HTF trend is Up; invalidate the dip‑buy thesis on sustained closes below 98,760.
Opportunities:
- Buy: Reactive long at 100,409 or 99,490–98,760/98,944 on a ≥2H bullish close; targets 102,000 then 104,045; risk below the engaged floor.
- Breakout: Acceptance above 104,045 with rising volume → add toward 105,600–106,000.
- Tactical sell: Fade 103,900–104,050 or 105,600–106,000 if rejected and Risk On / Risk Off stays neutral‑sell.
Risk zones / invalidations: Loss and acceptance below 99,490 opens 98,760; daily acceptance below 98,760 invalidates dip‑buying until reclaimed. Acceptance above 106,000 invalidates shorts.
Macro catalysts (Twitter, Perplexity, news): Fed liquidity rhetoric turning supportive; CPI/UST auctions can swing risk; geopolitical overhang keeps the risk tone fragile. Strong daily ETF inflows recently help spot demand but need persistence.
Harvest Plan (Inverse Pyramid):
- Palier 1 (12.5%): 100,400 (Cluster A) + reversal ≥2H → entry
- Palier 2 (+12.5%): 96,400–94,400 (-4/-6% below Palier 1) → reinforcement
- TP: 50% at +12–18% from PMP → recycle cash
- Runner: hold if break & hold first R HTF (103,900–104,050)
- Invalidation: < HTF Pivot Low 99,800 or 96h no momentum
- Hedge (1x): Short first R HTF on rejection + bearish trend → neutralize below R
__________________________________________________________________________________
Multi-Timeframe Insights
__________________________________________________________________________________
Overall, HTF remains constructive while LTFs are in a corrective downswing pressing demand steps.
1D/12H: Uptrend filter intact; price rotating back into 100,409 and the 99k ladder; acceptance back above 104,045 would re‑open 105,600–106,000.
6H/4H: Down within HTF Up; clean lower‑highs from 105k with buyers defending 99,490 and the 98,760–98,944 cluster; look for reversal signals there.
2H/1H/30m/15m: Down with very high sell volume; squeezes likely if 100,409 is reclaimed swiftly; failure risks a stop‑run into 99,490 → 98,8k.
Major confluence: Tight demand at 98,760–98,944 aligns with aggregate value; 100,409 is the line‑in‑the‑sand; 104,045 is the primary trigger above.
__________________________________________________________________________________
Macro & On-Chain Drivers
__________________________________________________________________________________
Macro liquidity tone is turning supportive, but near‑term event risk and a risk‑off equity regime keep the overlay defensive.
Macro events: Fed officials flagged reserves nearing “ample” and a technical easing bias; CPI and UST auctions can jolt risk; geopolitics maintains a risk premium.
Bitcoin analysis: Strongest daily US spot ETF net inflows in a month aided spot demand, while a derivatives long flush reset froth; 104k is the overhead decision zone; 100,409 and 99k are key defenses.
On-chain data: Short‑Term Holder stress and seller‑exhaustion reads favor reflex bounces near 100k; structurally, a durable reclaim above prior highs remains unconfirmed.
Expected impact: If ETF flows persist and CPI doesn’t shock, acceptance above 104,045 tilts the path toward 105,600–106,000; if 100,409 fails, a run into 99,490 → 98,8k is likely before stronger dip‑bids.
__________________________________________________________________________________
Key Takeaways
__________________________________________________________________________________
BTC is rotating within a range under 104k, pressing two‑step demand around 100.4k and 99k.
- Trend: Neutral with downside pressure while Risk On / Risk Off stays neutral‑sell.
- Setup: Buy confirmed dips at 100,409 and 99,490–98,760/98,944; add on 104,045 acceptance.
- Macro: Fed liquidity tone helps, but CPI and geopolitics can flip the tape quickly.
Stay patient, define risk at the floors, and let the market hand you the next move rather than forcing one.

BTC Rebound Into HTF Supply: Harvest Zones Mapped__________________________________________________________________________________
Market Overview
__________________________________________________________________________________
Bitcoin is rebounding from last week’s drawdown but is pressing directly into stacked higher-timeframe supply. Structure remains mixed: short-term strength versus a 12H downtrend and a neutral-sell macro backdrop.
Momentum: Cautious rebound within a broader mixed trend; rallies face HTF supply near 106,900–107,300.
Key levels:
- Resistances (HTF): 106,900–107,300; 108,700–109,700; 110,400–111,700
- Supports (HTF/LTF): 105,200–105,600 (tactical); 100,100–100,400 (2H/12H floors); 99,150–99,280 (4H/6H cluster)
Volumes: Overall normal to moderate; notable spikes occurred on lower timeframes during the reversal.
Multi-timeframe signals: 1D up, 12H down; 6H/4H/2H down; 1H/30m/15m up. Short-term momentum is improving but runs into HTF pivot-high bands.
Harvest zones: 100,200 (Cluster A) / 99,100–99,300 (Cluster B) — ideal dip-buy zones for inverse pyramiding if momentum confirms.
Risk On / Risk Off Indicator context: NEUTRE VENTE; it tempers the rebound and argues for selectivity and confirmation before longs.
__________________________________________________________________________________
Trading Playbook
__________________________________________________________________________________
The dominant context is a corrective rebound into resistance; adopt a patient, confirmation-first stance.
Global bias: Neutral sell while below 106,900–107,300; invalidation if price reclaims and holds above 107,300 on a 4H–1D basis.
Opportunities:
- Buy-the-dip: 100,100–100,400 with ≥2H bullish reversal; scale only on improving 12H momentum.
- Breakout buy: 4H close and retest-hold above 107,300 opens 108,700–109,700.
- Tactical sell: Fade 106,900–107,300 rejection (2H–4H confirmation), targeting 105,600 then 104,800–105,000.
Risk zones / invalidations:
- Break below 100,100 would invalidate the shallow-dip long and open a test of ~99,200.
- Sustained closes below ~99,100 risk a larger leg down and shift bias bearish.
Macro catalysts (Twitter, Perplexity, news):
- US CPI print and UST 10Y/30Y auctions may move yields and crypto liquidity.
- Government shutdown resolution headlines improved risk appetite, but durability is unproven.
- Fed cut 25bp with QT set to end Dec 1; guidance remains cautious.
Harvest Plan (Inverse Pyramid):
- Palier 1 (12.5%): 100,200 (Cluster A) + reversal ≥2H → entry
- Palier 2 (+12.5%): 94,200–96,200 (-6%/-4% below Palier 1)
- TP: 50% at +12–18% from PMP → recycle cash
- Runner: hold if break & hold first R HTF (106,900–107,300)
- Invalidation: < HTF Pivot Low (not provided) or 96h no momentum
- Hedge (1x): Short first R HTF on rejection + bearish trend → neutralize below R
__________________________________________________________________________________
Multi-Timeframe Insights
__________________________________________________________________________________
Higher timeframes are mixed but lean down on 12H, while intraday frames have turned up into overhead supply.
1D: Uptrend attempt, but price is still below key pivot-high bands; needs a clean reclaim above 107,300 to unlock higher liquidity.
12H/6H/4H/2H: Down or corrective; rallies into 106,900–107,300 and 108,700–109,700 require proof. 100,100–100,400 is the prime reaction zone; 99,150–99,280 is the deeper defense.
1H/30m/15m: Up and constructive, forming higher lows into resistance; best risk-reward comes from confirmed dips, not late chases into supply.
Major confluence: Tight HTF demand clusters at 100–99k align with the neutral-sell macro regime, reinforcing patience and precision.
__________________________________________________________________________________
Macro & On-Chain Drivers
__________________________________________________________________________________
Macro is balanced-to-cautious and can swing intraday liquidity, while on-chain remains defensive.
Macro events: CPI and UST auctions are near-term volatility catalysts; shutdown resolution headlines boosted risk appetite; the Fed’s 25bp cut with QT ending Dec 1 keeps policy in a “modestly easier but cautious” lane.
Bitcoin analysis: Reclaimed above 105k with key resistance 110–111k; largest overhead liquidity at 112–117k leaves squeeze potential if reclaimed; below, the CME gap near 104,160 is a magnet on weakness.
On-chain data: Price below STH cost basis with continued LTH distribution and defensive options skew — a fragile equilibrium needing a firm reclaim above 112–113k for validation.
Expected impact: Until 107,300+ is reclaimed, macro/on-chain caution aligns with a conservative, buy-the-dip-or-breakout approach; upside fuel exists above 110–111k if catalysts cooperate.
__________________________________________________________________________________
Key Takeaways
__________________________________________________________________________________
BTC is attempting a rebound into heavy resistance with a neutral-sell macro tone.
- Trend: Neutral with a bearish lean on 12H; short-term uptrends are pressing into HTF supply.
- Best setup: Confirmed dip-buys at 100,100–100,400, or a 4H reclaim/hold above 107,300 for a squeeze toward 108,700–109,700.
- Macro factor: CPI and UST auctions may drive liquidity and mark-to-market risk.
Stay disciplined: wait for the signal at the floors or the clean reclaim above resistance — don’t get caught mid-raid in the fog.

Bitcoin Playbook: Neutral‑Sell Below 106.5k, Buy Floors__________________________________________________________________________________
Market Overview
__________________________________________________________________________________
Price is compressing beneath overhead supply as a rebound from sub‑$100k meets the 2H/1D resistance shelf. Momentum is tactically capped unless 104.8k converts to support; dips into HTF floors remain the higher‑quality rotations.
Momentum: Cautiously bearish tilt (range‑within‑compression) as bounces probe 104.8k supply while 12H/6H trends point down.
Key levels:
- Resistances (2H/1D/HTF): 104,845 (2H pivot) • 106,460 (1D pivot high) • 111,577 (HTF band)
- Supports (1D/12H/4H–6H): 101,550–100,395 (near‑cluster) • 99,241–99,396 (tight 4H/6H cluster) • 98,243 (weekly pivot low)
Volumes: Normal overall; 12H shows moderate spikes only as an amplifier near key levels.
Multi-timeframe signals: 1D = Up vs 12H/6H/4H/2H = Down; structure favors fading 104.8k–106.5k unless 2H/1D acceptance prints. Longs are higher quality on 101.6k–100.4k reactions with ≥2H confirmation.
Harvest zones: 99,300 (Cluster A) / 96,800–97,300 (Cluster B). Ideal dip‑buy areas for inverse pyramiding with confirmation, using Cluster A as the initial anchor.
Risk On / Risk Off Indicator context: Neutral sell bias; this risk‑off tilt confirms the preference to sell rallies into resistance and be selective on dips.
__________________________________________________________________________________
Trading Playbook
__________________________________________________________________________________
The dominant stance is neutral‑sell while price sits under 104.8k–106.5k; lean short into supply and buy only confirmed HTF floors.
Global bias: Neutral‑sell below 106,460; upside bias resumes only on daily acceptance above 106,460.
Opportunities:
- Tactical sell: Fade 104,845 on rejection with 15m–2H confirmation; target 103,500 then 101,550–100,395.
- Tactical buy: Sweep/reclaim 101,550–100,395 with ≥2H bullish close; target 104,845 then 106,460.
- Breakout buy: Reclaim/hold above 104,845 on 1H–2H and buy the successful retest toward 106,460.
Risk zones / invalidations:
- Break and daily hold above 106,460 would invalidate near‑term shorts and unlock higher.
- Sustained closes below 100,395 would invalidate tactical longs and expose the 99.4k cluster or worse.
Macro catalysts (Twitter, Perplexity, news):
- Easier funding backdrop (lower SOFR/MOVE) supports risk but remains conditional.
- Potential US shutdown resolution and policy chatter on leveraged spot crypto trading = headline volatility risk.
- Fed cut with a hawkish tone keeps cross‑asset risk mixed; wait for confirmations at levels.
Harvest Plan (Inverse Pyramid):
- Palier 1 (12.5%): 99,300 (Cluster A) + reversal ≥2H → entry
- Palier 2 (+12.5%): 95,300–93,300 (-4/-6% below Palier 1)
- TP: 50% at +12–18% from PMP → recycle cash
- Runner: hold if break & hold first R HTF (104,845)
- Invalidation: < HTF Pivot Low or 96h no momentum
- Hedge (1x): Short first R HTF on rejection + bearish trend → neutralize below R
__________________________________________________________________________________
Multi-Timeframe Insights
__________________________________________________________________________________
Across TFs, growth impulses are capped by 104.8k–106.5k while high‑quality demand sits at 101.6k–100.4k and 99.4k.
1D: Uptrend attempt but still beneath 106,460; acceptance above that level would open room to unwind the HTF supply.
12H/6H/4H: Downtrend bias; current leg is a rally into 104,845 resistance. Failure here typically rotates price back into 101,550–100,395, with 99,241–99,396 as secondary demand.
2H/1H/30m/15m: Execution battleground at 104,845; LTF momentum can trap unless 104,845 flips to support. Look for wick rejections at resistance or strong reclaim signals at HTF floors.
Major divergence: 1D Up vs 12H Down keeps conviction muted; trade level‑to‑level with confirmation.
__________________________________________________________________________________
Macro & On-Chain Drivers
__________________________________________________________________________________
Macro is cautiously supportive via easier funding but headline‑driven; crypto policy chatter could catalyze volatility around range edges.
Macro events: Lower SOFR/MOVE ease financial conditions, but a potential US shutdown resolution and ongoing Fed communication keep risk skittish; volatility pockets likely around key data and policy headlines.
Bitcoin analysis: Price coiling in a ~$98k–$108k window; topside requires 104k+ acceptance, while loss of 98.5k would degrade structure. HTF floors align with the technical buy zones.
On-chain data: Mixed signals and sporadic supply awakenings; no decisive impulse, reinforcing the need to trade from well‑defined levels.
Expected impact: Macro/on‑chain are not overriding; they reinforce a neutral‑sell technical bias and level‑driven executions.
__________________________________________________________________________________
Key Takeaways
__________________________________________________________________________________
BTC is compressing under resistance with a risk‑off tilt; patience at levels remains the edge.
- Trend: Neutral with bearish lean until 104,845 flips and 106,460 holds.
- Best setup: Fade 104,845 rejections; buy only confirmed reactions at 101,550–100,395 and, if needed, 99,241–99,396.
- Macro: Easier funding helps, but policy headlines can quickly shift tone.
Stay disciplined: harvest volatility at the edges and let confirmation lead, not anticipation.

BTC 96k Deep Run or Wipe?__________________________________________________________________________________
Market Overview
__________________________________________________________________________________
BTC is stabilizing near 100k after a high-volume flush, sitting on a dense 12H/1D demand cluster. HTF trend is intact while the “Risk On / Risk Off Indicator” keeps a lid on breakouts.
Momentum: Neutral-bullish 📈 on 1D/12H, intraday pressure; buy-the-dip with confirmation.
Key levels:
- Resistances (HTF): 101,800–102,200 (multi-TF), 104,645 (12H), 106,500–106,700 (1D)
- Supports (HTF): 100,412–100,446 (1D/12H), 99,568–99,751 (6H/4H), 98,762 (1W)
Volumes: Normal on 1D; extreme flush on 6H during the drop.
Multi-timeframe signals: 1D/12H = Up, 6H stabilizing, 4H/2H/1H = Down; 100.41–100.45k and 99.57–99.75k floors frame risk while 101.8–102.2k caps bounces.
Farming zones 🎮: 100,400 (Cluster A) / 99,600–99,800 (Cluster B) — prime drop-in loot spots for inverse pyramiding.
Risk On / Risk Off Indicator: NEUTRAL SELL — caps momentum; demand ≥2H confirmation on entries.
__________________________________________________________________________________
Trading Playbook
__________________________________________________________________________________
Strategic stance: HTF uptrend under macro overwatch; prioritize confirmed, sized extraction runs.
Global bias: NEUTRAL BUY above clusters; key invalidation below weekly pivot ~98,800.
Opportunities:
- 🎮 Drop-in buy: wicks/reversal ≥2H at 100.41–100.45k, extract toward 101.8–102.2k.
- ⚔️ Hedge cover: short 101.8–102.2k on clean rejection + persistent risk-off.
- 💰 Runner exfil: hold a slice if 101.8–102.2k breaks & holds, target 104.6k.
Risk zones / invalidations: Break and hold < 99.57k unlocks 98.76k/98.5–99.0k; time-fail (1–2 bars of exec TF) voids the run.
Macro catalysts (Twitter, Perplexity, news):
- Fed reserve-management pivot/end of QT → liquidity supportive, not yet outright risk-on.
- US spot ETFs: 7d avg negative → headwind to sustained upside.
- Tech/AI softness + softer oil → disinflation tailwind but risk-off in equities restrains crypto.
Extraction Run (Inverse Pyramid) 🎮:
- Drop-in (12.5%): 100,400 (Cluster A) + reversal ≥2H → first loot entry
- Deep run (+12.5%): 96,400–94,400 (-4/-6% below Drop-in) → reinforcement under fire
- Extract: 50% at +12–18% from PMP → exfil & recycle cash 💰
- Runner: hold if break & hold first R HTF (101,800–102,200) → bonus loot exfil
- Invalidation: < HTF Pivot Low (~98,800) or 96h no momentum → run wiped 🛑
- Cover (1x): Short first R HTF (101,800–102,200) on rejection + bearish trend → sniper extraction cover
__________________________________________________________________________________
Multi-Timeframe Insights
__________________________________________________________________________________
HTFs hold the line while intraday stays pressured; ISPD floors define the loot clusters.
1D/12H: Uptrend, basing on ISPD floor 100,412–100,446 (ISPD = loot cluster). Clean reclaim of 101.8–102.2k opens 104.6k.
6H: Down stabilizing; absorption above 99.6–99.8k (Cluster B). Watch rejections at 102.2k/103.3k.
4H/2H/1H/30m/15m: Structural Down, bounces sold under 101.8–102.2k; best triggers = sweeps + bullish closes ≥2H at Clusters A/B.
Major confluence/divergence: Very high 6H flush volume + HTF floor holds = tactical long confluence, tempered by persistent risk-off.
__________________________________________________________________________________
Macro & On-Chain Drivers
__________________________________________________________________________________
Central liquidity improves at the margin, but crypto-specific flows are mixed, keeping BTC in tactical extraction mode.
Macro events: Fed signaling reserve-management pivot (end of QT) and rising bank reserves — supportive backdrop; Tech/AI weakness and policy noise keep risk-off in play; softer oil adds disinflation.
Bitcoin analysis: Spot ETFs steady on the day but 7d avg negative; on-chain OG distribution + some exchange inflows cap upside. Key zones: hold 100k, reclaim 101.8–102.2k, then 104.6k.
On-chain data: Below STH cost (~112.5k); LTH distribution; defensive options near 100k — orderly correction regime.
Expected impact: Maintain NEUTRAL BUY extraction bias while 100k/Cluster B hold; need ETF avg to flip and risk-on tone to sustain a breakout.
__________________________________________________________________________________
Key Takeaways
__________________________________________________________________________________
EXTRACTION DEBRIEF
BTC coils in a high-stakes range — farm or fade?
🎮 Drop-in live at 100,400 (Cluster A) — reversal ≥2H → first loot
💰 Deep run to 96k if under fire — pyramid or perish
🛑 Wipe below 98,800 — HTF Pivot Low = game over
ETF sniper headwind, but Fed liquidity tilt = exfil chopper?
Ready for the deep run?

100k at stake: multi‑TF game plan__________________________________________________________________________________
Market Overview
__________________________________________________________________________________
BTC is in a corrective downswing but sits on a dense demand cluster near 100k; a bounce is possible if a real ≥2H/4H reversal prints. Macro remains risk‑off, so stick to confirmed, measured entries.
Momentum: 📉 Mildly bearish intraday, grinding around 100k with lower highs/lows; rebound depends on a ≥2H/4H trigger.
Key levels:
- Resistances (HTF/LTF): 101,650–102,850 (LTF), 103,450–104,550 (HTF), 105,450 (HTF cap).
- Supports (HTF): 99,700–100,500 (multi‑TF ISPD cluster), 98,350–98,950 (HTF shelf), 97,900 (2H floor).
Volumes: Very High on the 6H sell leg; otherwise normal to moderate by TF.
Multi-timeframe signals: 1D/12H filter Up vs 6H/4H/2H Down — binary area at 99.7k–100.5k; confirmed reversal can target 101.6k–103.5k, failure risks 98.3k–97.9k.
Harvest zones: 100,500 (Cluster A) / 99,600–99,900 (Cluster B) → ideal dip‑buy zones for inverse pyramiding, only on clear rejection and ≥2H close.
Risk On / Risk Off Indicator context: NEUTRAL SELL — aligns with a macro headwind despite buyer cluster proximity.
__________________________________________________________________________________
Trading Playbook
__________________________________________________________________________________
Strategic stance: HTF corrective structure with a major support at 99.7k–100.5k; favor tactical longs only on confirmed ≥2H/4H signals.
Global bias: NEUTRAL SELL bias with selective long attempts on confirmation; key long invalidation: 12H/1D close < 99,700.
Opportunities:
- Tactical buy: Wick rejection + bullish 2H/4H close off 99.7k–100.5k; add above 100,950/101,650.
- Breakout: Reclaim 102,850 then 103,450–104,550 with confirmation → aim 105,450.
- Tactical sell: Firm rejection at 103,450–104,550 with volume → target 101,650 then 100,000.
Risk zones / invalidations:
- Break below 99,700 opens 98,350–98,950 then 97,900.
- Close > 105,450 invalidates tactical shorts and shifts risk higher.
Macro catalysts (Twitter, Perplexity, news):
- Fed: 25 bp cut and end of balance sheet runoff → higher vol, fuzzy guidance.
- US spot ETF flows: persistent outflows streak → macro risk‑off headwind to bounces.
- Elevated geopolitics (Ukraine/Middle East) → headline risk; demand confirmation.
Harvest Plan (Inverse Pyramid):
- Palier 1 (12.5%): 100,500 (Cluster A) + reversal ≥2H → entry
- Palier 2 (+12.5%): 96,500–94,500 (-4/-6% below Palier 1)
- TP: 50% at +12–18% from PMP → recycle cash
- Runner: hold if break & hold first R HTF (103,450–104,550)
- Invalidation: < HTF Pivot Low (98,900) or 96h no momentum
- Hedge (1x): Short first R HTF (103,450–104,550) on rejection + bearish trend → neutralize below R
__________________________________________________________________________________
Multi-Timeframe Insights
__________________________________________________________________________________
Overall, HTFs remain constructively poised while LTFs are still pressured into the cluster.
1D/12H: Up filter but price compressed above 99.7k–100.5k; a ≥2H/4H reversal can extend toward 101,650–103,450.
6H/4H/2H/1H/30m/15m: Intraday downtrends with lower highs; 6H Very High sell volume → need clear absorption at the cluster to flip.
Major divergences/confluences: Strong multi‑TF ISPD floors + HTF shelf 98.35k–98.95k beneath; conflict with risk‑off backdrop → require strong confirmation before sizing up.
__________________________________________________________________________________
Macro & On-Chain Drivers
__________________________________________________________________________________
Macro is mixed‑cautious (risk‑off) while BTC coils on major support — a blend that argues for selectivity and confirmation.
Macro events: Fed cut 25 bp and ends balance sheet runoff from December, keeping directional vol elevated; yields eased modestly with uncertain path; geopolitics stays hot (Ukraine/Middle East).
Bitcoin analysis: US spot ETF outflows persist; equities resilient while BTC lags; key map = 99.7k–100.5k buyers vs 103.45k–104.55k sellers.
On-chain data: Below STH Cost Basis (~112.5k); LTH distribution ongoing; options skew defensive → need inflows/resistance reclaims for sustained recovery.
Expected impact: Risk‑off winds cap bounces; technically a confirmed cluster reversal remains workable, but position sizing should stay prudent.
__________________________________________________________________________________
Key Takeaways
__________________________________________________________________________________
Controlled correction, compressed on a major 100k support.
- General trend: short‑term neutral‑bearish, with conditional rebound if ≥2H/4H confirms.
- Most relevant setup: confirmed tactical buy on 99.7k–100.5k, add above 100,950/101,650, invalidate on 12H/1D < 99,700.
- One key macro factor: persistent ETF outflows reinforcing a risk‑off backdrop.
Stay disciplined: let the market print the signal — act decisively on confirmation, or step aside if 99.7k breaks. 💡

Risk‑off vs squeeze: the near‑term BTC plan__________________________________________________________________________________
Market Overview
__________________________________________________________________________________
After a swift capitulation into 99–100k, the market is stabilizing on a 12H/1D floor cluster. The regime is mixed: HTFs remain constructive, while ETF outflows and a risk‑off backdrop cap momentum.
Momentum: Bearish-neutral 📉 short term, stabilizing above 101.6–102.1k after capitulation‑type volume.
Key levels:
- Resistances (D/2D) : 103,800–104,063 (D Pivot High), 105,000–105,500 (intraday supply), 109,377 (2D Pivot High).
- Supports (12H/1D/MTF) : 101,616–102,102 (1D/12H floors), 99,700–100,100 (multi‑TF cluster + D Pivot Low 100,267), 98,150–98,613 (2H floor + weekly pivot).
Volumes: Very high intraday (capitulation) and normalizing on 1D.
Multi-timeframe signals: 1W/1D/12H trend up; LTFs repairing. Hold 101.6–102.1k to target 103.8–104.1k; failure reopens 99.7–100.1k.
Risk On / Risk Off Indicator: Neutral sell — aligns with risk‑off macro and partially contradicts the bounce attempt.
__________________________________________________________________________________
Trading Playbook
__________________________________________________________________________________
Context: HTF uptrend versus macro risk‑off; favor tactical buys at supports and avoid chasing breakouts without confirmation.
Global bias: Neutral with a tactical buy tilt while 101.6–102.1k holds; key invalidation: sustained close < 101,616.
Opportunities:
- Buy confirmed pullback at 101,616–102,102 (≥2H/4H bullish) targeting 103.2k then 103.8–104.1k.
- Breakout buy above 104,063 (D close) toward 105.0–105.5k, then 109,377 if momentum persists.
- Tactical sell at 103.8–104.1k on clean rejection, or break/retest below 101,616 toward 100.3k then 99.7–100.1k.
Risk zones / invalidations: Break below 101,616 voids the bounce path and opens 99.7–100.1k; strong rejection at 104k invalidates early longs.
Macro catalysts (Twitter, Perplexity, news):
- Persistent spot BTC ETF outflows — cap upside under resistance.
- Broad risk‑off (Asia equities down, firm USD) — pressure on supports.
- FOMC: -25 bps and QT ending flagged — rate‑volatility, choppy tone.
Action plan:
- Entry: 101,650–102,150 after bullish confirmation (≥2H/4H).
- Stop: ~0.7–1.0% below 101,616 (≈100.9k–100.6k).
- TP1: 103,200–103,400; TP2: 103,800–104,063; TP3: 105,000–105,500.
- Approx R/R: ~2R to 3R depending on fill/stop.
__________________________________________________________________________________
Multi-Timeframe Insights
__________________________________________________________________________________
HTFs remain upward while LTFs repair around the 99.7–100.1k and 101.6–102.1k floor clusters.
1D/12H/1W: Uptrend; price sitting on the 101.6–102.1k cluster. Holding it = stabilization and a path to 103.8–104.1k; daily reclaim above 104,063 opens 105–105.5k then 109,377.
6H/4H/2H: Rebound from 99–100k with very high volume implying local seller exhaustion; first gate 103.8–104.1k, confirmed on closes > 104,063.
1H/30m/15m: Basing above 100k; need a clean reclaim of 102.0–102.8k to extend; time failure if no push within 1–2 bars.
Major divergences/confluences: Bullish confluence at MTF floors + capitulation volume; divergence with the Risk On / Risk Off Indicator (neutral sell) — execute with tactical prudence.
__________________________________________________________________________________
Macro & On-Chain Drivers
__________________________________________________________________________________
Macro is risk‑off with unfavorable ETF flows, likely capping bounces under 104k despite constructive HTFs.
Macro events: Asia equities lower and a firm USD weigh on risk; BOJ remains easy; FOMC: -25 bps and QT ending flagged — more rate vol; US shutdown headlines keep liquidity cautious.
Bitcoin analysis: Weekly “make‑or‑break” band at 101k–103k; large short liquidations above could fuel a squeeze on a decisive reclaim, yet ETF outflows limit upside follow‑through.
On-chain data: Mixed accumulation, softer derivatives, hedging up — stability hides fragility absent fresh inflows.
Expected impact: Prefer reactive buys at floors and demand daily closes > 104,063 before chasing breakouts.
__________________________________________________________________________________
Key Takeaways
__________________________________________________________________________________
BTC is parked in a 101.6–104k decision zone, between sturdy MTF supports and a flow‑capped ceiling.
Overall trend: neutral (HTF up vs macro risk‑off). Most relevant setup: tactical buy at 101.6–102.1k with scaled profit‑taking below 104k, or a confirmed breakout above 104,063. Key macro factor: persistent spot ETF outflows. Stay disciplined: act on floor signals and avoid unconfirmed breakouts.

BTC: 103.9k–103.1k cluster on watch, 109k is key__________________________________________________________________________________
Market Overview
__________________________________________________________________________________
BTC is in a corrective drift into a dense multi‑TF demand zone as the macro regime stays risk‑off. Buyers defend the upper cluster, but bounces keep stalling beneath the first supply shelf.
Momentum: 📉 Bearish-corrective — intraday pressure persists with rejections below 104.8k–105.6k.
Key levels:
• Resistances (HTF/1D–12H): 104.8k–105.6k (breakdown shelf), 109.0k (must reclaim), 111.8k–114.6k (1D supply stairs).
• Supports (12H/6H/4H/1D): 103.9k–103.1k (multi‑TF cluster), 102.93k–102.75k (AGG/1H), 102.23k (1D floor).
Volumes: Normal to moderate on 1H–4H (🔎 act as an amplifier, no major catalyst yet).
Multi-timeframe signals: 1D/12H still Up, while 6H/4H/2H/1H/30m/15m are Down; average tilt remains lower while below 105.6k and 109k.
Risk On / Risk Off Indicator: neutral sell — confirms the risk‑off tilt and tempers dip‑buying near supports.
__________________________________________________________________________________
Trading Playbook
__________________________________________________________________________________
Strategic stance: HTFs are still up but the regime is risk‑off — favor confirmed tactical buys at demand and sell rejections under supply shelves.
Global bias: Neutral‑sell while < 109k; tactical invalidation if we close ≥ 109k with confirmation.
Opportunities:
• Tactical buy: fade into 103.9k–103.1k on a ≥2H reversal, first target the 104.8k–105.6k shelf.
• Breakout buy: add on reclaim/hold > 104.8k–105.6k with a 4H close; target 107.4k then 109k.
• Tactical sell: fade rejections at 104.8k–105.6k (and/or 109k) with rising sell volume.
Risk zones / invalidations: A sustained close < 102.93k (AGG) invalidates the bounce and opens 102.23k; failure to reclaim 109k keeps sellers in control.
Macro catalysts (Twitter, Perplexity, news):
• US spot ETFs: 4‑day outflow streak, 7‑day average negative — headwind for dip‑buys.
• Fed/liquidity vs growth: Fed injections vs growth/credit stress — sticky risk‑off regime.
• ISM contraction and softer USD expectations — could ease pressure if flows improve.
Action plan:
• Long (cluster): Entry 103.9k→103.1k on ≥2H reversal / Stop < 102.93k / TP1 103.9k–104.2k, TP2 104.8k–105.6k, TP3 107.4k / R:R ~1.5–2.2.
• Short (rejection): Entry 104.8k–105.6k on rejection / Stop > 105.6k / TP1 103.9k, TP2 103.3k–103.1k, TP3 102.93k / R:R ~1.6–2.0.
__________________________________________________________________________________
Multi-Timeframe Insights
__________________________________________________________________________________
HTFs (1D/12H) still support buy‑the‑dip, while LTFs argue for patience and favor rejection sells.
1D/12H: Structure remains constructive; testing a stacked demand zone at 103.9k–103.1k; clean rejection wicks or bullish closes can trigger tactical longs.
6H/4H/2H/1H/30m/15m: Downtrends with lower highs; repeated failures beneath 104.8k–105.6k; a reclaim/hold above this shelf is needed to ease pressure.
Major divergences: HTF Up vs LTF Down — dip‑buys at Cluster A/B (103.9k→102.9k) need confirmation; a failure below 102.93k opens extension to 102.23k.
__________________________________________________________________________________
Macro & On-Chain Drivers
__________________________________________________________________________________
Macro is mixed: liquidity support versus growth/credit stress and negative ETF flows, sustaining a risk‑off regime.
Macro events: ISM manufacturing in contraction; Fed injecting liquidity while bank reserves slide; USD seen softer, but geopolitics keeps risk premia elevated — a choppy backdrop for crypto beta.
Bitcoin analysis: Lost ~109k as a cost‑basis/pivot; key demand 103.5k→100k with a ~99k shelf; high squeeze risk on a 109k reclaim and hold.
On-chain data: Rising CEX balances, elevated LTH distribution, Fear sentiment — nearby supply capping bounces until flows flip.
Expected impact: Conservative technical bias below 109k; look for confirmed bounces at 103.9k–103.1k, else room toward 102.23k then 98.9k.
__________________________________________________________________________________
Key Takeaways
__________________________________________________________________________________
Controlled correction testing a multi‑TF demand zone just below clear overhead supply.
- General trend: short‑term neutral‑bearish within an HTF uptrend.
- Most relevant setup: confirmed tactical buy in 103.9k–103.1k with fast profit‑taking below 104.8k–105.6k.
- One key macro factor: persistent spot ETF outflows enforce a risk‑off regime; wait for confirmations before sizing up.
Stay nimble: watch the 103.9k→102.9k reaction and keep risk tight until 109k is reclaimed. ⚠️

BTC: 112k caps, 108.5k–106.5k defends__________________________________________________________________________________
Market Overview
__________________________________________________________________________________
BTC trades in a range with a bearish intraday tilt, while 12H/1D remain constructive. ETF outflows and a risk-off tone still cap sustained upside.
Momentum: 📉 Bearish within a 112k–106k range; rebounds capped below the 111.9k–112.2k flip.
Key levels:
• Resistances (4H/12H/1D): 111,900–112,200 (flip), 115,500–116,030 (HTF supply), 120,800–121,000 (1D/2D cap).
• Supports (12H/4H/1H): 108,482 (12H pivot), 106,050–106,500 (Cluster A 30m/4H), 102,530–102,790 (Cluster C 1H/2H/12H).
Volumes: Overall normal; very high prints at the recent 15m low — more “flush” than fresh catalyst.
Multi-timeframe signals: 1D/12H up; 6H/4H/2H/1H/30m/15m down — bearish confluence below 112k; key supports at 108.5k then 106.05–106.50k.
Risk On / Risk Off Indicator context: NEUTRE VENTE — it contradicts HTF momentum and argues for caution until 112k is reclaimed.
__________________________________________________________________________________
Trading Playbook
__________________________________________________________________________________
Strategic stance: range with intraday pressure — favor reactive entries at HTF floors, avoid chasing.
Global bias: NEUTRE VENTE near current prices; tactical invalidation on firm acceptance > 111,972 with volume.
Opportunities:
• Buy: confirmed reaction at 108,482 or 106,050–106,500; target 111,972 then 113.5–115.5k.
• Breakout buy: acceptance > 111,972 with volume; target 115.5–116.0k, stretch 120.8–121.0k.
• Tactical sell: rejection at 111,900–112,200 or 115.5–116.0k, aiming 108.5k then 106.5k/106.05k.
Risk zones / invalidations: Clean break < 106,048 opens 104.59/103.66 then 102.53–102.79; acceptance > 112k opens 115.5–116k.
Macro catalysts (Twitter, Perplexity, news):
• Fed to end QT on Dec 1 → liquidity tailwind, timing uncertain.
• Spot BTC ETF outflows → near-term headwind for trends.
• LTH distribution; STH cost basis near ~113k → rallies capped below 112–113k.
Action plan:
• Long (reactive): Entry: 108.6k (12H/2H confirmation) or ~106.3k (Cluster A) / Stop: below floor / TP1: 111,972, TP2: 113.5k, TP3: 115.5k / R:R ≈ 1:2–1:3.
• Short (tactical): Entry: rejection 111.9–112.2k / Stop: above the rejected band / TP1: 108.5k, TP2: 106.5k, TP3: 106.05k / R:R ≈ 1:2.
__________________________________________________________________________________
Multi-Timeframe Insights
__________________________________________________________________________________
HTFs (12H/1D) support buy-the-dip, while intraday frames remain bearish below 112k.
1D/12H: Uptrend but range-bound 112k–106k; 108,482 holds as pivot; acceptance above 111,972 opens 115.5–116.0k.
6H/4H/2H/1H/30m/15m: Lower highs persist; repeated failures at 111.9–112.2k; watch for a sweep into 106,050–106,500 if 108,482 fails. The tight 102,53–102,79 cluster is a magnet if pressure extends.
Major confluences: The 111.9–112.2k flip governs any relief; 106.05–106.50k concentrates multiple floors (30m/4H), with depth at 102.53–102.79.
__________________________________________________________________________________
Macro & On-Chain Drivers
__________________________________________________________________________________
Macro liquidity is set to improve, but crypto-specific flows remain hesitant — fostering two-way volatility inside the range.
Macro events: Fed ending QT on Dec 1 (liquidity positive); calmer European rates backdrop; managers heavily long risk with abundant cash sidelined — selective deployment.
Bitcoin analysis: Recent spot BTC ETF outflows weigh on upside attempts; pivot near 108.6k, with sub-106k flush risk if 108.5k gives way.
On-chain data: Elevated LTH distribution; STH cost basis near ~113k — a tactical lid until reclaimed.
Expected impact: Risk-off flows support a cautious bias below 112k; strong reactions at HTF floors can still spark relief.
__________________________________________________________________________________
Key Takeaways
__________________________________________________________________________________
Range-bound with a bearish intraday skew.
- Overall trend: neutral-to-bearish short term; turns constructive only above 112k with volume.
- Most relevant setup: reactive buys at 108.5k or 106.05–106.50k with confirmation; or tactical sells on 111.9–112.2k rejection.
- One macro driver: QT ends in December, but ETF outflows remain a headwind.
Stay disciplined: let levels lead, react to holds/breaks — don’t pre-empt. ⚠️
