Australian Stock Market #AORD #ASX200 Breakout! New Highs.Yet if you read the financial press to make your investment decisions
You would be de risking when you should be putting the pedal to the metal.
Inverse Head and Shoulders points to a whopping price from here once the neckline is broken.

ASX - Australian Stock Market Also Points To A Top...Studying the Dow Jones extensively over the years has been enlightening, but unraveling the patterns within the ASX has always presented a unique challenge. Despite their differences, I believe the outcome from this juncture will remarkably mirror each other, signifying an imminent peak. Witnessing

asx and xaoQRE Betashares Australian Resources Sector ETF 20,668,595
QFN Betashares Australian Financials Sector ETF 3,530,006
USD Betashares U.S. Dollar ETF 8,218,740
QAU Betashares Gold Bullion ETF – Currency Hedged 27,786,377
EEU Betashares Euro ETF 440,000
POU Betashares British Pound ETF 597,235
OOO Betas

XAO's possible pathSince October, the Australian All Ordinaries index has been steadily climbing along its bullish uptrend line, demonstrating resilience despite a few zigzags along the way. The index has now touched this rising trend line for the third time, signaling the possibility of further rallies to come - pote

AORD - Last trading day of DecemberSince 2000, the All Ordinaries Index ( AORD ) has displayed a negative seasonal tendency on the last trading day of December.
1-day average return -0.21%, standard deviation 0.72%, win rate 5 from 22 events.
Last year marked the 12th consecutive loss for the All Ordinaries Index on the last tradi

AORD - Last 3 days of December & 1st 2 days of JanuarySince 2000, the All Ordinaries Index (AORD) has displayed a positive seasonal tendency over the last 3 trading days of December & first 2 trading days of January.
5-day average return 1.04%, standard deviation 1.19%, win rate 17 from 22 events.
In terms of statistical significance, the conditiona

XAO Bottom & Top pattern targets.All on the chart for educational purposes only.
COVID base pattern target was met ( near enough is good enough for me).
Will the current downside target also be met ?

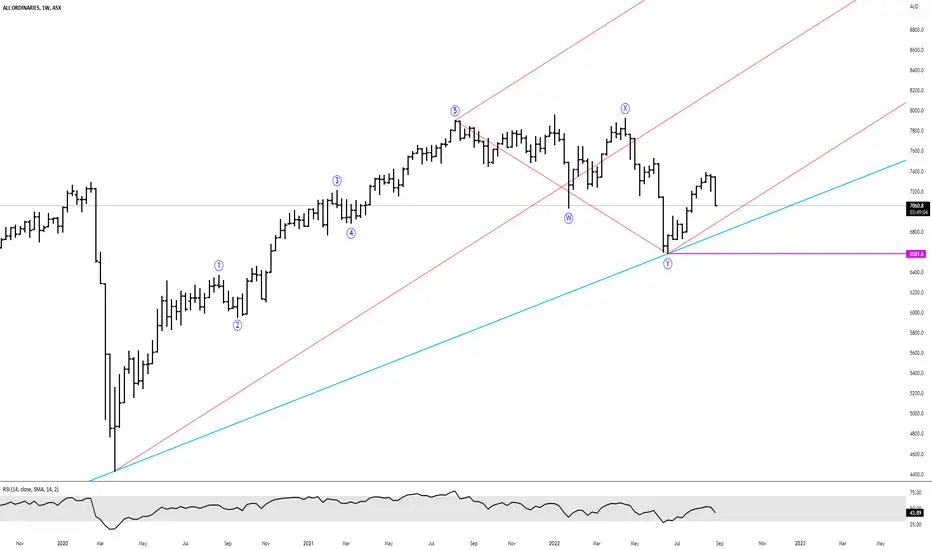
Looks Easy Yea?looks like this up/down leg has completed and we have made a bottom/low for now - if we break below our purple line my views are wrong and we're probably heading for a deeper correction.
XAO - Performance following Federal ElectionSince 1980, the average 3-month performance of the All Ordinaries Index following a Federal Election is similar after both Labor & Liberal victories. However, the data is consistent with random & statistically insignificant when compared to average 3-month drift.
Disclaimer: This data is not financ

Watching XAOLaying in wait for a move.
NASDAQ dropping, Russian Conflict, Pandemic, 'Chinese' problems (apparently) in the islands.
Volatility equals big movements, big movements equal big rewards and big risks.
No movement equals stagnation, no one's interested, so no ones putting in or pulling out, simpl

See all ideas