💡🎓1929-2031: The Fractal Macro Economic Expansion Cycle🎓💡The 2 major Expansion Cycles of the 20th Century, both expanded exactly +2509%. & both over exactly 18 Years from ATH Breakout!!
In this analysis, I compare the size and duration of the 2 major economic expansions cycles of the 20th Century, identifying the key components of each individual cycle to draw Observations, Parallels and Predictions with the 3rd major economic expansion cycle currently happening in the 21st Century.
Observations;
All 3 Macro Economic Cycles have 4 key Components;
Correction
A. Crash, Recession & Recovery
Expansion Phase 1;
B. Breakout from ATH
C. Double Micro Wedge
Expansion Phase 2
D. Single Macro Wedge
Parallels;
The 2 completed Expansion Cycles (1 & 2) of the 20th Century both have exactly the same traits;
1. Both start with a Correction: Crash, Recession & Recovery (of varying lengths / %)
2. Both expanded by exactly 2509% by the ATH / Next Correction, compared to previous Low (previous correction)
3. Both expansions lasted exactly 18 years from breakout of previous ATH to next ATH prior to correction
4. Both expansions were broken into 2 Phases of exactly 9 years each , defined by the same following characteristics:
a. Phase 1: First 8 years of expansion - Breakout of from ATH, succeeded & Double Micro Wedge
b. Phase 2: Second 8 years expansion - A Single Macro Wedge
Expansion Cycle 1 & 2 Details
Expansion Cycle 1: +2509% / 219 Bars
ATH Breakout: 1954 to Correction: 1972 (18 Years)
Previous ATH: 1929
Previous Market Low: 1932
Expansion Cycle 2: +2509% / 217 Bars
ATH Breakout: 1982 to Correction: 2000 (18 Years)
Previous ATH: 1972
Previous Market Low: 1974
Prediction:
Expansion Cycle 3 started in 2013, with a Break out from Previous ATH, that was quickly succeeded by a Double Micro Wedge, all leading up to today (September 2021), which is roughly the end of a Expansion Phase 1 of 9 Years (half of 18 Year historical Expansion duration)
Expansion Cycle 3; Phase 2 will start in 2022 and last until 2031, during which we could expect to see a major wedge form within the market, combined with a exponential expansion to reach a Market ATH of +2509% in 2031 (compared to previous market low in 2009) that will catalyse the next major market Correction: Crash Recession & Recovery from 2031 through subsequent years.
Expansion Cycle 3 Details
Expansion Cycle 3: +2509% / 217 Bars
ATH Breakout: 2013 to Correction: 2031 (Predicted 18 Years)
Previous ATH: 2000/2007
Previous Market Low: 2009
Conclusion;
The market is essentially a self repeating algorithm, a fractal!!
First defined by Robert W. Brooks in 1978, then first visualized by Benoit Mandelbrot in 1980, this has since been known as the Mandelbrot Set, and can be observed all across complex systems both natural and synthetic, with this mathematic miracle providing the foundation for CGI (Computer Generated Images) so advanced/complex that they can emulate real world expressions of complex natural formations such as mountains, human movement and almost anything you can think of!
Yea fractals are awesome, I've seen them a bunch while tripping and have come to understanding of their fundamental role in creating the realities & universe we experience :D
I guess the question is, will they play out in the current and future Macro Economic Cycles as well?
What are your thoughts?
yemala
Marketcycle

Is the Bear Market Upon Us?Hello Everyone,
Quick analysis for today. There has been a question in the air for the last 2-3 months. "Are we in a bear market?". Well there is not a simple yes or no answer for this and I would say it is a little too early to call. I am personally leaning more bearish as I am seeing rallies with bearish price action representing dead cat bounces. Not to mention the huge loss in momentum and exit pumps in random small cap alt coins by whales.
I have provided several pieces of analysis in the last few weeks but here is a more simple weekly chart.
As we can see, each time the market "tops" it is followed by a large relief rally that does not exceed the all time high. The biggest take away is the much lower volume or bearish price action as the price tries to climb back up. Each time this happened, the market saw the entry way into the bear market. Another note is the blue Moving Average which is the Hull Moving Average . This MA has been consistent in determining the start/end of the bull/bear market. Not to mention we are at a 20x from the March 2020 low.
I would also like to include a partial monthly analysis here. If you look at RSI, each bull market ended with RSI just above 90. The bear market followed. This bull market hit 90 right around the 60k area.
This does not mean there are not bullish swings in the bear market. There are 4-7 on average per year. I will be looking forward to trading these as well as DCAing in the bear market (if it is here to stay). I made some very good gains in this bull market. Things can change and we may still continue this bull cycle but at this point I think it's unlikely.
As always, be patient, use risk management, and good luck trading!

Update long term crypto market analysis (#total2 ) $alts #Altseason #Cryptos
Update long term crypto market analysis (#total2 )
*Double top 1: Wave 3 of main cycle, end of 4 years repetitive cycle (Novembre 1-15).
*Double top 2: Wave 5, end of lengthening cycle (June 2022-June 2023).
*Final target: between 0,382 and 0,5 of last cycle.

Bitcoin: The Ultimate Market Cycle Theory ExplainedIn this post, I'll be breaking down Bitcoin's market cycle theory, explaining my perspective on the target and time period I have in mind for this bullish rally. If you've been keeping track of my other posts, you'll notice that I've been very clear with the fact that the overall trend remains bullish on Bitcoin, as much as the short term trend may appear bearish.
You can view my latest post, where I cover Bitcoin's daily chart here:
Bitcoin: The Beginning of a Second Rally
Disclaimer: This is not financial advice. This is for educational and entertainment purposes only. I am not responsible for the profits or loss generated from your investments. Trade and invest at your own risk.
Bitcoin's Price Target Analysis / Explanation
- This is a model that was inspired by that of DigitalKM on Twitter.
- We can first arbitrarily divide Bitcoin's market cycle into three: the first cycle from 2010-2013, second cycle from 2013-2017, and the current third cycle.
- We can then look at the fibonacci retracement levels based on the major pullbacks/corrections that took place during each market cycle.
- What's interesting to note is how the 1.618 level initially plays a key level of resistance, but acts as the bottom support for the coming (next) cycle.
- We can also see a pattern in which the market cycle peaks near the 2.272 fib resistance.
- As such, given that price actions tend to repeat, we can expect a huge initial rejection at the 1.618 fib level, around 63k (which is exactly what happened), and a continuation upwards as we peak around the $200,000 mark for this cycle.
Now that we have a rough estimate of where this cycle might end, then comes the big question: when exactly could we expect this market to top off?
Bitcoin's Cycle Duration Analysis / Explanation
- So there are two theories I initially had in mind for Bitcoin's market cycle duration.
- The first theory is a case in which we see the cycle's top around December 2020.
- Historically, all market cycle tops have peaked out in December, so it would make sense to see a parabolic move up to the top by the end of the year.
- For a detailed explanation on this theory, check out my other analysis I posted on Nov 16, 2020: Bitcoin: Long Term Breakout Projection
- The second theory for the cycle duration is based on Bitcoin's halving events and cycles.
- After the btc halving in 2012, the rally lasted 372 days up to Nov 2013.
- The second halving in 2016 lasted 520 days, up to Dec 2017.
- In terms of time span, this is a 39% increase in the duration of the bull run.
- So assuming that we apply the same increase in duration for this bull run, we’d see the rally last 722 days, which would end around May of 2022.
- This aligns with Benjamin Cowen's model as well, where we see an extended duration for every Bitcoin cycle, and diminished returns.
Conclusion
Predicting the market is impossible, but as traders and investors, we need to understand the overall picture and understand market cycles in order to best position ourselves within a bull market backed by huge momentum. I believe that Bitcoin's price target of $200,000 by May 2020 is one of many highly probable scenarios based on the technicals of its price action, as well as the market's reaction to Bitcoin's supply change based on halving events.
If you like this analysis, please make sure to like the post, and follow for more quality content!
I would also appreciate it if you could leave a comment below with some original insight.

Sector Rotation July 2020 - Money on Defensive?This week's dip on the AMEX:SPY revealed something important within the Sector Rotation model. For the last quarter the Sector Rotation model has been giving mixed signals following the clear predictive path it forecasted coming out of March 2020. This recent price shock provided a glimpse into where the money is moving right now!


Short term Bullish trend Reversal in TATACHEMShort term Bullish trend Reversal in TATACHEM with break of LL-LH cycle and confirmation with a double bottom pattern.

BITCOIN... where are you going?I was going to hold off posting this until the current daily close as it could invalidate my entire road map for now, I'm already short how ever was looking to cover my position today with the intentions of seeing a buy back on the daily close.
If this current Daily candle closes well below the current short term range support I'm expecting more downside much earlier than I would like.
How ever if we do have a recovery here and we start to move higher again with market structure I'm not going to turn Bull again, I'm simply biding my time for a much better entry on the continuation of the down trend expecting some form of a broadening range over the next month, this will ultimately become a suckers rally or bull trap as the perma bulls and retail fail to see the signs that we are already in a bearish indecisive market.
Retail have a natural tendency of a bullish confirmation bias and some times fail to see the information in front of them, instead twist it or see what they want to see to confirm the narrative, much like selective hearing as a child lol
It's for this phenomena that often retail become trapped into positions that smart money can take advantage of and they simply become liquidity providers to the big players.
I am expecting another short/mid term rally towards the 46k bottom of the previous range as a bit of a complacency play which is why I refer to it as the suckers rally as the perma bulls, YouTube gurus and retail traders start yelling "told ya so 1milly bitty here we come" "should have bought the dip" etc etc
This will be a perfect time for large funds to trap the bulls into positions to fill large shorts and ride the price back down to the previous support level.
As we touch back on support I would expect a natural reaction of a dismal buy back but as we move into the anxiety phase and retail start to become weary they may actually be wrong, I wouldn't expect to see a whole heap of buying here and most likely see a bear flag form and break to the downside demolishing that support level at 32k
The key areas I'm looking at for the continuation is the large demand zone around 25k, now keep in mind the structure formed at 25k I wouldn't normally consider to be a large demand how ever the retest in Jan confirmed there was a demand at that level at the start of the year so it may still be a significant level to watch for so expecting to see a short term recovery how ever ultimately breaking down again as the bulls begin the panic and capitulation phase of a market cycle as this is where the big money takes the most advantage to fill large positions and begin the accumulation once again.
There is a key area around 22-24k where there was a hold up in the market towards the end of last year as we entered price discovery from previous ATH, the pause during that period was short lived and we never returned to that level, so we could see a square up to this level but I'm not counting on it being the reversal point more so an Area Of Interest to manage my trade accordingly at the time.
Finally we push towards a liquidity grab as 20k just seems like way to obvious of a level to aim for, there will be bottom pickers, buy the dippers, people loading up on longs are previous ATH and others front running the herd, this will become a massive liquidity pool for smart money so either we turn the market around before we get there which will simply price retail out of the market before they get a change to get in.
or
they let them get in and there stop loss orders become the liquidity pool and they do one last blip down to shake them out and take there orders off them, and thus we begun the re accumulation phase.
Anyway just my thoughts and a possible road map that I often refer to as my "play book"
These arnt so much a "prediction" or a "call" more a case of "if this happens, then im gonna do that"
Keen to hear your thoughts

We keep comparing fractals BTC 2019-2021 Last April I made a comparison of fractals towards a bear market and it was carried out, we currently see a recovery but how true can it be in the face of a bullish break? We can get to have a bulltrap and come back again and double-bottom in the 30k. Otherwise, we can break well and head towards the 44-48k level in case this is done in a good way, we could visit a double top or if we draw a fibonacci extension in the medium term, go towards 100k but in the case that not If it happens, we could head towards catastrophe and visit not only again as a triple floor at 30k, but 24k at the base of our canal.

Bitcoin Redistribution Phase?• Market Phases :
1) Accumulation
2) Mark Up
3) Distribution
4) Mark Down
5) Repeat
• Bitcoin already entered its markdown phase. What’s been happening lately in my opinion is not an accumulation phase, but a redistribution phase which is usually followed by another markdown.

BTC- Fundamental, market cycle and capitulationThe great unwind... As Mark Cuban calls it. Such capitulations are, however, not uncommon throughout Bitcoin's history. Feb 2018, Nov 2018 and Mar 2020... To name a few. Of course, to newcomers, such volatility is difficult to stomach. At least, that was how I felt back in 2017.
The latest China FUD is simply three banking and payments associations in China reiterated on the central bank's 2017 ban on financial institutions and payment firms engaging in cryptocurrency transactions and these rules have been in place since 2017. China has been banning the retail trading and the operation of crypto exchange within China’s jurisdiction since 2017. I know this because I was at the front row seat and watched this event unfolded which also coincided with the deep correction of Ethereum from $400 to $140.
China’s latest crackdown on Bitcoin mining will be limited to operations that are not using hydroelectric power. If you think about it, it’s actually good for BTC’s reputation and the global environment in the long run as the world’s adoption of the decarbonation accelerates.
Elon musk’s bashing of BTC…. Hard to take him seriously when he doesn’t even know the high ownership concentration of DOGE and when he believes that he can magically 10x the block size of DOGE. Obviously, he hasn’t thought seriously about the scalability dilemma and the tradeoff between privacy & decentralization and transaction volume/speed/cost. He is right about the BTC’s environmental impact though and it is an important issue for Bitconers to address as the worldwide trend toward the greener environment marches on. I just wish that he didn’t flipflop on whether or not he would allow Tesla to accept BTC payment.
FOMOers, long-term holders/whales and miners determine crypto’s market cycle. Let’s examine them one by one.
Short-term holder's capitulation-
Panic selling is actually good as weak hands get shaken out and market cools off a bit.
Both aSOPR and STH-SOPR have dipped below 1.0 recently indicating the widespread and aggressive panic selling by new holders.
# of address with a non-zero balance has also decreased which is another sign of panic selling by FOMOers.
Bitcoin’s Net Transfer volume from/to Binance is another panic selling indicator as it went up when panic selling intensified.
Long-term holder is HODLing-
The ASOL, CDD and Dormancy metrics are all down indicating HODL sentiment among long-term holders.
# of Bitcoin supply held by Long Term Holders indicating that LTHs haven’t distributed their holdings to the lvl where the new accumulation phase typically begins.
Coinbase’s outflow continues to increase and its balance continue to decline which indicating institutional accumulation and demand and the increasing # of accumulation addresses also point to the same trend.
Total supply held by long-term holders has also slightly increased though this data by itself doesn’t tell us if LTH is accumulating at the bottom of the bullish retracement or the beginning of bearish cycle.
Miners' accumulation-
Last but not the least, miners’ behavior has great influence on the market sentiment. Both Bitcoin’s Miner Net Position Change and OTC Desks Balance indicate that miners are bullish and are accumulating BTC instead of distributing it.
Most other on-chain datas and technical indicators such as BTC NVT price, Bitcoin Difficulty Ribbon and Mayer multiple paint a bullish picture as well . However, one thing that concerns me is that Bitcoin Wallet Sizes: > 1,000 BTC seems to be declining a bit.
It’s possible that the price can continue to fall and bottom around 25k, but the likelihood of it happens will depend on if BTC can convincingly break above 38k and how long BTC stays below 40k. Whatever you do, base your judgement on the combination of different source and analysis rather than the biased intuition and simple trading patterns. Most importantly, play the long game. It's paramount that you can survive the bearish cycle, which will come eventually, and have enough capital set aside so you can buy at the bottom formation and enjoy the fruit of your labors when the market rises up again.


Cardano break out this simetric triangle and pull back confirmedI see that Cardano break up this simetric triangle and that was an accumulation zone in the range of $1 to $1.44 USD. Right now, Cardano it's above of $1.40 USD and we see that Cardano have all chances to continue up in the next days. For that, we can to looking for long position in this cryptocurrency.
In Daily timeframe, it's look bullish and I see that Cardano it's leading toward the $2.86 USD calculating the simetric triangle base to compare and project the next bull movement incomming.
We see in 3 Daily timeframe that Cardano based in this timeframe, it's could to leading to $7.66 USD in few weeks by medium to long term. That will be amazing for us as we're Cardano holder. And also, I want to make stream video in trading view here to talk about of cryptocurrency news, about Cardano, and other altcoin to know their fundamental analysis, and maybe, I belive to create a telegram group, that help us to be connected as community.
Now, we see that Cardano it's extremely bullish, you can to put a buy order limit at $1.41 USD with the SL at $1.19 USD and your target proit will be $2.86 USD. Guys, if you found out that this idea it's going to support for everyone, you're inviting to share this analysis with others traders, crypto-enthusiastic and others crypto-community to know my perspective and expand my presence.

Weird BITCOIN technical analysis/cyclesHistorical highs and lows are taken with their percentage gain and with that data I've found reoccurring patterns. With that, I've drawn a chart where bitcoin might get to, if this analysis is correct, bitcoin will break out to $80k and then come back down to a much lower level. This is partly fun, well mostly fun, I'm not too sure if this is coincidence based, or if there is actually something here.


Litecoin show a good interesting opportuity; I reconsider it!!!At the moment, if you thinking to trade Litecoin, I thinking to trade Litecoin, this crytpocurrency show a good analysis and good position that I can to make a Daily analysis more secure and profesional for you. I see that Litecoin it's bullish and I entry right now in the marketprice around of $187 USD to long position until the $423 USD, I follow the Daily analysis.
I know today that Cardano and Ethereum was touch me my break even, in except, as I entry around o $1,500 USD in Ethreeum and touch my break even exactly at $1,700 USD, I get some profits in Ethereum, but in case of Cardano, I do not earn and loss, my profit was 0 without any loss, becuase I put a break even in the price entry in Cardano.
But, whatever, I see that Litecoin it's more interesting to trade Ethereum, but I change Litecoin for Ethereum to trade it.
Litecoin could to form a simetric triangle, notice that much crytpocurrrency it's in this pattern, for that, this it's a good opportunity to bought Litecoin or put in long position.
And the weekly analysis it's still bullish, for that, I make a Daily analysis in Litecoin.
Guys, if you found out that this idea it's very interesting for you, please comment below what do you think about Litecoin, and I invite you to share this analysis with others traders to know my perspective of this crytpocurrrency.

GBPJPYPossible up side entry same structure as the AUDUSD will link below please check it out full analysis and take the entry based on your own trading plan and rules.

AUDUSDRight now price is near the 4H key level and broke the previous 1H key level it's playing the possible fake out, we will wait to see price break above the 1H key level and retest the zone and after that will be the change of the structure and price can possible move up side.
Please, take the entry based on your trading plan and use the good risk management to stay consistent profitable.

EURCHFRight now price is in the accumulation zone we can wait until price breaks the down side that will give confirmation then downtrend will be continued, also we can point out that 1H HH and 1H HL has been taken which shows that there is change of structure for the short time, we can take this opportunity to take the entry in the LTF.
Please take the entry based on your own trading plane with the entry rules and follow the proper risk management as usual to stay consistent profitable.

BTCUSD - TOP OF THE MARKET?After the crazy past few months I know a lot of us have that nagging feeling that the party is close to ending. I have been seeing the same sorts of stuff I saw in 2017, and I suspect we might be turning towards the second half of the cycle - bear. Let me know what you think about this, if I am even using head and shoulders tool properly. Still learning and appreciate all your comments!

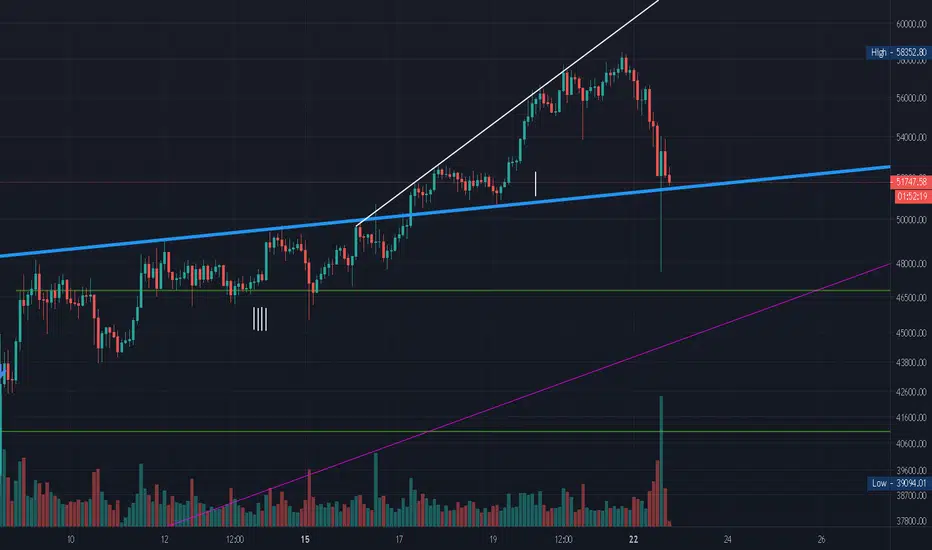
A very important support lineAs we can see, the line in thick blue acted as strong support level for bitcoin. Even with the f2pool liquidation, we jumped back into the top real quick.
This bull market cycle is not nearing its end if we compare it to previous cycles, but one thing to keep in mind is the fact that the price has been accelerating way fast. The faster the price acceleration, shorter is its life. There shouldn't be only one bull market cycle in 4-years time.
Bitcoin and the Market CycleThis is my attempt at applying Wyckoff's methodology to the BTC/USD price chart.
Wyckoff posits that, although price movement may appear random, it actually follows a repeating cycle that can be divided into four distinct phases: accumulation, mark-up, distribution, and decline.
Based on historical data, it appears as though BTC is in the early-to-mid mark-up phase of its third cycle. Coincidentally (or not), these cycles correlate with halving events (see Stock-2-Flow model).
My recommendation is to continue holding BTC through 2021, as I see much upside potential. Note that the risk-reward ratio is greatest in the distributionm phase, and smallest in the accumulation phase.
*Note that the final mark-up phase is extended by an arbitrary amount*

Warning!!! Bitcoin formed a bearish rising wedge!!! 🐻 sentimentThe bear sentiment it's so clear than water, but we see in H4 timeframe that Bitcoin it's not stable to bought contract. For that,I cancelled my position right now to closed up manually because we have the big possibility that Bitcoin goes to make a reversal of the trend. And that mean that it's great becuase we could to save USD to bought more cryptos to add in my portfolio. I thinking in it.
This it's my plan to sell below of $28,000 dollars in case that Bitcin doesn't support this price level. At the moment, I'm out of the crypto markets and I didn't reccomend to short or long Bitcoin, becuase we could to formed a mini-distributtion to find down a best price to bought!!!
We see in weekly chart that Bitcoin have 2 weeks bear sentiment and the trend could to experiment a possible reversal so near of the $20,000 USD above of this price. This it's my theory!!! But as Bitcoin it's so consolidate, I don't like to trade in this scenario when the assets it's into this consolidation.
For that, my own reccomendation it's still alert when Bitcoin mae the next movement when break up or down this consolidation in the range of %29,000 USD- $34,000 USD to take best decision!!!
