YAY! BTFD!! You Sure you Really Want to Do This?!?Chart says all. Correction is not over IMO and you ought to expect a much deeper pullback before plunging long.
DYODD; GLTA!
Measuredmove

BTC: Where is the bottom?In this chart, I take a look at the chart from the perspective of measured moves and where likely algo supports and resistances are likely to be found.
I measured out several FIBs from 0 to the previous few tops and from the March 2020 bottom to the previous few tops. When doing this you can see a very clear pattern of similar FIB groups ie; .382s in a range, .5s in a range, .618s in a range, etc. As you can also clearly see during this large move down, the price is generally stepping down to these fibs after having ranged for several days or weeks.
The space between the .5s and .618s is the typical reversal zone in a measured move. When trading you want to look for reduced risk trades. Long-term traders and investors will want to look at entry 1 as a range to build their first position and entry 2 as a zone to double their entry 1 position. (Another option is now starting DCA or dollar-cost averaging) The profit-taking zone is the -.236 which gives us a range of $79K-85K. With a stop of around $24K we have an excellent reduced risk trade set up that is between 3 to 1 and 4 to 1. IF the stop hits, we are likely going to be going much much further down and we all get rekt.
Currently, we have just entered the .5 fib zone. Based on recent PA, I would expect us to range here for at least a few days if not weeks. If we end up bouncing, I expect the .382 to act as resistance. I believe we will eventually end up hitting the golden zone, which is the space between the .618s and the .65s. It may be a choppy ride until we get there. The described trade setup might have a person in the unrealized red for an extended period of time on entry 1 before bottoming at entry 2.
Based on my traditional indicators, it appears that we could be in for a short-term bounce to the .382. The monthly chart is not the most favorable to the bulls imo and suggests more down or a prolonged sideways chop. If this is a hard bounce from the .5 range we should expect to see a pretty aggressive series of measured moves or fib extensions and will become pretty obvious that the .618 won't be hit and you can ladder out of your position on smaller time frame MMs to even further reduce risk and end up with the holy grail free trade.
This trade may take months to play out but could take years. This is not investment advice. This is a setup I will likely take myself but I am currently holding off until we get through the January FOMC meeting and potential Russian-Ukraine war (which I believe is FUD).

IWM: The most interesting chart in the world: As of Friday (Jan 21) IWM has fallen out of a long range of distribution, produced both daily and weekly closes outside the trading range, and importantly has the potential to produce a large move. In this piece we discuss the trading range, mostly from a Wyckoff perspective, show multiple ways to start thinking about how far the move might progress, and finally take a look at IWM in terms of its strength relative to the higher quality SPX.
Again, there is not a trading recommendation attached to these observations. The CMT course offers an excellent way to learn more about the concepts discussed below.
1) The most important chart feature is the trading range. Long trading ranges represent zones where supply and demand move into balance.
a. Ranges are zones where strong hands / smart money accumulate new shares if they are bullish, or distribute existing shares if they are bearish.
b. In early November price attempted to break out of the top of the range, but failed. In Wyckoff terms this is known as a terminal upthrust. The failure is bearish and confirmed the view that the range represented distribution.
c. The upthrust was followed by a high volume decline back to the lower bound. The volume expansion and solid thrust strongly suggested that price was likely to break out of the trading range.
d. There was some buying as the market tested the bottom of the range for the last time (note the very low volume bounce). My interpretation is that traders who had repeatedly bought the trading range lows, tried to buy again. They failed to recognize the significance of the upthrust and of the development of high volume in the days just prior. Now they are trapped.
2) On Friday, price fell through the range lows, trapping longs and accelerating lower on high volume.
3) Was the volume high enough to exhaust the immediately available supply? I would think not. Modern selling climaxes often take multiple days to unfold, and are not likely to occur this soon after falling out of a long zone of distribution. Remember, the long range attracted many weak handed buyers who are now being forced to liquidate.
Targets:
1) There are several ways to think about move objectives. The simplest is to run a Fibonacci retracement of the March 2020 low to the November 2021 high. I keep it simple. I look at .382, .500 and .618.
2) Note that the 50% retracement of the entire move is very close to the January 2020 high pivot. The two form a support confluence in the 169 zone. Given the amount of distribution that occurred in the trading range, I think its more likely that the .618% retracement @ 152 is the most likely one.
3) When a correction develops you will be able to use the TradingView trend based Fib extension tool to project additional targets. Its likely that those targets, combined with the retracement tool and more traditional chart analysis will provide support confluences to work with.
Point and Figure charts also provide insight. They don't get nearly the respect of Fib points, but they deserve it. I tend to use the Fibo points as my references, but sometimes, a solid PF range count can add insight.
Wyckoff and others taught that the length of time spent in the consolidation is related directly to the distance of the subsequent move. Trading ranges are areas of the chart where large amounts of shares change hands, often from strong hands to weak hands. This is why there is a relationship between the length of the range and the size of the move.
1. Granted, there is no end to the debate as to what points should be used to define the counts. Since I'm a simple guy, I keep it simple.
2. In this case the width of the range is notable. A conservative target falls in the 145 area while a more aggressive accounting measures as deep as 121.
So I have targets, what do I do now?
1. I think its enough to know that the targets are all much lower. As the trade progresses the chart will produce more support and resistance zones, target and objectives that will help to narrow the range of outcomes.
2. The final point is that, particularly in the case of point and figure charts, objectives are more guides than they are precise points. When available P&F counts are extremely useful in determining risk/reward in a trade.
In the shorter run, the market broke out of its trading range on Friday with a solid daily/weekly thrust lower. But now, in the shortest perspectives it is deeply oversold. If the market does rally, the character of the rally is likely be corrective. I like to look for bear flags or pennants or a rally back to the underside of the broken trading range before the market rolls over again.
Final Point: I was always taught to buy the strongest names/groups in uptrends and to sell the weakest names/groups in downtrends. IWM has clearly been weaker than SPX for a number of months. The top panel is IWM, the middle panel is the SPX and the bottom panel is the ratio between the two. If the market is setting up a major correction IWM probably will be far weaker than SPX.
Good Trading:
Stewart Taylor, CMT
Chartered Market Technician
Shared content and posted charts are intended to be used for informational and educational purposes only. The CMT Association does not offer, and this information shall not be understood or construed as, financial advice or investment recommendations. The information provided is not a substitute for advice from an investment professional. The CMT Association does not accept liability for any financial loss or damage our audience may incur.

XAUUSD scenarioHI TRADERS ... Price in top of broad bear chanell i think sell Double Top and scale in higher price and hold to Measured Move based on height of trading range or bottom of broad bear chanell is profitable strategy

USDCAD - LONGBullish Harmonic Pattern has been completed. Buying opportunity.
USDCAD - LONG
ENTRY PRICE - 1.26480
SL - 1.26000
TP - 1.27700
Please leave your comment and support me with like if you agree with my idea. If you have a different view, please also share with me your idea in the comments.
Have a nice day!

JICPT| I got the move from 4.85 to 4.63 for SGDCNH!Hello everyone. It's been almost 11 months since I posted the idea titled 'Bearish view on SGDCNH(potential low 4.63)'. You can refer to the linked idea below.
Yep, I'm right about the direction and move. SGDCNH fell sharply by move then 2000bps since I published the idea. I can see the downtrend line is still well respected. Price seems to be consolidated for a while before making the decision. By measuring the move, the big fall has come to an end. SGDCNH is likely to rebound, however I need to see the confirmation on the chart.
As the inflation is going up, I don't think SG government will let the SGD depreciate further. The weakening SGD will hurt the purchasing power of the folks there.

Do We Short Yet?!?NO!! It's gone Ape-S**TT!!! Melting Up; Short here = Suicide. Could get a Measured MOVE from the Breakout point 4593; +249 push to 4842?!?
Watch these Indicators for a pivot. Near-term Short entry for a technical pullback at WT crossover when RSI overbought and a 5-wave EW in RSI appears; NOT before! Do not hold this short for long term, purely a day trade from Nov ATH price pushback, roll into longs when WT signals!
Expect Strong R at the ATH 4744; then moving higher to new ATH: likely get firm pushback after an exhaustion gap appears;
perhaps 12/08 the way it moves will arrive in a few hours, fgs, FOMC dovish position could spark final ATH move.
This is not investment advice! Estimates given are not guaranteed to be valid projections, trade at your own risk and with great care!! GLTA!!

BULLISH DESCENDING WEDGE PATTERN NEAR COMPLETION?In a broadening wedge a descending megaphone pattern is characterized by five reversals, up-down-up-down-up, each swing is wider but price is constrained within the wedge pattern, without break below lower TL. The finishing move is a crushing bearish move to the lower TL.
Price came down to 200 DMA. Will it hold? Wayyy Oversold! The pattern is a bullish reversal continuation, and implies further price advance by measured move equal to the extent of decline, added to the upper TL at breakout point.
Went off -230, add +230 to breakout price, estimating upper TL at 4610, yields target price 4840 in December.
Amazing things been happening here, remember, just over a month ago price was 4300! Heeeere we goooo agaaaain!!
This is definitely not advice, invest and trade at your own risk, >DYODD< GLTA!!
TEXT REFERENCE WITH DIAGRAMS:
www.centralcharts.com
Image for price projection:
www.centralcharts.com

An IPO few are watchingDEN (Denbury Inc) is an oil and gas company that focuses on CO2 enhanced oil recovery. Boring right? I assume that is the reason it has been under the radar, after all, Technology tends to get more attention.
Since September 2020, when it IPO'd, DEN has increased by over 300%.
There are 2 potential measured moves, one by using the horizontal range transposed on top of the current support (purple arrow), and the extended target (light-blue arrow) by using the ascending triangle pattern.
In late June we tested and failed $80 (approximately), since then, we tested the bottom of the horizontal range (purple dashed-line) and are now breaking to all-time highs.
Important Note
Earning are Thursday 4th before the market opens, so we could experience a volatile move.

CADJPY - SHORTThe price is below the Major Resistance Level. Consider the development of the South Impulse. First target is next Demand Zone.
CADJPY - SHORT
ENTRY PRICE - 91.650
SL - 92.500
TP - 89.830
Please leave your comment and support me with like if you agree with my idea. If you have a different view, please also share with me your idea in the comments.
Have a nice day!

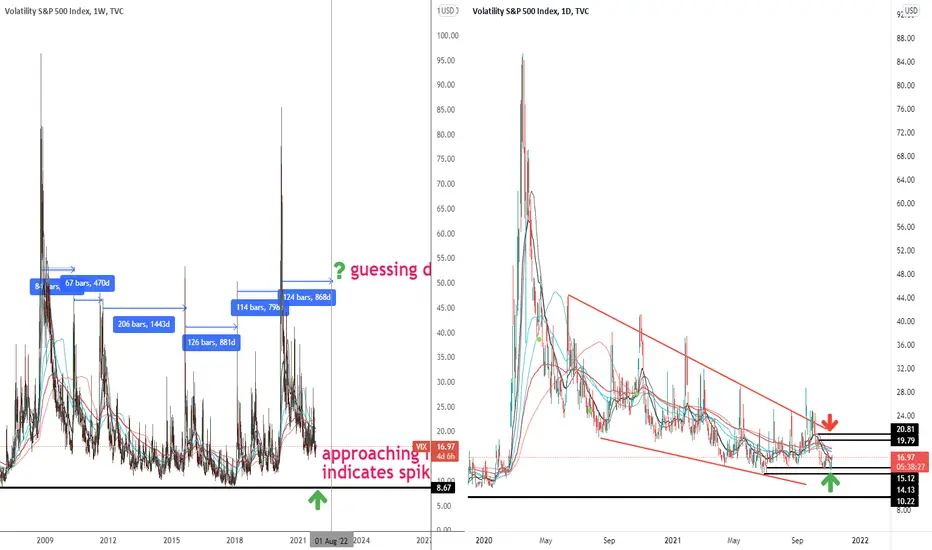
JICPT| VIX approaching floor indicates spike ahead? Hello everyone. VIX just caught my eye for its floor level of 8.67 on the weekly chart. I applied measured move to guess when the spike might happen roughly. Guess what? It's Aug. next year.
Don't take it too serious, nobody knows what will happen then. By measuring the date between the spikes on the weekly chart, I started to realize no matter what things will happen from time to time , especially VIX is running at low, say around or below 10 .
It's like a cycle. All my MAs on the daily is going down and the red downtrend lines were well respected. It will support the market to be bullish until VIX couldn't go any lower. It has to rally from the down, terminating the old cycle and starting a new one.
What do you think of my chart? Any ideas?
Happy Days are Here Again!Irrational Exuberance! Bad news is good, good news is gooder!
The gaps tell all. Measured move from the runaway gap ought to end up around 388 +/- 2 pips.
There must be and certainly will be a pullback from a last exhaustion gap, may gap up sometime 1-3 Nov.
Fed minutes on 3 Nov may be catalyst for pullback. Likely pivots shown, 1/3 speedline most likely, given extreme fearless bullishness.
Can bull anywhere anytime from pullback to any of the levels shown. Not even attempting to guess where this might occur, get ready!
Final ATH TBD, might come in Dec for Santa Rally IMO. Would be a 5th of V EW, a monster. The subsequent break in 2022 will be spectacular...
Not advice, just A TOOLUSE TUTORIAL... REMEMBER THE TREND IS UR FRIEND TILL THE END AT THE BEND! GLTA!!

USDJPY - SHORTThe price is below the Major Resistance Level. Bearish Harmonic Pattern has been completed. Consider the development of the South Impulse. First target is - POC.
USDJPY - SHORT
ENTRY PRICE - 114.200
SL - 114.700
TP1 - 113.700 (Breakeven)
TP2 - 112.100
Always follow the 6 Golden Rules of Money Management:
1. Protect your gains and never enter into a position without setting a stop loss.
2. Always trade with a Risk-Reward Ratio of 1 to 1.5 or better.
3. Never over-leverage your account.
4. Accept your losses, move on to the next trade and trust the software.
5. Make realistic goals that can be achieved within reason.
6. Always trade with money you can afford to lose.
Please leave your comment and support me with like if you agree with my idea. If you have a different view, please also share with me your idea in the comments.
Have a nice day!

BTC/USDT - 1D - Potential bull flag and channel breakoutPotential bull flag forming on the Binance Daily BTC/USDT chart.
Channel (flag) measured move up, could send price into the golden pocket area of the fib extension.
Channel break down will send price to the bottom of the blue long term trend line.
Red pole's measured move could send price to the 100% fib extension area. The larger yellow pole could move it to the top of the blue long term trend line.

ES short -testing oscillation strategyThis is my wide look at the market, while I am testing usage of TradeStation brokerage on TradingView for the first time, and it is working marvelously!!!
I am building a short of the index using MES, using a quick stop if I am wrong. High R:R trading, but often immediately wrong playing the oscillation at the edges - as that is where new trends are confirmed at the breaking out of the oscillation. I keep doing what works until it doesn't. If it breaks long, I will look at a new trend to the upside and adjust indicators accordingly. We are still currently below the monthly pivot and so near it that you don't get a better price to short this current macro trend should it continue to the downside.
Good trading to you, thanks for following and liking my scripts!
~B3

SOXX 1 year trendSemiconductors/chips continue to be an essential part of everything around the globe.
For a year, we have maintained an upward trend, which is being tested today.
There are clear outperformers in the industry, but it is clearly been working for all of them as a whole.
When we have touched the trend line in the past, we have had a 50 point gain, which has happened through 2 weeks approximately. That gives us a target of around $505.

DJI in Modest CorrectionGave up 1K pips and entered consolidation zone. Forms pennant on flagpole, probably only halfway down.
Can backtest higher before measured move; or complete a flagpole formation from this pennant.
Price action has been muted; small moves, no huge red days, yet...
Trade at your own risk or just stay out and watch the damned thing. Churning moneypit IMO; GLTA!

BTC PENANT Breakout trade setup$50,086 target upside breakout, $40,318 target downside breakout. We are losing negative momo on the daily, something to keep in mind.

AXS LongAXS long position, good risk to reward. Measured move pretty much coincides with fib retracement. Bearish divergence on the 4 hour. Can easily strategise a stop loss

diamond top to tis years lowsdiamond top to tis years lows to 32.50 to 33.50 range.
first sign that pattern will break is swing high not reaching pattern trendline we can confirm that tis is swing high from oscillators both are pointing down.

ETHBTC: The big move - 0.09 or 0.04?After confirming a symmetrical triangle, the upside target for ETHBTC is around +40% from an upwards breakout to approximately 0.09 for new multi-year highs. The downside target is -32% back to previous resistance and volume support level. While ETHBTC remains in a longer-term bull trend, the likelihood of a break to the upside is more likely, given these triangles are usually continuation patterns. Volume remains low either side of this trade, confirming a large trading gap for a big move to occur.
None the less it's important to remain patient as well as neutral until confirmation of a break up or down. The anticipated breakout zone is based on 75% of the triangle completing, after a minimum three touch-points of support & resistance. A breakout is therefore expected by August 18th, with decreasing volume in the past three months indicating a significant move is likely to happen. Along with ETHUSD chart patterns, ETHBTC is a trading pair that also often meeting it's measured move targets (and beyond):
Watch out any any bear trap based fake-outs from these triangle patterns, as was the case with Bitcoin recently:
In a bull trend with a symmetrical triangle, it's better to trade long not short. Probability is your friend.

TSM breakout + measured move The chart shows a descending triangle, with a breakout.
The breakout yesterday and today, have been on strong intraday volume.
A measured move can be made by adding the height from the double bottom (purple circles), to the area of the breakout. Using the green arrows to represent the potential move, which takes us to $152 approximately. Which is coincident with the extended move of the fibonacci retracement lines at 61.8%.
$135 and $142 are potential resistance zones, where we could see some profit taking.

Amazon technical target --> $5000Amazon has been consolidating for almost 10 months.
Today's news of a big beat on earnings and guidance has taken us to the top of the consolidation range.
It is a classic move for stocks that have been consolidating for a long time, to make a strong move upward before consolidating again.
Making a measured move from the last time it did this, we get a potential target around $5000 in a 4-5 months time-frame.
To avoid a failed breakout, I would keep on eye on the MACD trend, which has turned positive, but should continue to rise to confirm the move up.
