ADBE // Inverse head and shoulders formationThe chart shows an inverse head and shoulders pattern, but the formation condition is to look for closing prices above the yellow line. If this condition is met, the first target is 380.43 which corresponds to the Fibonacci 1.414 level of the breakout. If we see closing prices above this level, the main target is 419,09.
Moving Averages

INTA NASDAQ:INTA
INTA has made a formation of RECTANGLE with RSI supporting ABOVE 60 along with MACD cross.
Once price closes above $47.55 we can expect price upto $59. We can trail stop loss at $41.3.
which is showing risk to reward is 1:2.
Analysis is made to best of my knowledge, if you are taking trade please make your own analysis . Thank you

READY TECH HOLDINGS LTDREADY TECH HOLDINGS LTD made double with divergence along MACD cross over and RSI UPTICK. We can go long with first target of $2.77 and Final target of $3.5 in short tern view.
We can seen minor support level at $2.9.
PLease make your own analysis before taking any trade. ASX:RDY

Coty | COTY | Long at $3.00NYSE:COTY , one of the world's largest beauty companies, is known for its extensive portfolio of fragrances, cosmetics, skincare, and body care brands, such as:
Adidas
Bourjois
Bozzano
Bruno Banani
Burberry
Calvin Klein
Cenoura & Bronze
Chloé
CoverGirl
David Beckham
Davidoff
Escada
Etro
Gabriela Sabatini
Gucci
Hugo Boss
Infiniment Coty Paris
Jawhara
Jil Sander
Joop!
Jovan
Kylie Cosmetics
Kylie Skin
Lancaster
Leger by Lena Gercke
Manhattan
Marc Jacobs
Marni
Max Factor
Mexx
Miss Sporty
Monange
Nautica
Orveda
Paixao
Philosophy
Rimmel
Risqué
Sally Hansen
Swarovski
Tiffany & Co.
Vera Wang
Technical Analysis
Price double bounced off the top level of my selected historical "crash" simple moving average band. While the price may dip further to touch the lower end of this band (low $2 zone), this band is typically where share accumulation begins before a price reversal. The price may trade sideways for some time or jettison up, but my long-term outlook will simply require patience. Growth projections are modest and hinge on the company's successful execution of strategic restructuring and turnaround plans, delivery on new product launches and growth initiatives, and leadership stability / clear catalysts. Thus, at $3.00, NYSE:COTY is in a personal buy zone and not recommended for the risk averse.
Targets into 2028
$3.50 (+16.7%)
$4.70 (+56.7%)

Put Sale on TSLLIm closing this Put Sale today, seems like I wont get PUT shares. Using cash for another trade.

Gold (1H) - Short-Term DiNapoli Context Near XOP CompletionGold is currently approaching the completion area of the prior upside swing, with the XOP target already reached. From a DiNapoli perspective, this zone often marks trend exhaustion or loss of upside momentum , especially in an extended market.
While the broader trend remains bullish and fundamental factors continue to influence price, the technical picture suggests slowing upside behavior. Price is trading in an overbought condition, and momentum indicators indicate the potential formation of a bearish reversal sequence , with a MACD crossover developing.
This context does not represent a long-term trend change, but rather a short-term corrective opportunity. If price confirms a downside reaction from the XOP area, fib node levels derived from the initial directional swing will serve as the primary downside objectives.

Looks bearish along trendlineThat 200 day looks like it's going to push price below rising support tomorrow.
Could be a double-bottom on smaller time frames though. Bears need to be careful.
NASDAQ:TLT

Smart Money Can Exit Their PositionThis video explains how smart money is able to exit their positions by operating as a coordinated group rather than as individual traders. The discussion focuses on how institutions plan exits using liquidity, timing, and market structure, and why these exits often occur without creating obvious signals for retail participants.
The objective of this video is to help understand smart money thinking, team-based execution, and exit behavior from a market-structure and price-action perspective—purely for learning and awareness, not for trade recommendations.

$GOLD Reached ANOTHER Weekly ATH CloseMaybe Peter Schiff was right 🥸
TVC:GOLD has its highest Weekly Close EVER, again.
If history repeats itself, crypto has a world of hurt ahead of it.
Is the Santa Rally cancelled!? 🤬🎅

SCHW's Weekly Pour: A Cup, a Handle, and a Bullish Refill?Been tracking SCHW, and this chart is shaping up to be something big—potentially a breakout from a range that’s been developing since early 2022. Price is pressing up against key resistance around $95-$100, and a clean break above this level could confirm a multi-year breakout, opening up the possibility of a much larger trend move. With Fibonacci extensions lining up at $150 and $200, this could be one of those slow-burn setups that eventually pays off in a big way. Let’s break it down.
Fibonacci Extensions and Multi-Year Price Targets
The way this chart is structured, $95-$100 is the final boss. If price convincingly clears that level, it breaks a massive range that’s been in place for over two years. If that happens, $150 (the 161.8% Fib extension) and $200 (the 261.8% extension) are the next major upside targets. These aren’t short-term price points—this is the kind of move that could play out over multiple years. But historically, when a stock coils for this long and then breaks out, the measured move potential is huge.
Moving Averages and Long-Term Trend Shift
Right now, we’ve got price trading above both the 50-week and 200-week moving averages, signaling that momentum has already started to shift. The 50-week MA is curling upwards, and if we see it hold above the 200-week, that would mark a long-term trend shift that typically aligns with sustained upside moves.
Mapping Out the Breakout Scenarios
If we do get a breakout, here’s how I see it playing out:
1️⃣ Break Above $100 → Multi-Year Uptrend Begins – A confirmed break and hold above $100 shifts the entire structure bullish, setting up an eventual run to $150 and possibly $200 over the next couple of years. This would be the full resolution of the pattern that has been developing since early 2022.
2️⃣ Rejection at $95-$100 → Pullback Before Breakout – If price gets stuffed at resistance, we could see a pullback to the $75-$80 zone before another breakout attempt later in 2025. This would act as a final shakeout before the bigger move.
----------------------------------------------------------
All eyes on $95-$100. That’s the level that determines whether this just grinds sideways for another year or finally starts a major new uptrend. If it breaks, we’ve got a clear roadmap to $150 and $200 in the coming years.
Curious if anyone else is watching this. Are we about to see the start of something big, or is there one more fakeout before the real move?
Not financial advice. Just charting things out. Let’s see what happens.

NVDA Daily Chart Breakdown: Trendline, Targets, and RiskNVDA remains in a strong long-term uptrend, but short-term price action shows a corrective / decision phase. Price is currently sitting on a major ascending trendline, near the 50-day SMA.
Current state:
• Primary trend: Bullish
• Price location: Key dynamic support
• Major resistance: 210 – 215 zone
Bullish Scenario (Bounce / Breakout)
If price holds the trendline and moves higher:
🎯 Targets
• Target 1: 200
• Target 2: 215
• Target 3: 235 – 240
🛑 Stop Loss
• Daily close below 175
📌 Rationale:
Healthy pullback into trend support → continuation of the bullish structure.
Bearish Scenario (Breakdown)
If price breaks below the ascending trendline:
🎯 Targets
• Target 1: 160
• Target 2: 145
• Target 3: 128
🛑 Stop Loss
• Recovery above 185
📌 Rationale:
Loss of dynamic support → deeper corrective phase.
Technical Summary
• Above trendline → Bullish bias
• Below trendline → Correction likely
• Current zone = High-impact decision area
Brief Fundamental Outlook – NVIDIA
• Bullish drivers:
• Explosive AI & data center demand
• Strong margins and revenue growth
• Dominant position in AI chips
• Risks:
• High valuation
• Tech sector & interest rate volatility
Fundamental Takeaway:
As long as the AI supercycle continues, NVDA remains structurally bullish.

A continued crash to $45k for Bitcoin? - December 2025Bitcoin has 5 days to stop the current candle body print under the 11 day 50SMA. Throughout the entire history of Bitcoin, a candle body close under this level has meant a test of the 11 day 200SMA. It is that simple. Never a false signal.
Here are all the historical data points:
50SMA on the 11 day chart throughout all Bitcoin history
At the moment the candle prints as a Gravestone DOJI.
Zoom in a little further to the 3 day chart and you can see price action follows the 200SMA. Does not matter what the asset is, anytime you see this, it is a sign of weakness. Look left. Regardless of asset, a complete collapse typically follows. Even if price action staggers like a drunken sailor finding his way back to port.
The idea " Is a Bitcoin crash to $40–45k next? – October 2025 " published around $120k made the break of market structure very clear. This idea is a continuation of the same break of structure. The spite continues to pour in for this idea. The market does not care.
Micheal Saylor's lenders will likely become very nervous should this continuation confirm. A forced liquidation of Strategy would be the best thing that could happen to the Bitcoin space in my opinion as the cash to pay out Dividends must come from somewhere, and that means selling Bitcoins. In an already depleted marketplace. Have noticed influencers gaslighting audiences with "Black rock" is buying your panic selling at this time posts.
Conclusions
Let’s not dress this up like a TED Talk. Bitcoin has five days to avoid doing the thing it has never once avoided in its entire history. That’s not drama, that’s statistics, the boring kind that ruins hopium.
A confirmed candle body close under the 11-day 50 SMA has always resulted in a test of the 11-day 200 SMA. No exceptions. No “yeah but this time BlackRock…”. No spiritual awakening mid-candle. Just gravity doing what gravity does.
At present, price is printing a gravestone DOJI. Which, despite the name is not a bullish candle, unless you’re a fan of irony or funerals.
The break of market structure was identified months ago near $120k, when optimism was peaking and common sense was being shouted down by people with laser eyes and affiliate links. Since then, price action has done exactly what broken structure does: grind, fail, and roll over.
A move toward $45k is not a prediction pulled from thin air, it’s a mechanical outcome if the current signal confirms. If that level is reached, it will be framed as a “black swan”, despite being broadcast loudly, publicly, and repeatedly in advance by yours truly.
As for the Saylor situation, leverage works both ways. Lenders get nervous. A forced seller in a thin market is never bullish, no matter how many times “BlackRock” is whispered like a protective spell. If this cascade happens, it won’t kill Bitcoin. It will do something far worse to the influencers: it will expose them. And frankly, that might be the healthiest thing this market has seen in years.
Ww
Disclaimer
==============================================================
This is not financial advice.
It is not a call to panic, sell the bottom, or tweet angrily at strangers. Markets can invalidate any thesis at any time. If price action reclaims structure and closes decisively back above key moving averages, this outlook changes. Loyalty to a chart after it’s wrong isn’t conviction, it’s just stubbornness with a Wi-Fi connection.
If you’re trading with leverage, emotion, or borrowed confidence from YouTube thumbnails, none of this will save you. If you’re trading probabilities, history, and structure, then this is simply the chart doing what it has always done, while people insist it won’t.

How To Plan Trend-Line Breakout TradeThis video explains how a trend-line breakout develops and how to plan a trade around it using market structure and price behavior. The discussion focuses on identifying a valid trend-line, understanding breakout conditions, observing confirmation and follow-through, and planning a structured approach based on logic rather than emotions.
The objective of this video is to help understand the process behind trend-line breakouts and how trade planning can be approached from a price-action perspective, purely for learning and awareness—without providing any trading or investment recommendations.

BNB About to Crash Hard or Just Faking You Out?Yello Paradisers, is BNB setting up for a major dump, or is this just another trap for impatient traders? This next move could catch a lot of people off guard if they're not paying attention to key levels.
💎BNBUSDT is currently looking bearish, as it's reacting strongly from a key resistance zone. This level is further reinforced by the 200 EMA, making it a significant area of confluence. On top of that, price has recently broken down from an ascending channel, which adds further confirmation to the potential shift in trend direction. When these signals line up like this, the probability of a bearish move increases substantially.
💎Now, ideally, we want to see a pullback into the resistance zone. That would give us a much better risk-to-reward entry for a potential short. However, entering blindly is never the move — we need clear confirmation. Specifically, we’ll be watching for a strong bearish candlestick pattern to form right at the resistance zone. If we get that, we can then expect a move toward the next liquidity zones and support levels below.
💎That said, we must stay objective. If BNB manages to break above the invalidation level and closes a candle beyond that point, it will completely invalidate the current bearish outlook. In that scenario, it's better to stay out and wait patiently for stronger price action to develop. There’s no need to force trades when the setup isn't perfect.
🎖Strive for consistency, not quick profits. Treat the market as a businessman, not as a gambler.
MyCryptoParadise
iFeel the success🌴

$HOOD PUT SaleBullish on HOOD, I would be buying shares at this level, however I want to see if able to get a better price below by selling a very close PUT

Two or one leg down to 23850 again
From Thursday's closed around 25 000, looks to me, like the downtrend channel may be maintained, with todays breakout failing. The 4 hourly rose up and was rejected at the 150 sma (pink arrow). So thinking it now will retest the 23850 lows.
I think it will do this in a 2 leg more or less equal measured move down. At an estimate first to ~24350, then less of a rally than the last couple we have had, and more of a slow retrace back to ~24500 - more flag like, then down 23850 ish. Though it could potentially do that in one move on friday. Possible, but a bit of a stretch for one day though, unless some rather dire news happens to coincide tomorrow. The visible range volume profile certainly seems to adequately accommodate a move to 24350, with little problem, while less so to ~24000k in my interpretation, yet, i still feel the price will need to go there as a significant low.
Of interest, it is also setting up to look similar to a period of last months chart - see set of three thin black arrows. If it stays similar this pattern, then that would suggest a one leg down move, like we had then. But that is a less probable scenario i think, barring any particularity bad news event. So this similarity is mentioned more as a point of interest, as it doesnt have a technical basis of which i am aware.
This could all be a load of nonsense of course, and it breaks out back up!

Alibaba May Be Breaking DownAlibaba climbed sharply in September, but some traders may think it’s giving back the gains.
The first pattern on today’s chart is the failed rally after the last earnings report on November 25. BABA has made lower highs since that session, resulting in a potentially bearish descending triangle.
Second, prices closed below the triangle’s bottom yesterday. Could that represent a breakdown?
Third, last month’s peak continued a succession of lower weekly highs. Prices are also below the 50-day simple moving average. Those signals may be consistent with a bearish intermediate-term trend.
Next, MACD is falling and the 8-day exponential moving average (EMA) is below the 21-day EMA. Those signals may reflect a bearish short-term trend.
Finally, BABA is an active underlier in the options market. (It’s averaged 166,000 contracts per session in the last month, according to TradeStation data.) That may help traders take positions with calls and puts.
TradeStation has, for decades, advanced the trading industry, providing access to stocks, options and futures. If you're born to trade, we could be for you. See our Overview for more.
Past performance, whether actual or indicated by historical tests of strategies, is no guarantee of future performance or success. There is a possibility that you may sustain a loss equal to or greater than your entire investment regardless of which asset class you trade (equities, options or futures); therefore, you should not invest or risk money that you cannot afford to lose. Online trading is not suitable for all investors. View the document titled Characteristics and Risks of Standardized Options at www.TradeStation.com . Before trading any asset class, customers must read the relevant risk disclosure statements on www.TradeStation.com . System access and trade placement and execution may be delayed or fail due to market volatility and volume, quote delays, system and software errors, Internet traffic, outages and other factors.
Securities and futures trading is offered to self-directed customers by TradeStation Securities, Inc., a broker-dealer registered with the Securities and Exchange Commission and a futures commission merchant licensed with the Commodity Futures Trading Commission). TradeStation Securities is a member of the Financial Industry Regulatory Authority, the National Futures Association, and a number of exchanges.
Options trading is not suitable for all investors. Your TradeStation Securities’ account application to trade options will be considered and approved or disapproved based on all relevant factors, including your trading experience. See www.TradeStation.com . Visit www.TradeStation.com for full details on the costs and fees associated with options.
Margin trading involves risks, and it is important that you fully understand those risks before trading on margin. The Margin Disclosure Statement outlines many of those risks, including that you can lose more funds than you deposit in your margin account; your brokerage firm can force the sale of securities in your account; your brokerage firm can sell your securities without contacting you; and you are not entitled to an extension of time on a margin call. Review the Margin Disclosure Statement at www.TradeStation.com .
TradeStation Securities, Inc. and TradeStation Technologies, Inc. are each wholly owned subsidiaries of TradeStation Group, Inc., both operating, and providing products and services, under the TradeStation brand and trademark. When applying for, or purchasing, accounts, subscriptions, products and services, it is important that you know which company you will be dealing with. Visit www.TradeStation.com for further important information explaining what this means.

Gold (XAUUSD) – Daily Technical AnalysisGold is in a strong bullish trend, trading well above the 50-day SMA, which acts as a dynamic support. Price is currently testing a major historical resistance zone at 4,380 – 4,400.
Current state:
• Primary trend: Bullish
• Short-term momentum: Weakening near resistance
• SMA 50: Dynamic support
Bullish Scenario (Breakout)
If price breaks and holds above 4,400:
🎯 Targets
• Target 1: 4,600
• Target 2: 4,850
• Target 3: 5,100
🛑 Stop Loss
• Daily close back below 4,300
📌 Rationale:
Breakout above historical resistance → continuation of the bullish impulse.
Bearish / Corrective Scenario (Rejection)
If price gets rejected from 4,380 – 4,400:
🎯 Targets
• Target 1: 4,140 (50 SMA)
• Target 2: 3,950
• Target 3: 3,700
🛑 Stop Loss
• Daily close above 4,400
📌 Rationale:
Healthy pullback within a broader bullish structure.
Technical Summary
• Above 4,400 → Strong bullish continuation
• 4,140 – 4,400 → Decision zone
• Below 4,140 → Deeper correction, macro trend still bullish
Brief Fundamental Outlook – Gold
• Bullish drivers:
• Potential monetary easing
• Geopolitical uncertainty
• Central bank accumulation
• Risks:
• Stronger USD
• Rising bond yields
Fundamental Takeaway:
As long as gold holds above 4,000, the long-term bullish structure remains intact.

USD/JPY Rises Ahead of BoJ Decision as Traders Assess OutlookUSD/JPY rose 0.6% through midday trading on Wednesday as the Japanese Yen weakened against other currency pairs. The dollar remains slightly weaker against the Yen since the start of the month following several months of weakness in the Japanese currency.
Since April, USD/JPY has risen over 10% with the Bank of Japan (BoJ) failing to satisfy hawkish policy expectations. The fiscal situation in Japan hasn’t helped the currency, as Prime Minister Sanae Takaichi’s spending plan has bolstered debt concerns.
Meanwhile, the Bank of Japan has grown more confident in its outlook that the economy and inflation will meet targets. Rate cut bets for the Federal Reserve have also strengthened, which perhaps leaves further dollar appreciation versus the Yen in question.
The BoJ also expects wage gains to keep pace next year, according to a survey released earlier this week. With December rate hike now being mostly priced into the currency, traders will look for signals from the BoJ on the path of rate hikes.
Technically, USD/JPY is trading in a bull flag pattern, with a double bottom pattern formed. Yesterday’s prices dropped below the 35-day exponential moving average (EMA) before finishing the session back above the level. Now, prices have overtaken the 21-day EMA.
A break above trendline resistance in the flag pattern would give way to a continuation of the previous trend. Traders would target the 158 level where prices stalled just below back in November.
Thursday night’s BoJ decision will ultimately hold the key to forward price action, with the decision expected to cross the wires around midnight ET. The announcement is expected to yield the second rate hike of the year, but forward guidance will most likely be the driver of USD/JPY price action into the weekend.

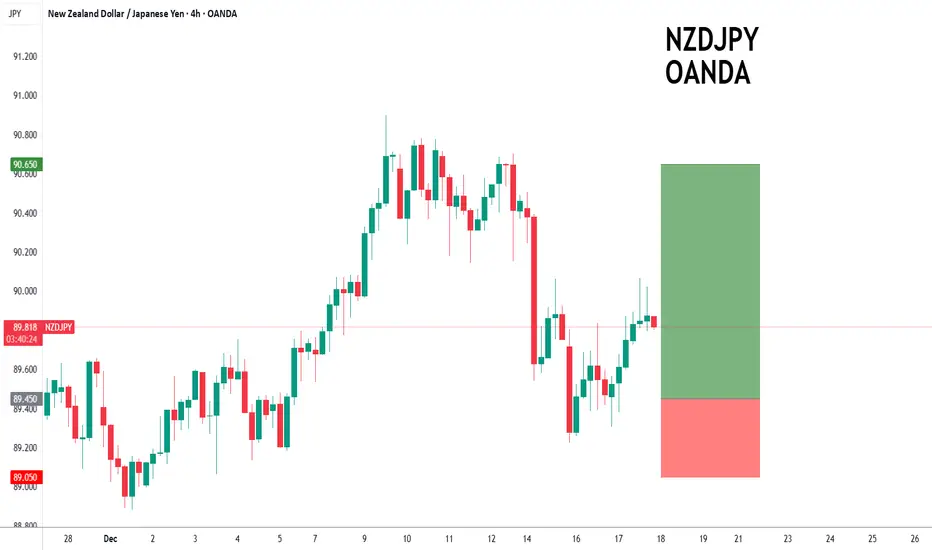
NZDJPY to continue in the upward move?NZDJPY - 24h expiry
Early pessimism is likely to lead to losses although extended attempts lower are expected to fail.
20 1day EMA is at 89.44.
We look for a temporary move lower.
Dip buying offers good risk/reward.
Our outlook is bullish.
We look to Buy at 89.45 (stop at 89.05)
Our profit targets will be 90.65 and 90.95
Resistance: 90.06 / 90.30 / 90.90
Support: 89.54 / 89.23 / 88.88
Risk Disclaimer
The trade ideas beyond this page are for informational purposes only and do not constitute investment advice or a solicitation to trade. This information is provided by Signal Centre, a third-party unaffiliated with OANDA, and is intended for general circulation only. OANDA does not guarantee the accuracy of this information and assumes no responsibilities for the information provided by the third party. The information does not take into account the specific investment objectives, financial situation, or particular needs of any particular person. You should take into account your specific investment objectives, financial situation, and particular needs before making a commitment to trade, including seeking, under a separate engagement, as you deem fit.
You accept that you assume all risks in independently viewing the contents and selecting a chosen strategy.
Where the research is distributed in Singapore to a person who is not an Accredited Investor, Expert Investor or an Institutional Investor, Oanda Asia Pacific Pte Ltd (“OAP“) accepts legal responsibility for the contents of the report to such persons only to the extent required by law. Singapore customers should contact OAP at 6579 8289 for matters arising from, or in connection with, the information/research distributed.
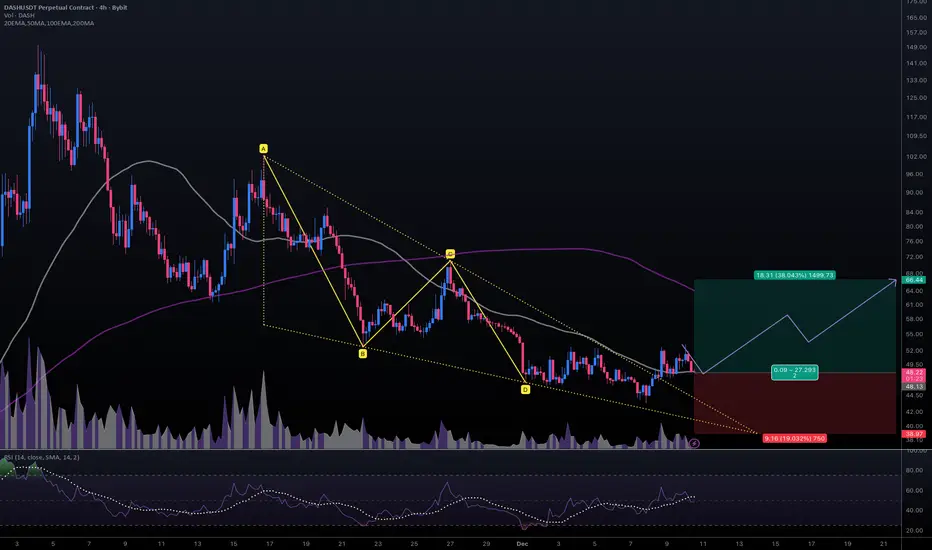
#DASHUSDT #4h (ByBit) Falling wedge breakout and retest [LONG]Digital Cash is pulling back to 50MA regained support where it seem likely to bounce towards 200MA resistance.
⚡️⚡️ #DASH/USDT ⚡️⚡️
Exchanges: ByBit USDT
Signal Type: Regular (Long)
Leverage: Isolated (2.0X)
Amount: 5.3%
Current Price:
48.22
Entry Targets:
1) 48.13
Take-Profit Targets:
1) 66.44
Stop Targets:
1) 38.97
Published By: @Zblaba
CRYPTOCAP:DASH BYBIT:DASHUSDT.P #4h #DigitalCash #Privacy dash.org
Risk/Reward= 1:2.0
Expected Profit= +76.1%
Possible Loss= -38.1%
Estimated Duration= 1-2 weeks
EUR/USD Holds Above 1.1700 Ahead of ECB MeetingEUR/USD traded with mild downward pressure today as market focus stays squarely on macroeconomic news. A mixed U.S. labor market picture, with job growth present but unemployment rising, has left the greenback somewhat bid in the first half of Wednesday. The Euro continues to benefit from expectations that the European Central Bank will hold rates steady, in contrast to markets pricing further Federal Reserve easing next year. With the Dollar Index near multi-month lows, EUR/USD remains sensitive to shifts in sentiment around U.S. policy and data.
In the above chart, EUR/USD rates have started to settle in above 1.1700, holding the mid-October swing high as support during the recent meander. While then pair was rejected at 1.1800 yesterday, the 5-day exponential moving average (EMA) has proved as support, suggesting short-term momentum remains firm. Some traders may see an inverse head and shoulders pattern or a cup and handle in price action over the past three months; either way, both interpretations suggest that EUR/USD has bottomed and the path of least resistance is higher in the near-term.

Alphabet May Be OversoldAlphabet has pulled back after hitting a new all-time high, and some traders may think it’s oversold.
The first pattern on today’s chart is the rally between November 14 and November 25. The Internet giant held its ground yesterday after retracing half the advance, which may confirm its direction is pointing higher.
Second, GOOGL has bounced multiple times at its 21-day exponential moving average (EMA). It returned to the same EMA yesterday. Will that lure trend followers?
Next, stochastics have dipped to an oversold condition.
Finally, GOOGL is an active underlier in the options market. That could help traders take positions with calls and puts.
TradeStation has, for decades, advanced the trading industry, providing access to stocks, options and futures. If you're born to trade, we could be for you. See our Overview for more.
Past performance, whether actual or indicated by historical tests of strategies, is no guarantee of future performance or success. There is a possibility that you may sustain a loss equal to or greater than your entire investment regardless of which asset class you trade (equities, options or futures); therefore, you should not invest or risk money that you cannot afford to lose. Online trading is not suitable for all investors. View the document titled Characteristics and Risks of Standardized Options at www.TradeStation.com . Before trading any asset class, customers must read the relevant risk disclosure statements on www.TradeStation.com . System access and trade placement and execution may be delayed or fail due to market volatility and volume, quote delays, system and software errors, Internet traffic, outages and other factors.
Securities and futures trading is offered to self-directed customers by TradeStation Securities, Inc., a broker-dealer registered with the Securities and Exchange Commission and a futures commission merchant licensed with the Commodity Futures Trading Commission). TradeStation Securities is a member of the Financial Industry Regulatory Authority, the National Futures Association, and a number of exchanges.
Options trading is not suitable for all investors. Your TradeStation Securities’ account application to trade options will be considered and approved or disapproved based on all relevant factors, including your trading experience. See www.TradeStation.com . Visit www.TradeStation.com for full details on the costs and fees associated with options.
Margin trading involves risks, and it is important that you fully understand those risks before trading on margin. The Margin Disclosure Statement outlines many of those risks, including that you can lose more funds than you deposit in your margin account; your brokerage firm can force the sale of securities in your account; your brokerage firm can sell your securities without contacting you; and you are not entitled to an extension of time on a margin call. Review the Margin Disclosure Statement at www.TradeStation.com .
TradeStation Securities, Inc. and TradeStation Technologies, Inc. are each wholly owned subsidiaries of TradeStation Group, Inc., both operating, and providing products and services, under the TradeStation brand and trademark. When applying for, or purchasing, accounts, subscriptions, products and services, it is important that you know which company you will be dealing with. Visit www.TradeStation.com for further important information explaining what this means.
