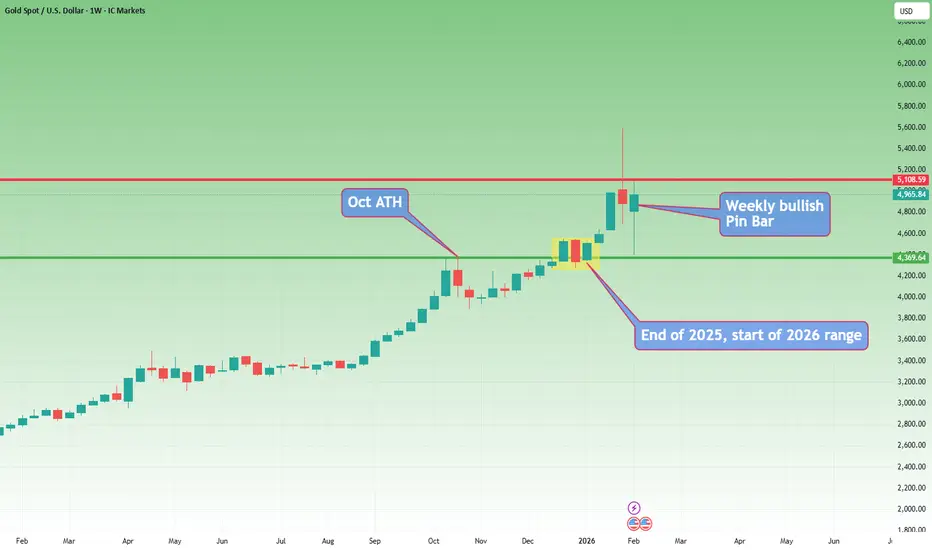
Gold- From weekly to 15m chart. Where are the trades?These days, everyone has an opinion on Gold.
Most of them are bullish.
And to be fair — so am I.
But here is what many traders either don’t understand or simply ignore:
There is a huge difference between having an opinion and having a tradable opinion.
A tradable opinion is one that can actually be executed in the market, with leverage, risk control, and realistic stops — not just a direction on a chart.
This analysis is not about saying “Gold is bullish, it will go to 6k or 7k, I’m a genius if it does.”
It’s about giving traders something they can actually work with.
🔎 Weekly Chart — Big Picture Reality
Three things stand out immediately:
1️⃣ The 5600 → 4400 drop
Yes, it was massive:
- ~12,000 pips
- large in percentage terms
- emotionally shocking
But in long-term trend terms?
👉 Just a correction.
Even if we measure only the 2025 rally, the drop didn’t even reach a 50% retracement.
2️⃣ Technical respect of structure
The decline stopped almost exactly at the October 2025 ATH, which acted as support.
Markets remember levels.
This is not random.
3️⃣ Alignment with congestion
The drop also aligned with:
- the late-December congestion zone
- the starting price of 2026
The first prices of the year often act as major S/R zones.
This is classic market behavior.
✅ Conclusion from Weekly:
Trend is bullish. No debate here.
❌ But tradable?
Not really.
Why?
Because a correct structural stop would be ~8,000 pips away.
With leverage, that’s not trading — that’s praying.
🔎 Daily Chart — Still Bullish, Still Not Tradable
On the daily:
- clean reversal from support
- first impulsive leg up
- pullback forming a higher low
- recent Piercing Line bullish pattern
Again:
✅ Bullish structure
❌ Not tradable structure
A proper stop still sits ~4,000 pips away.
That’s not risk management.
🔎 15-Minute Chart — Where Trading Actually Happens for me lately
Given current volatility, this is what matters these days
Here’s what we see:
- initial rally in a rising wedge
- rejection from resistance
- drop from 5100 → 4650 contained within a bullish flag relative to the impulse
- breakout above flag resistance
- continuation toward 5k
- NY close near highs
Structurally?
👉 Still bullish.
But even here:
❌ Buying blindly at 4965 makes no sense.
We need a dip.
We need structure.
We need asymmetric risk.
📌 The Two Buy Zones That Make Sense
If price offers them:
✅ 4900
✅ 4800
Those are the zones where risk/reward becomes logical.
⚠️ The Reality Most Traders Don’t Want to Hear
Even on a 15M chart:
- stops of 300–500 pips are normal
- targets should be well above 1,000 pips
Let’s be honest:
Bragging about a 100-pip Gold target these days is like bragging about a 2-pip win on a EURUSD trade.
simply not trading...
✅ Final Conclusion
✔️ Gold is bullish
✔️ I will look to buy dips
✔️ But only with structure and discipline
Because in this environment:
- volatility is extreme
- emotions are expensive
- precision matters more than bias
A trader’s job is not to be right.
A trader’s job is to make money.
And those are two very different things. 🚀
P.S.
And yes — if I see a clear reversal structure on the 15-minute chart, I can take a short trade, even if my overall bias on Gold remains bullish.
This does not contradict my opinion.
It simply reflects the reality that:
You can be bullish on the bigger picture and still trade short-term corrections.
Have a nice Saturday!
Mihai Iacob
Multiple Time Frame Analysis
BTC To the moon?Bitcoin (BTC/USD) is currently positioned in a critical demand zone, which I believe represents a strong accumulation area for buyers. This zone has historically acted as a support level where significant buying interest emerges, preventing further downside and setting the stage for upward momentum.
From a technical perspective:
The price is consolidating around this demand area, showing signs of reversal with increasing volume and bullish candlestick patterns.
Key support levels in this zone are holding firm, aligning with Fibonacci retracement levels from the previous bull run.
I anticipate a strong bullish impulse from here, targeting $120,000 as the primary upside objective.
This target is derived from measured moves based on prior wave extensions and resistance projections.
Risk management: Place stops below the demand zone to protect against invalidation.
This is not financial advice; always DYOR.

XAUUSD 30-min – High Probability Short Setup (SMC/ICT)🚨 HIGH PROBABILITY SHORT SETUP – XAUUSD 30-min
Entry Zone: 4,985 – 4,995
(Confluence: Order Block + FVG Fill + Previous Resistance)
Stop Loss: 5,010
(Above recent high and FVG)
Target 1: 4,880 (Liquidity Pool)
Target 2: 4,840 (Support Zone)
Target 3: 4,720 (Break of Structure Extension)
✅ WHY THIS SETUP WORKS:
BOS Confirmed – Market structure broken bearish
Order Block Resistance – Strong supply zone at 4,988.85
FVG Above Price – Likely to be filled before continuation down
Liquidity Below – Price drawn to 4,880 liquidity pool
CHoCH Present – Momentum shifted bearish
🎯 EXECUTION PLAN:
Wait for price to fill FVG/Order Block zone (4,985-4,995)
Enter short on bearish 30-min rejection candle
Stop Loss at 5,010 (above structure)
Move to breakeven after hitting 4,940
Take partial profits at 4,880 & 4,840
⚠️ RISK WARNING:
Only trade with confirmed rejection
Avoid if price breaks above 5,010
Monitor lower timeframe for entry timing

Underwhelming move to $3k for Ethereum - February 2026The most underwhelming move in Ethereum’s history is about to print over the next few months. I say underwhelming because 50% forecast in a market that can drop the same amount in a few hours is.. underwhelming if not depressing. Regardless, they’ll call it a win.
A 50% gain to $3k is where price action was in April 2021. Six years of nothing is not a win, it’s a sad confirmation of an asset no one needs or uses. Do you remember a strong Ethereum run in the past was indication of a strong alt season? The same will be true in reverse. This forecast is not a trading opportunity, it’s an escape hatch to exit a toxic, obsolete, and technological redundant asset class.
The black circles are the last three long and short ideas published by Ww. Click over the little triangles to see the idea, and more amusingly the comments that attempt to denounce the idea. Emotion in liquid form is a valuable commodity to help us understand the validity of an idea.
On the above 8 day chart price action has dropped around 60% since the shared a “mind idea” at 3500 in November past. Had zero bok to publish an idea. And that’s annoying because now there would be 4 little triangles. Auf jeden fall…
Why long now?
Price action, believe it or not, is in an uptrend. A break of the recent upper support was made as price action fell to the next resistance. If a lower high is to print, confirming a larger trend reversal, then the upper support shall confirm resistance, which is around $3k.
Conclusions
In conclusion, the anticipated 50% move to $3,000 represents not a triumph but a failure. It would merely return Ethereum to a price level first seen six years ago, confirming its stagnation and technological redundancy. This forecast bounce is not an opportunity for profit, but a final exit signal, a chance to leave an obsolete asset class before the broader multi year downtrend to lower lows.
Ww
==========================================
Disclaimer
Right, look. Before you get all excited or start crying into your ledger, a quick word. This isn't financial advice. I'm not your dad, I'm not a wizard, and I definitely don't care if you lose your house. I'm just a bloke pointing at a graph, having a giggle.
The idea that Ethereum shuffling back to a price it had when The Queen was still alive is being spun as a "win" is... well, it's clucking tragic, isn't it? It's like celebrating your hairline returning to where it was in 2018. It's not a comeback; it's a confession.
So, if you're one of those sentient beard-strokers who thinks this digital beanbag is the future because it can run a cartoon monkey casino slightly slower than a 1998 Tamagotchi... brilliant. Knock yourself out. Buy it. Mortgage your mum's shed. I genuinely hope it goes to the moon for you, because the resulting documentary when it all goes wrong will be hilarious.
But for the love of God, don't come whinging to me when this supposed "breakout" turns out to be the financial equivalent of a death rattle and you're left holding a bag of obsolete code. You were warned. It's not my fault you thought "decentralised" meant "can't go to zero."

Long trade 📈 EURJPY — Buy-Side Sentiment Analysis (15-Minute)
Observed: Mon 26th Jan 2026
Session: London AM
Time Reference: 6:00 am (NY time)
📌 Trade Details
Entry: 186.241
Take Profit: 187.418 (1.86%)
Stop Loss: 185.954 (0.14%)
Risk–Reward: 12.89R
🟢 Directional Bias
Buy-side reversal → continuation:
Price action indicates a completed sell-side run, followed by institutional absorption and a controlled transition back into bullish order flow.
🧠 Market Sentiment Overview
An extended bearish leg engineered downside liquidity
Sell-side liquidity swept clean into the 182.00 handle
Aggressive rejection from the lows signals sell-side exhaustion
Buyers stepped in decisively → sentiment flipped from risk-off to accumulation.
🧩 Structural Context
Bearish structure completed its objective (equal lows / sell-side pool)
Sharp displacement higher confirms local bullish BOS
The market transitioned from deep discount back toward equilibrium
Structure now supports mean reversion higher, not continuation lower.
📊 Volume Profile & Value
Heavy volume absorption at the lows
Value began migrating higher post-sweep
Acceptance above in the raday value confirms a bullish auction response
🟦 PD Arrays / Fair Value Gaps
Multiple bullish FVGs formed on the impulse from the lows
Entry aligns with discount mitigation inside bullish inefficiency
No clean inefficiencies left below → downside fuel largely removed
⏱️ Session Behaviour
London AM delivered the true low of the move
Classic session profile:
Asia consolidates → London sweeps → expansion follows
NY continuation his ighly probable if the structure holds
🎯 Trade Logic
Sell-side liquidity fully taken
The market showed immediate bullish displacement
Pullbacks are shallow and supported
Buyside liquidity resting above prior highs acts as a magnet
⚠️ Invalidation Criteria
Failure to hold above the reclaimed structure
Bearish displacement back into discount
Acceptance below post-sweep low
Until then, buy-side bias remains valid.
🧾 Summary
EURJPY shows buy-side sentiment following a completed sell-side liquidity sweep and strong bullish displacement. Absorption at the lows and acceptance back above the value support mean reversion toward premium liquidity.

NVDA 1D: Pause before the next chipOn the daily chart NVIDIA has shifted from a strong impulsive advance into a consolidation phase. After printing new local highs, price formed a contracting structure, broke higher, and returned for a retest of the breakout area. Selling pressure remains limited, with no follow-through to the downside, suggesting a pause within trend rather than a reversal.
Structurally, price action reflects consolidation inside a broader uptrend. The 185–190 area remains the key holding zone, where price stabilized after the retest and continues to trade above the 100-day moving average. Higher lows are preserved, keeping the higher timeframe structure intact. MACD holds above the zero line, while ADX continues to decline, confirming compression rather than directional expansion.
The primary reaction level sits near 212, marking the upper boundary of the current consolidation. Acceptance above this level would allow for continuation toward the 230–232 area, aligning with the upper expansion of the range. A failure to hold the 185-190 zone would shift price into a wider neutral structure without confirmation of trend continuation.
Fundamentally, NVIDIA remains strong. Q3 2025 EPS came in at 1.30 USD, with Q4 2025 EPS estimated at 1.52 USD ahead of the February 26, 2026 earnings release. Revenue reached 57.01B USD in Q3, with expectations of 65.56B USD for Q4. Cash flows remain robust, with operating cash flow at 83.16B USD and free cash flow at 77.32B USD. Compute and Networking continues to be the dominant revenue driver.
As long as structure holds, the market remains in digestion mode following the prior impulse.
Price action leads before fundamentals follow.

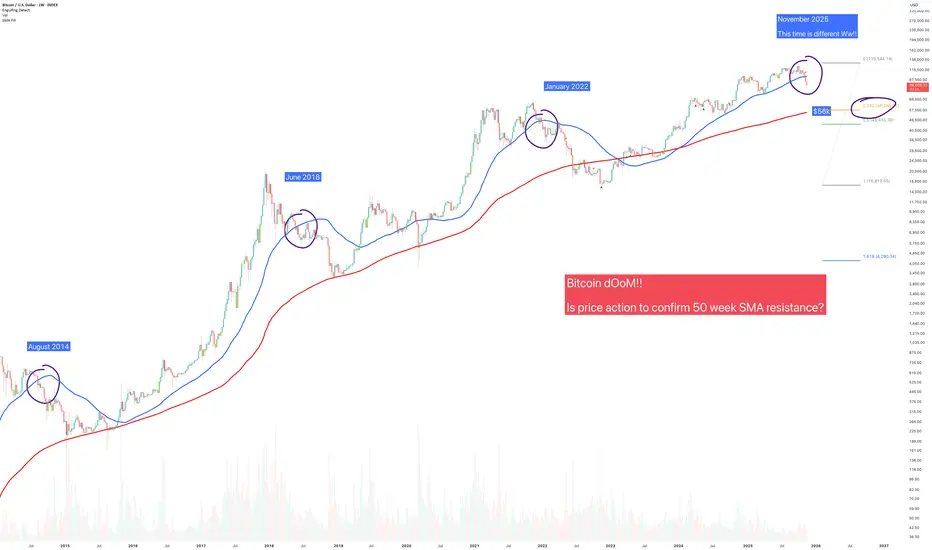
Is a crash to $56k about to occur for Bitcoin? - November 2025The above chart been brought to my attention by a number of folks asking for an opinion. So here it is.. remember, am just a messenger not target practice.
Price action shown on the above weekly chart has closed under the 50 week SMA, or so I’m told.
“Is that it? The top now in Ww?”
Look left, if you’re using two moving averages:
50 week SMA (blue)
200 week SMA
Then for you, the top is in. It’s over, go home. Congratulate yourself once again for providing exit liquidity for those that entered long positions at $15k. They have your everlasting thanks.
What's the hullabaloo?
Throughout the history of Bitcoin a test of the 200 weekly SMA occurred every time price action closed under the 50 week SMA. That’s not up for debate, it is a chart fact. Today that would be a highly predictable test of $56k, which is also the Fibonacci 0.38.
This forecast is going to upset a lot of people. The influencers promised them tales for fortune and glory. Instead.. they got a lesson in basic economics, but they had to pay $50,000 for it. You don't get refunds for stupidity, do ya?
Is this time different?
It is not possible to tell right now. Many might look at the chart and quit, they’ve had enough. That would be a mistake. Why? Confirmation.
Look left. Always look left. Until Monday 24th, November it is not known if the break of the 50 week is confirmed. Indeed if you take a closer look, price action has not actually closed a weekly candle body under the 50 week SMA, it has closed through it. That’s important.
Today
January 2022 Confirmation
June 2018 Confirmation
August 2014 Confirmation
Conclusions
So here we are again, Bitcoin teetering on the edge, influencers chanting “bull market!” like it’s a religion, and yet… there’s that nasty little blue line.
Price action under the 50-week SMA has never ended well. Not once. Every single time, without exception, it’s been followed by a cozy trip down to the 200-week SMA. Historically, that’s what Bitcoin does, it falls until it hits something red and expensive looking, then everyone acts surprised.
And where’s that level today? About $56k. Right on the Fibonacci 0.38. It’s like gravity with maths. But before you light the torches and start the “Ww’s turned bearish” posts, calm down. The candle hasn’t confirmed yet. That’s right, you’ve got until Monday, November 24th to find out if this is the real deal or just another fake-out designed to make you question every life decision since buying at $110k.
Look left. Every time price closed through the 50-week, the same story played out:
August 2014: crash.
June 2018: crash.
January 2022: crash.
It’s basically Bitcoin’s version of Groundhog Day, but without Bill Murray or the happy ending.
If it confirms below that line, that’s it. The 200-week SMA becomes the magnet.
If not, we’ll bounce, the influencers will return, and everyone will convince themselves they knew all along.
Either way, I’m not saying “doom.” I’m just saying, maths, it works.
Ww
Disclaimer
===============================================================
This isn’t financial advice. Obviously. If you’re taking investment cues from a bloke with a sense of humour about market collapses, you might want to re-evaluate your decision making process.
If you sell here and it pumps that’s on you.
If you hold and it dumps, that's also on you.
If you blame “market manipulation,” congratulations, you’ve just described every loser in crypto since 2017.
I don’t have a crystal ball, just charts and they don’t lie, even if people do. So whether Bitcoin crashes to $56k, or rallies to $160k, or starts taking payments in “Hopium,” I’ll still be here, tea in hand, smirking, watching the comments fill up with “You were wrong!” from people who were never right. Without Worries (Ww)
“Look left, not up.”
AUDCAD (AC) - Bullish | HTF Premium & Cautionary ObservationHigher Time Frame Bias
AUDCAD remains bullish, printing higher highs and higher lows. Price recently confirmed a high by sweeping internal liquidity, validating the HTF bullish structure.
Observation & Midterm Context
• There are two key zones to note:
1. Thin, small orange zone near the inducement sweep → low probability area, risky to take early positions
2. Large, visible orange order block → high probability zone for bullish continuation if price respects market cycle phases
• Currently, price is dancing in premium territory, increasing the chance of distribution and manipulation
• For a clean bullish confirmation, price would need to sweep buy-side liquidity above the highs and show a structural shift, which has not occurred yet
Execution & Mindset
• Focus only on high probability zones (the large orange OB)
• Sit on hands, track footprints, and speculate quietly until alignment
• Avoid early inducements that flush weak participants or counter-trend traders
Patience & Edge
Patience is the key.
Tracking is the edge.
Observe structure, market footprints, and HTF behavior before committing — this discipline preserves the subtle 1% edge in rare market conditions.

OG Fan Token OG to print 200% upside more to resistanceOn the above 8 day chart price action has corrected 90% since October on this football token.
Resistance is around 200% above current price action with RSI at ridiculously oversold levels for this timeframe. There's many more technical reasons for being bullish, but time is limited for usual waffle.
Is it possible price action falls further? Sure.
Is it probable? No.
Start scaling out after $8 or wait for a probability condition to print.
Ww
==============================================
Disclaimer
This idea is for educational and informational purposes only. It is not financial advice. Cryptocurrency trading carries significant risk of loss and is not suitable for all investors. Always conduct your own research (DYOR) and consider consulting a qualified financial advisor before making any investment decisions. Past performance is not indicative of future results.

XAU/USD 06 February 2026 Intraday AnalysisH4 Analysis:
-> Swing: Bullish.
-> Internal: Bullish.
Analysis and bias to remain the same as analysis dated 02 February 2026.
Price has printed as per analysis dated 22 January where I mentioned price to print bearish CHoCH to indicate bearish pullback phase initiation.
Price is now trading within an established internal range.
Intraday expectation:
Price to react at either discount of 50% internal EQ, or H4 supply zone before targeting weak internal high priced at 5,602,225.
Note:
The Federal Reserve’s renewed easing cycle, alongside a weaker U.S. dollar and persistent geopolitical tensions, continues to drive volatility in the gold market.
Traders should remain cautious and adjust risk management strategies to navigate sharp price swings.
Additionally, gold pricing is highly sensitive to U.S. policy under President Trump, where tariff measures, fiscal uncertainty, and shifting geopolitical strategy amplify market repricing risks and reinforce safe‑haven demand.
H4 Chart:
M15 Analysis:
-> Swing: Bullish.
-> Internal: Bearish.
Analysis and bias to largely remain the same as analysis dated 02 February 2026. I have added to intraday expectation with respect to alternative scenario.
Price has printed according to analysis dated 30 January 2025 where I mentioned, in alternative scenario, price could print a bearish iBOS as all HTF's require a pullback.
This is exactly how price printed.
Price has since printed a bullish CHoCH to indicate bullish pullback phase initiation.
Price is currently contained within an established internal range.
Intraday expectation:
Price trade up to either M15 supply zone, or premium of 50% internal EQ before targeting weak internal low, priced at 4,402.380.
Alternative scenario:
Price to potentially print bullish iBOS as H4 pullback could be complete, however, Daily and Weekly TF still require pullback.
Note:
Gold continues to exhibit elevated volatility as markets digest the Federal Reserve’s ongoing dovish tilt and persistent global geopolitical tensions.
With uncertainty remaining a dominant theme across global risk assets, traders should prioritise disciplined risk management, as abrupt price swings and liquidity pockets may become increasingly common.
Furthermore, recent tariff announcements from President Trump, particularly those directed at China, have added another layer of instability to the macro landscape. These policy developments have the potential to intensify market turbulence, heighten risk‑off flows, and trigger sharp intraday reversals or whipsaw‑like behaviour in gold.
M15 Chart:

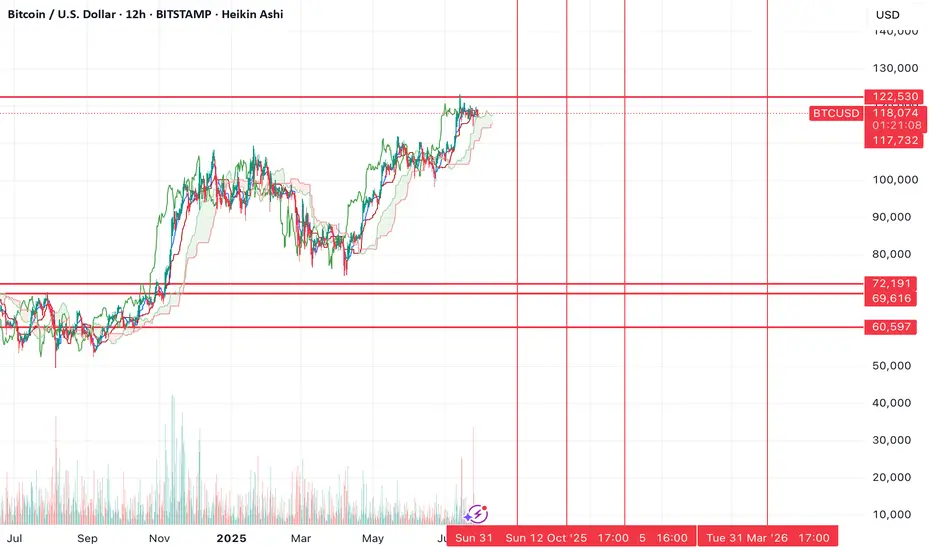
BTC highs in, new lows coming soon?~$122.5k was the top of the range. Now we'll need to go test the lows before we can continue higher.
Alts are clearly not confirming a trend change .
Many still bearish on HTFs (including ETH), I think the reason is because Bitcoin goes lower before we see a continued run and that will drag down alts with it. I think people holding alts here with hopes for new highs (in the near future) are about to have their hopes crushed, that also goes for people long crypto miners.
I don't think the real run starts until end of 2025 or 2026.
Time will tell.
US30 directional bias for today So.......according to my top down analysis. I believe US30 will head down
Price might form a bearish flag, just wait for the 3rd touch of the top line then a rejection signal on the LTF eg. 5min, 3min

EURGBP: Bearish Move From Trend Line 🇪🇺🇬🇧
EURGBP may retrace from a major falling trend line on a daily time frame.
The price formed a cup & handle pattern after its test on an hourly time frame.
Goal - 0.868
❤️Please, support my work with like, thank you!❤️
I am part of Trade Nation's Influencer program and receive a monthly fee for using their TradingView charts in my analysis.

EthereumI'm more bullish on Ethereum since 3/4 charts I analyze are bullish at the moment.
3M-Bull
M-Bull
W-Bull
D-Bear
I'm anticipating price to fall into the $800 - $1200 range to find support. I'll be more interested once price action closes below $1530.
I'll update my thoughts as it unfolds.

EURUSD LONGMarket structure bullish on HTFs DW
Entry at both Weekly and Daily AOi
Weekly Rejection at AOi
Previous Weekly Structure Point
Daily Rejection At AOi
Previous Structure point Daily
Daily EMA retest
Around Psychological Level 1.17500
H4 Candlestick rejection
TP: WHO KNOWS!
Entry 100% || 120% TPT
REMEMBER : Trading is a Game Of Probability
: Manage Your Risk
: Be Patient
: Every Moment Is Unique
: Rinse, Wash, Repeat!
: Christ is King.

Bitcoin Long Setup using AMD Modelhello BTC traders,
Using the AMD Model this setup is highly likely due to several reasons
BTC is Bearish overall and is currently in a pull back phase before the next drop to the 35-45k range
Reason 1: In order for BTC to have maximum liquidity for the final push down, we have must take out the Stops above the H1 Order block and this itself is a manipulation to induce opening of more Long positions and give market makers the chance to sell
Reason 2: The Re-test of the Hourly Block Failed to Give an Immediate ChoCH
Reason 3: There is an Unmitigated H4 Order Block that has not yet been filled.
i have left 2 TPs for you guys:
TP 1 is Above the H1 Block where all the Stops are @ 71600 (90% Probability)
TP 2 is right below the H4 Block @ 77500 (50% Probability) (for the more risk lovers of you)
SL below the Current Pennant Low
thanks for checking it out.
follow for more :)

Force Motors Ltd – Bullish Breakout & Range Expansion SetupTimeframe: Daily
Trend: Bullish continuation
Market Structure: Higher low → Range breakout attempt
Analysis:
Force Motors has decisively reclaimed the ₹21,130–₹21,300 supply zone, which earlier acted as a strong resistance. Price is now sustaining above this zone, indicating successful demand absorption. The recent bullish candle is supported by rising volume, confirming institutional participation rather than a weak retail move.
The stock previously formed a range between ₹18,700 and ₹21,300. Current price action suggests a range expansion phase, with buyers firmly in control. As long as price holds above the breakout zone, the bullish bias remains intact.
Key Levels:
Immediate Support: ₹21,130
Major Support: ₹20,700
Resistance / Target Zone: ₹23,200 – ₹23,300
Extended Target (Momentum): ₹24,000+
Trade Plan:
Buy on dips near: ₹21,300 – ₹21,500
Stop Loss: ₹20,700 (daily close basis)
Target 1: ₹23,200
Target 2: ₹24,000 (trail aggressively)
Confirmation Signals:
Strong bullish close above ₹21,300
Volume expansion on green candles
No immediate rejection from ₹22,000+ levels
Invalidation:
A daily close below ₹20,700 would invalidate the bullish setup and signal a possible false breakout.
Bias:
📈 Bullish as long as price holds above breakout zone

MNQ Analysis & Day Trading - Thursday February 5 2026 part 22-3 so far on the day, +$154. continue the day in part 3.
-------------
As a learning, beginner day trader I go through the market replay predefining what I am looking for to enter a trade and walk through my thoughts as I experience the market action bar by bar throughout the entire day to see how I handle various events and assess my execution.
This is for me and others to learn if you desire.

MNQ Analysis & Day Trading - Thursday February 5 2026 part 12-1 / +$404 so far on the day. Continue this day with part 2 next.
----------
As a learning, beginner day trader I go through the market replay predefining what I am looking for to enter a trade and walk through my thoughts as I experience the market action bar by bar throughout the entire day to see how I handle various events and assess my execution.
This is for me and others to learn if you desire.

MNQ Analysis & Day Trading - Wednesday February 4 2026 part 3Great day. 4-1 / +$586
---------------
As a learning, beginner day trader I go through the market replay predefining what I am looking for to enter a trade and walk through my thoughts as I experience the market action bar by bar throughout the entire day to see how I handle various events and assess my execution.
This is for me and others to learn if you desire.

MNQ Analysis & Day Trading - Wednesday February 4 2026 part 23-1 / +$498 so far on the day. Remaining day in part 3.
----------
As a learning, beginner day trader I go through the market replay predefining what I am looking for to enter a trade and walk through my thoughts as I experience the market action bar by bar throughout the entire day to see how I handle various events and assess my execution.
This is for me and others to learn if you desire.

MNQ Analysis & Day Trading - Wednesday February 4 2026 part 11-0 / + $200 so far on the day. Remaining day in part 2.
---------
As a learning, beginner day trader I go through the market replay predefining what I am looking for to enter a trade and walk through my thoughts as I experience the market action bar by bar throughout the entire day to see how I handle various events and assess my execution.
This is for me and others to learn if you desire.

Possible BTC next move. Although most of people are calling a bear market to crypto I keep my bullish sentiment. This end of the week showed a great support around 60k but knowing crypto I know there is a big chance to see a final push back to wipe all the leveraged positions and spread more fear around retail investors. The reaction at 60k is a positive sign but not strong enough to keep the momentum going in my opinion.
