Short tradeSell-Side Trade
Pair: GBPAUD
Mon 2nd Dec 2025 — 8:30 AM
NY Session AM
🟥 Trade Details
Direction: Sell-side
Entry: 2.01331
Take Profit: 2.00827 (+0.25%)
Stop Loss: 2.01436 (0.52%)
Risk-to-Reward: 4.8R
🟧 Execution Context
NY AM open delivered premium distribution pricing
Clear liquidity grab (highlighted blue Fib zone 0.618 -0.328 & FVG)
above micro-swing before displacement
Bearish orderflow confirmed by:
Break of Structure (BOS) to downside
Displacement candle
Retest into bearish FVG + Order Block
Entry taken at optimal 0.75 (PDArray) retracement inside imbalance
🟦 Market Structure
M15 + M5 structure already bearish on the day
Lower highs across London into NY
Price broke: London low, Asia low & Internal liquidity taken →
for a continuation setup, HTF (H1) aligned with bearish flow
Compression pattern preceding the drop confirmed exhaustiveness
🟪 Liquidity Story
Pre-NY sweep of the liquidity low marked on chart
Price engineered buy-side liquidity for distribution
Orderflow transitioned to:
Sell-side targeting:
2.01131 (−0.618 level)
2.00827 (TP, external liquidity pocket)
Multiple FVGs stack above mark → clear rejection zones
🟩 Model Confirmation
SMC + ICT Model Alignment:
Liquidity grab → displacement → FVG → confirmation entry:
All PD arrays aligned:
Premium pricing
FVG
Bearish OB
Retracement into imbalance
RR 4.8
🟫 Narrative & Psychology
Market offered a counter-trend bounce trap
Retail longs positioned after the wick sweep
Smart money distributed into premium
We assume we are in the NY AM expansion phase
Strong conviction supported by consistent session behaviour
🟩 Outcome / Trade Status
Currently in progression / tracking toward sell-side targets
Strong follow-through momentum observed
Clean trend delivery expected into NY PM continuation
Multiple Time Frame Analysis

Long trade
Trade Journal — AUDNZD (Updated)
Buyside Trade — London Session AM
Mon 1st Dec 2025 — 5:00 AM
🔵 Trade Details
Pair: AUDNZD
Direction: Buyside
Date: 1st Dec 2025
Time: 5:00 AM
Session: London Session AM
🟩 Execution Block
Entry: 1.14546
Stop Loss: 1.14489 (0.05%)
Profit Target: 1.14935 (0.340%)
Risk–Reward Ratio: 6.82R
🟧 Model & Structure
Trade follows the internal structure shift seen after the sell-side liquidity sweep
Entry aligns with your 1-minute or 5-minute confirmation model
PD array sequence respected: SSL (Sell-side Liquidity Sweep) sweep → BOS (Break of Structure) → FVG/OB (Fair Value Gap/Order block) → retracement entry.
🟦 Bias & Higher-Timeframe Context
NZDUSD showing bullish recovery after multi-session selloff
H1 discount pricing respected ?
Price returns into a reactive demand block at 0.5715 ?
Daily open acts as a draw above ?
We assume the London expansion time window (7:00–9:30 AM) supports upside delivery ?
🟩 Outcome: Trade in session
Expect continuation toward 0.57500 once retracement is filled
Watch for reaction around daily open.

Long trade
Date: Mon 1st Dec 2025
Time: 7:40 PM
Session: Tokyo Session PM
Execution TF: 5-min
Bias: Sell-Side / Short
🟥 1. Trade Details
Pair: AUDJPY
Direction: Sell-Side Trade
Entry: 101.808
Take Profit: 101.279 (-0.43%)
Stop Loss: 102.278 (0.46%)
RR: 3.95R
🟦 2. Higher-Timeframe Context (Blue Tab — HTF Bias & Structure)
HTF Bias: Bearish → Retracement → Continuation
The 1H and 4H charts show:
Multiple failed attempts to break above the 102.40/102.50 macro level
HTF premium zone rejection (6.18 retracement + previous POI)
Series of lower highs forming beneath 102.30
Break of structure leading into a newly formed HTF discount imbalance
The overall context is a sell we observed a premium setup inside a bearish macro sequence.
Key HTF Levels:
102.49 high → external buyside liquidity
102.20 – 102.25 → bearish rejection block
101.28 – 101.30 → Sell-side liquidity target (TP)
🟨 4. Technical Breakdown
ICT Sell Side Model:
Model Sequence:
Liquidity Grab → Displacement → BOS → FVG Return → Short Entry
Confluences:
FVG + 0.25/0.5 fib level
Supply block rejection
Clear market structure shift
Tokyo Session PM timing (low volatility → Algorithmic clean move)
Risk tightly defined above rejection block at 102.27
Stop Logic:
SL placed above:
The 102.27 rejection block
The last internal high
Invalidates bearish structure if taken
TP Logic:
Take profit set at:
Sell-side liquidity at 101.28
1.272 fib extension
Previous session low cluster
🟩 5. Session Narrative
Tokyo PM Session Behaviour:
Clear sweep during session transition
Smooth distribution after premium mitigation
No opposing liquidity until session lows
🟫 6. Outcome: Trade in session

Long trade
🟩 1. Trade Details
Pair: USDJPY
Direction: Buyside Trade
Date: Mon 1st Dec 2025
Time: 10:00 AM
Session: NY Session AM
Execution TF: 15-min
Entry: 155.086
Take Profit: 155.774 (+0.39%)
Stop Loss: 155.037 (–0.03%)
Risk-to-Reward: RR = 8.54R
🟦 2. Higher-Timeframe Context
HTF Bias: Bullish → Bullish Continuation:
USDJPY has been in a macro uptrend, consistently printing higher highs on the 4H / Daily charts. Current retracement is shallow, indicating strong buyer aggression.
Key HTF Levels:
Daily bullish FVG at 155.00 → 155.40
Weekly liquidity above 156.50–157.00
Daily Open reclaim gave strong directional confirmation
Narrative:
Price delivered a corrective pullback into discount and formed a consolidation wedge before a sharp NY AM expansion → signalling the start of a new impulsive leg.
🟧 3. Liquidity - ICT model logic
1️⃣ Sell-Side Liquidity Raid
The lows at 155.014 were swept
Price dipped into a 0.618 retracement + internal liquidity pocket
2️⃣ Inducement Layer
Multiple equal lows created “fake support”
Retail positioned short on the breakdown
3️⃣ Displacement
Fast upside displacement candle at NY AM session open
Breaks micro structure and invalidates bearish order flow
4️⃣ Rebalance & Entry
Price returns to:
Discount zone
Bullish FVG (15m)
Bullish Order Block
EMA/WMA dynamic support
5️⃣ Buyside Liquidity Target
Liquidity above 155.760 (previous NY high) tapped
🟪 5. Market Sentiment & Session Narrative (Purple Tab)
Session Behaviour:
London session showed compression
NY session created high-volatility spike → indication of algorithmic shift
Liquidity engineered below the lows was used as fuel to power the expansion
Sentiment:
Retail bias was bearish due to breakdown under 155.30
HTF remained bullish? USD strength increasing due to macro drivers (Fed rate expectations narrative)
🟫 6. Outcome
Status: Trade in session

Long trade 📘 Trade Journal — AUDNZD (Updated)
Buyside Trade — London Session AM
Mon 1st Dec 2025 — 5:00 AM
🔵 Trade Details
Pair: AUDNZD
Direction: Buyside
Date: 1st Dec 2025
Time: 5:00 AM
Session: London Session AM
🟩 Execution Block
Entry: 1.14546
Stop Loss: 1.14489 (0.05%)
Profit Target: 1.14935 (0.340%)
Risk–Reward Ratio: 6.82R
🟧 Model & Structure
Trade follows the internal structure shift seen after the sell-side liquidity sweep
Entry Type: 1-minute
PD array sequence respected: SSL sweep (Sell-side Sweep) → BOS (Break of Structure) → FVG/OB (Fair Value Gap & order Block) → retracement entry
Clean displacement from the FVG triggered the continuation setup trade execution.
🟦 Bias & Higher-Timeframe Context
H1 shows exhaustion into previous delivery range
Clear sell-side liquidity failure at multi-session lows
Price retraced into the OB + FVG cluster near 1.1450 (mitigation)
We assume London AM session we continue with a expansion towards
the inefficiency overhead at 1.1493
🟩 Outcome / Trade in session
TP aligns with the 1-hour imbalance fill
Strong continuation expected once VWMA/EMA cross supports structure

EURNZD: Bullish After the News 🇪🇺🇳🇿
EURNZD formed an inverted head & shoulders pattern
on a key daily support cluster.
We see a bullish breakout of its neckline and a strong bullish momentim
after EU inflation data today.
Odds are high that the pair will rise at least to 2.0335 level.
❤️Please, support my work with like, thank you!❤️
I am part of Trade Nation's Influencer program and receive a monthly fee for using their TradingView charts in my analysis.

NZDUSD: Retracement Continues 🇳🇿🇺🇸
There is a high probability that NZDUSD will retrace more
from the underlined key daily resistance.
A double top pattern on a 4H and a formation of a bearish
imbalance candle with London session opening provide
strong confirmations.
Goal for sellers - 0.5709
❤️Please, support my work with like, thank you!❤️
I am part of Trade Nation's Influencer program and receive a monthly fee for using their TradingView charts in my analysis.

XAU/USD 02 December 2025 Intraday AnalysisH4 Chart:
-> Swing: Bullish.
-> Internal: Bullish.
Analysis and bias remains the same as analysis dated 20 October 2025.
Price has printed as per previous intraday expectation by printing a bearish CHoCH which indicates, but not confirms, bullish pullback phase initiation.
Price is currently trading within an established internal range, however, I will continue to monitor price with regards to depth of pullback.
Intraday expectation:
Price to continue bearish, react at either discount of 50% internal EQ, or H4 supply zone before targeting weak internal high priced at 4,380.990.
Note:
The Federal Reserve’s sustained dovish stance, coupled with ongoing geopolitical uncertainties, is likely to prolong heightened volatility in the gold market. Given this elevated risk environment, traders should exercise caution and recalibrate risk management strategies to navigate potential price fluctuations effectively.
Additionally, gold pricing remains sensitive to broader macroeconomic developments, including policy decisions under President Trump. Shifts in geopolitical strategy and economic directives could further amplify uncertainty, contributing to market repricing dynamics.
H4 Chart:
M15 Analysis:
-> Swing: Bullish.
-> Internal: Bullish.
Price has printed as per analysis dated 14 November 2025 where I mentioned price to trade down to either discount of 50% internal EQ, or M15 demand zone before targeting weak internal high, priced at 4,245.195.
Price subsequently printed a bearish CHoCH, however, as mentioned yesterday, I would closely monitor price with respect to depth of pullback.
Price did not pull back with any significance, therefore, I will apply discretion and not classify an iBOS. I have marked this with red dotted and dashed lines.
Price has since printed another bearish CHoCH.
We are currently trading within an established internal range, however, as per yesterday, I will continue to monitor price with respect to depth of pullback.
Intraday expectation:
Price to trade down to either discount of 50% internal EQ, or M15 demand zone before targeting weak internal high, priced at 4,264.700.
Note:
Gold remains highly volatile amid the Federal Reserve's continued dovish stance, persistent and escalating geopolitical uncertainties. Traders should implement robust risk management strategies and remain vigilant, as price swings may become more pronounced in this elevated volatility environment.
Additionally, President Trump’s tariff announcements, particularly against China, are expected to further amplify market turbulence, potentially triggering sharp price fluctuations and whipsaws.
M15 Chart:

USDCAD: Another Bullish Confirmation 🇺🇸🇨🇦
A quick follow-up for the yesterday's post for USDCAD.
I see another bullish pattern on a 4H time frame now.
The price formed a cup & handle pattern and broke its neckline.
I still expect a move up to 1.402
❤️Please, support my work with like, thank you!❤️
I am part of Trade Nation's Influencer program and receive a monthly fee for using their TradingView charts in my analysis.

Gold is still showing us it's bearish intent on the macroEasy peasy reading on the week so far. Let me know if I missed anything. I'm here for the sharing of info 💎

A Big Move Is Brewing on ULTRACEMCOPrice has pulled back into a major HTF reaction area, the same zone that previously triggered strong upside legs. Daily structure is slowing down right at this level, showing early signs of base-building.
On the 1H chart, I’m watching for a deep retest around 11,300 followed by a strong 1H closing confirmation. That’s the point where momentum usually shifts. If this plays out cleanly, the broader upside path opens near 13,000 — the next area where price previously stalled. Price might reverse back at 12,300 but I'm expecting the exit near 13,000
As long as the current base holds, this remains a high-probability swing continuation setup.
Below this zone, short-term structure weakens — above it, the larger trend can resume.
Stay Updated. Keep following for more trading insights and opportunities. Also please drop a comment what is your level for NSE:ULTRACEMCO
Best regards,
Alpha Trading Station

USDJPY Sell SetupTechnical Context
Break of Structure → Price broke last week’s low at 155.64, extending down to 154.70, confirming bearish momentum.
Supply Zone Retest → Price is now retesting the 155.40–155.70 supply zone on the 1H chart, offering a potential short entry area.
🎯 Trade Plan 🎯
Entry : 155.50 (below supply zone, 1H)
Stop Loss : 155.72 (above supply zone, 1H)
Target : 154.95 (above demand zone, 1H)
Risk–Reward: ~3.5x
⚠️ Disclaimer ⚠️This journal entry is for educational and documentation purposes only. It does not constitute financial advice or a recommendation to trade. All trading involves risk, and past performance does not guarantee future results. Always conduct your own analysis and consult with a licensed financial professional before making trading decisions.

EURCAD shortEURCAD has been bearish on the higher timeframes(weekly and daily)so all I had to wait for was retest of the head and shoulders pattern on the 4hr timeframe to continue with the bearish trend.

Why I Think GBPJPY Might Continue Selling...Technical Analysis Hey Rich Friends,
Happy first day of December! I wanted to share my analysis of GBPJPY. I haven't made any moves yet but I will be looking at it for a sell. This is only my technical analysis so I encourage you to check the news and cross-reference the indicators on your own chart. Here is what I am looking at:
- Price has crossed and closed below the previous level of support at 205.730 on H4. This is a bearish confirmation for me.
- The selling momentum has picked up over the last couple of hours
- The stochastic is below 20 on H4. This is a bearish confirmation for me.
Additional information:
- I will be setting sell stops and TPs at previous lows. A will choose a previous high as my SL.
- It's consolidating a little bit right now, but I have more sell confirmations.
Good luck if you decide to take this trade or trade this week.
Peace and Profits,
Cha

$DASH Director Lin Alfred buys $100 million worth of shares.The MACD is bottoming out with the lines crossing to the upside, and the RSI at 37.43 is holding and bouncing from its support level. Additionally, the 5-minute chart shows a solid price reaction off a well-defined trend line, while the 1-minute chart is forming strong consolidation—both reinforcing the likelihood of an upcoming upward move.

USD/JPY - Dolar can't let Japan win much more than already did.With the current PA, we just entered the discouunted prices and the bullish orderflow.
It is a nice reaction from the 0.7 mark of the fibbonaci retracement.
I am seeing that UJ could potential fly to a new HH.

MicroStrategy - The red channel of doom returns - November 2025Ah, MicroStrategy…. the stock that’s half software company, half Bitcoin cult. Every time you think it’s about to behave like a normal tech firm, Michael Saylor pops up with a grin, another billion dollars of debt, and the conviction of a man who’s never heard the words “margin call.”
And here we are, November 2025, staring at the Red Channel Crossover. Sounds ominous doesn’t it? Like something NASA would warn about before the Sun goes super nova.
Déjà Vu: February 2022 Says Hello
Look left.
The last time price action crossed into the red channel was February 2022. Market structure broke. Price dumped. Holders prayed. And then just when everyone thought it was over, sneaky sellers rotated the gravity dial to 2G.
Now we’re back at it. November 2025, same crossover, same setup, same “this time is different” nonsense. Every influencer on X is already typing “Buy the dip 🚀”, as if adding a rocket emoji somehow fixes negative momentum.
The technicals
The green channel represents calm waters, an uptrend, happy times, and Saylor buying jets with the profits. The red channel is the opposite. It’s like when the hangover kicks in and you realise that was not sugar free Red Bull. Each time MSTR entered this red zone, it meant one thing:
Broken market structure,
50–70% correction,
Mass denial phase.
Right now, the chart’s showing that same red crossover again, after breaking below structural support around the $240 area. If you’re still shouting “to the moon” at this point… well that rocket exploded months ago.
RSI & sentiment
RSI is rolling over faster than a drunk at a wedding. Momentum’s drained and what’s left are bag holders explaining to their spouses that “it’s a long-term store of value.” It’s not. It’s a tech stock with a crypto addiction.
So what happens next?
If history’s anything to go by, and it usually is, price action is heading for the same fate it suffered post February 2022:
First, a short-lived bounce to sucker in the hopeful.
Then, the slow, grinding descent into despair.
A retrace toward the $80–$100 region would fit perfectly with prior cycle behaviour. And if Bitcoin confirms its own Gaussian bear trend, well… let’s just say Michael Saylor’s going to need more than “diamond hands”, he’ll need a therapist.
Before that can happen expect price action to test the $300 area to confirm broken market structure. Today price action is considerably oversold, this idea only becomes validated after a resistance confirmation on past support . Wrote that in bold for those of you who struggle to get past the headline. I blame Tik-Tok
Conclusions
Every cycle it’s the same story:
1. MSTR breaks structure.
2. The red channel appears.
3. Everyone panics.
4. Then comes the silence.
The only variable is how many motivational tweets Saylor can post before margin calls start rolling in. This setup isn’t new, isn’t rare, and isn’t bullish, it’s just math doing its job while people pretend it’s spiritual warfare. So yes, the red channel crossover is back. Same movie. Different year. Still ends badly for the extras.
Ww
Disclaimer
==================================================================
This isn’t financial advice, obviously. If you need a stranger on the internet to tell you not to buy a company using borrowed money to gamble on Bitcoin, you deserve the portfolio you get.
If it pumps, you’ll take credit.
If it dumps, you’ll blame the FED.
Either way, I’ll be here limiting my desire to say "I told you so".


USDJPYIntra-day sells to Demand zone where I'll be interested in buying till break of highs.
Manage risk

CADJPY D1From the higher TF pric3 looks bearish. The market is in a retracement phase. Expecting price to drop to 100.000 for a possible long entry.

AUDUSD is bearish in for a while!AUDUSD is bearish in 1-5min timeframe having met necessary conditions as explained in the image above.
Conditions:
1. Create a liquidity sweep on the highs and only then;
2. Break of structure on the swing low.

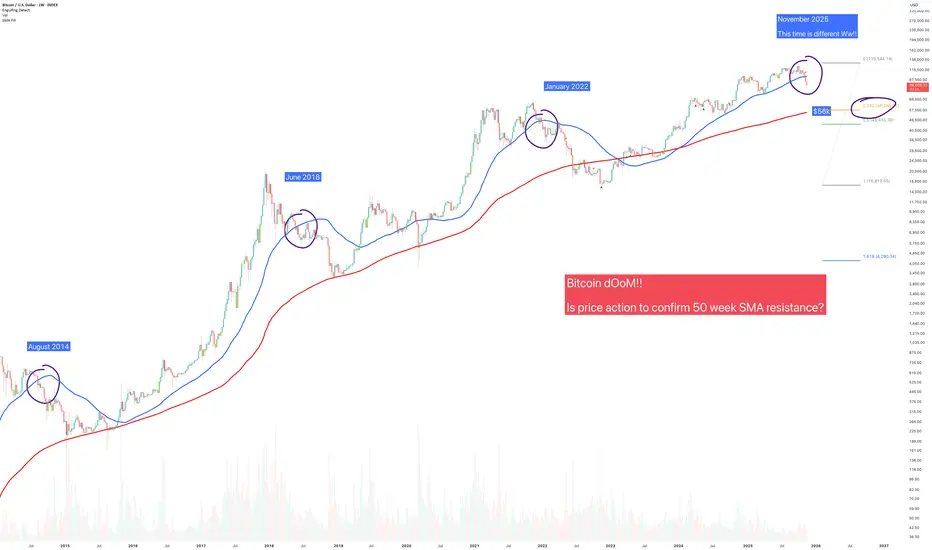
Is a crash to $56k about to occur for Bitcoin? - November 2025The above chart been brought to my attention by a number of folks asking for an opinion. So here it is.. remember, am just a messenger not target practice.
Price action shown on the above weekly chart has closed under the 50 week SMA, or so I’m told.
“Is that it? The top now in Ww?”
Look left, if you’re using two moving averages:
50 week SMA (blue)
200 week SMA
Then for you, the top is in. It’s over, go home. Congratulate yourself once again for providing exit liquidity for those that entered long positions at $15k. They have your everlasting thanks.
What's the hullabaloo?
Throughout the history of Bitcoin a test of the 200 weekly SMA occurred every time price action closed under the 50 week SMA. That’s not up for debate, it is a chart fact. Today that would be a highly predictable test of $56k, which is also the Fibonacci 0.38.
This forecast is going to upset a lot of people. The influencers promised them tales for fortune and glory. Instead.. they got a lesson in basic economics, but they had to pay $50,000 for it. You don't get refunds for stupidity, do ya?
Is this time different?
It is not possible to tell right now. Many might look at the chart and quit, they’ve had enough. That would be a mistake. Why? Confirmation.
Look left. Always look left. Until Monday 24th, November it is not known if the break of the 50 week is confirmed. Indeed if you take a closer look, price action has not actually closed a weekly candle body under the 50 week SMA, it has closed through it. That’s important.
Today
January 2022 Confirmation
June 2018 Confirmation
August 2014 Confirmation
Conclusions
So here we are again, Bitcoin teetering on the edge, influencers chanting “bull market!” like it’s a religion, and yet… there’s that nasty little blue line.
Price action under the 50-week SMA has never ended well. Not once. Every single time, without exception, it’s been followed by a cozy trip down to the 200-week SMA. Historically, that’s what Bitcoin does, it falls until it hits something red and expensive looking, then everyone acts surprised.
And where’s that level today? About $56k. Right on the Fibonacci 0.38. It’s like gravity with maths. But before you light the torches and start the “Ww’s turned bearish” posts, calm down. The candle hasn’t confirmed yet. That’s right, you’ve got until Monday, November 24th to find out if this is the real deal or just another fake-out designed to make you question every life decision since buying at $110k.
Look left. Every time price closed through the 50-week, the same story played out:
August 2014: crash.
June 2018: crash.
January 2022: crash.
It’s basically Bitcoin’s version of Groundhog Day, but without Bill Murray or the happy ending.
If it confirms below that line, that’s it. The 200-week SMA becomes the magnet.
If not, we’ll bounce, the influencers will return, and everyone will convince themselves they knew all along.
Either way, I’m not saying “doom.” I’m just saying, maths, it works.
Ww
Disclaimer
===============================================================
This isn’t financial advice. Obviously. If you’re taking investment cues from a bloke with a sense of humour about market collapses, you might want to re-evaluate your decision making process.
If you sell here and it pumps that’s on you.
If you hold and it dumps, that's also on you.
If you blame “market manipulation,” congratulations, you’ve just described every loser in crypto since 2017.
I don’t have a crystal ball, just charts and they don’t lie, even if people do. So whether Bitcoin crashes to $56k, or rallies to $160k, or starts taking payments in “Hopium,” I’ll still be here, tea in hand, smirking, watching the comments fill up with “You were wrong!” from people who were never right. Without Worries (Ww)
“Look left, not up.”
Long trade Buyside Trade
🟦 Trade Details
Pair: EURGBP
Date: Fri 28th Nov 2025
Session: LND to NY Session Overlap PM
Model Type: Buyside Trade
Timeframe: 15-minute (HTF narrative with LTF execution)
🟩 Entry & Levels
Entry: 0.87658
Profit Level (TP): 0.87950 (0.39%)
Stop Level (SL): 0.87487 (0.18%)
Risk-to-Reward (RR): 3.21
🟨 Trade Context
Price traded into a multi-day discount zone, forming accumulation behaviour at the low of the range. A mitigation of the prior bullish FVG aligned with the session low, creating the narrative for a LTF bullish rotation. Liquidity was swept below 0.87556, clearing sell-side pressure before displacement. Market structure on 15m showed MSS → BOS → bullish re-pricing before the entry zone was reached.
Timeframe: 2-minute
🟥 Execution Narrative
After the liquidity sweep, price created a clean bullish displacement candle breaking structure.
Entry taken on the FVG mitigation inside the premium of the internal LTF structure.
EMAs (fast & slow) crossed into bullish alignment, confirming trend shift.
Volume spike on the sweep validated institutional accumulation at the low of the cycle.
🟪 Sentiment & Narrative
Market was driven by algorithmic draw toward unmitigated inefficiencies above 0.8790 – 0.8810. Broader sentiment showed weakening GBP strength ahead of the NY session.
Price behaviour supported a transition from discount accumulation → expansion phase.
Session timing with the NY PM reversal profile.
🟫 Outcome
Trade Logic : Liquidity sweep → MSS → Displacement → FVG entry → Expansion.
The TP at 0.87950 - liquidity resting above the short-term high.
