GBPJPY ENTRY CHARTThis is a 1R - 9R Trade, We are Bearish on this Setup, Sorry I'm using my Mobile to Publish this setup, trend is still very much bearish, we have other confluences, like H4 KEY LEVELS, Multiple Timeframe analysis.
Multiple Time Frame Analysis

Long trade 🟦 TRADE SUMMARY
Pair: AVAXUSDT.P
Direction: Buyside
Date: Sun, 23rd Nov 2025
Time: 7:00 PM
Session: Tokyo PM
Timeframe: 1H
---
🟩 TRADE PARAMETERS
Entry Price: 13.221
Profit Target:13.735 (+3.88%)
Stop Loss: 13.146 (–0.57%)
Risk-to-Reward Ratio: 6.78 R
---
🟨 MARKET CONTEXT & STRUCTURE
1. Higher-Timeframe Context
AVAX was in a deep markdown leg after heavy distribution on Nov 20–21 (visible volume spike at the selling climax)—a micro-accumulation range formed between 13.05 and 13.25, with repeated liquidity sweeps. The 1H BOS above 13.32 confirms the shift from bearish → bullish order flow.
1Hr TF
2. Intraday Structure
A clean BOS occurred after the NY Session (Nov 23) when the price broke above the structure at 13.28. EMAs show: 50 EMA reclaim, 200 EMA flattening → early bullish alignment.
Price retests:
FVG (13.18–13.23)
Bullish OB at 13.21
Accumulation range low
🟪 LIQUIDITY STORY
Sell-Side Liquidity Clears
London + NY sessions swept liquidity below 13.15 and 13.05.
A deeper liquidity purge into 12.26–12.28 formed the structural low zone.
Buy-Side Liquidity Above
Internal liquidity targets:
13.42
13.56
HTF inefficiencies inside 13.70–13.85
Major buyside magnet: supply zone at 13.77–13.87
🟫 WYCKOFF ALIGNMENT
We assume we are heading towards Phase D (LPS → SOS).
🟩 VOLUME & CONFIRMATION
High volume candle marks the selling climax.
Accumulation shows low-volume downward tests → bullish absorption.
Displacement up from 13.18 shows volume expansion, confirming algorithmic buying.
🟥 OUTLOOK / CONTINUATION
Above 13.32, bullish continuation remains valid.
Key continuation targets:
13.85
14.05
14.30
Invalidation:
Break below 13.12 invalidates the bullish structure.

CHFJPY Risky Counter-Trend TradePrice retested a triple top neckline at (194.451-194.017) and was rejected strongly at the zone forming bearish engulfing candle

Long trade 📘 BTCUSDT.P – Trade Journal Entry
🟦 Trade summary
Pair: BTCUSDT.P
Trade Type: Buyside Trade
Date: Sat 22nd Nov 25
Time: 9:30 pm
Session: Tokyo Session PM
Timeframe: 15 min
🟩 Trade parameters
Entry: 86,169.4
Profit Level: 91,000.0 (+5.60%)
Stop Level: 82,523.8 (–4.02%)
Risk-to-Reward: 5.46 R
🟨 Market context and structure
The market was in a 3-session decline (Tokyo → London → NY), forming an extended liquidity run to the downside. Repeated sell-side sweeps occurred near 85.0–85.6k, creating inducement for a buyside reversal. Descending channel/compression structure developed leading into NY PM. THE NY PM session formed the first bullish displacement after the sweep, confirming the intraday shift.
🟪 Liquidity
Sell-side liquidity was taken below the Asian + London lows.
The final low sweep occurred just before NY PM delivery.
Multiple FVGs (Fair Value Gaps) printed on the bullish expansion up from 85.5k → 86.5k.
A clean FVG retest + orderblock interaction created your entry model.
Liquidity Path:
Model: Sell-side sweep → Displacement → FVG → OB retest → Buyside target (91k)
🟫 Whykoff Aligment
Phase BTC Price Action
Phase B Wide, aggressive markdown with sweeps
Phase C Final sell-side sweep into NY PM
Phase D Rally through structure + LPS retest
Phase E Expansion toward buyside inefficiencies
We assume BTC now reflects a Phase C → D transition into markup.
🟩 Volume and confirmation
NY PM shows volume expansion only on bullish candles. Retracements back into the FVG show volume contraction, confirming programmatic buy-side control.
🟥 Outlook/Continuation
Holding above 86.3–86.5k = continuation probable. Potential upside magnet sits around 92.2–93k premium where macro inefficiencies remain open. Invalidation: Return below 85.6k kills the intraday buyside premise.

USD/JPY: Intervention Risk RisingThe broader macro environment continues to shift against the U.S. dollar, with markets increasingly pricing the start of Federal Reserve easing as early as December or January. Rising expectations of rate cuts, paired with softening U.S. front-end yields, have weighed on the dollar’s momentum across major pairs. On the one hand, a potential Fed decision to delay easing until later in the year could reinvigorate the dollar, creating unexpected volatility. On the other hand, should the Fed opt for a more aggressive shift toward easing, it might accelerate dollar depreciation. At the same time, Japanese authorities have intensified their intervention rhetoric, particularly as USD/JPY trades near historically sensitive levels where the Ministry of Finance has previously acted to stabilize yen depreciation. A potential shift in the Bank of Japan's stance toward normalization, such as adjusting their yield curve control policy, could further alter the market dynamics. Despite these pressures, interest-rate differentials continue to favor USD/JPY upside, keeping the pair elevated as carry demand persists.
Price action on the 1H, 15m, and 5m charts shows repeated absorption of sell orders at the 156.75–156.80 region with declining pullback volume, a sign of demand defending the level. However, the pair remains vulnerable to a downside break should sellers regain control, particularly given early-stage MACD compression. With the 4H 200 EMA positioned well below current price action, any sustained breakdown could trigger a deeper correction aligned with the broader shift toward USD softness.
Thesis
Bull Bias (High Probability)
Entry: 156.80 – 156.95
Stop Loss: 156.55
Take Profit Levels:
TP1: 157.30
TP2: 157.55
TP3: 157.90 – 158.00
Reasoning: While BoJ intervention risk caps the upside, the bull case remains valid as long as intervention does not occur and 156.75 holds. Moreover, until the BoJ signals a clear shift toward normalization (e.g., raising rates or ending yield curve control outright), the yen’s fundamental backdrop remains weak. However, and this is critical, the bull case is fragile, not because of technicals, but because the entire upside continuation depends on no intervention event occurring. Upside targets toward 157.50–158.00 remain technically justified, but every pip higher increases the probability of official action. Historically, the probability of intervention at these levels is approximately 30%, underscoring the fragile nature of the bull case and serving as a quantitative anchor for informed skepticism.
Sell Bias (High-Probability, Conditional)
Entry: 156.72 – 156.78 (after breakdown confirmation)
Stop Loss: 157.15
Take Profit Levels:
TP1: 156.20
TP2: 155.70
TP3: 154.90 – 155.00
Reasoning: The strongest macro catalyst for a bearish reversal in USD/JPY is the risk of direct Japanese intervention, which is significantly elevated as the pair trades near historically sensitive levels around 157–158. This zone has repeatedly triggered the Ministry of Finance. Statements from the MoF have shifted from “monitoring FX markets closely” to explicit warnings about “excessive and one-sided moves that may require decisive action.” This is usually the final verbal step before intervention. For traders, this means that any breakdown below 156.75—especially if accompanied by high volume—could reflect market participants front-running expected intervention.
This publication is for informational and research purposes only and does not constitute financial, investment, or trading advice. The views expressed are those of the author and do not necessarily reflect those of Novaque & Co or its affiliates.
Novaque & Co, its employees, contributors, or related parties accept no liability for any loss or damage arising from reliance on the information presented. Readers are strongly advised to conduct their own due diligence and consult with a licensed financial advisor before making any investment decisions.
Past performance is not indicative of future results. The author and/or affiliated parties may hold positions in the assets discussed. Content is subject to change or update without notice.

XRP collapse to 75 cents underway? - November 2025Is XRP about to collapse faster than a vegan at a BBQ?
The idea “ XRP heading for 70% correction to 60 cents? ” was published at circa $2.90 after price action rallied almost 1000% throughout 2024. Price action continued to climb until $3.30 in the weeks ahead.
Naturally many took umbrage to any publisher who dared to suggest investors might do something as awful as, you know, sell after huge profits. Because making money is not the game, on no. Pledging your allegiance and unshakable faith is the true path to financial freedom. And if you believe that, I’ll tell you another... Trump and & Co. are taking up philanthropy.
The piffle from the congregation continues to entertain “Swift will be replaced by Ripple”, “Blackrock are going in big,”, “Why don’t you learn to read charts?”, every market top is the same. Liquid Euphoria.
The technical
A noteworthy development prints on the above weekly chart. A development that was fatal to any long investor who continued to ignore previous cycles. Once price action closed a candle body under the 50 week Simple Moving Average, the market dropped like a stone.
After the bearish divergence print in July (same strength as the bullish divergence print in March of 2020 at 14 cents) price action went on to break market structure. Bulls were unfazed by this development it would seem, but now a more serious development, the 50 week SMA breakdown.
Support and resistance is currently around 70 cents. Support never confirmed following the breakout. Previous collapses in price action align nicely with a 70% correction that would take price action back to the breakout should that correction strength repeat.
Conclusions
XRP has done it again, fooled the faithful into thinking this time it’s different. “Institutional money’s coming,” “the banks are loading up,” “Swift is finished!” Yeah, sure. And I’m the next Pope.
Look, I get it, every cycle needs its pantomime hero. However this isn’t a revolution; it’s déjà vu in high definition. The chart above doesn’t lie, the same structure, the same signals, and now the same 50-week breakdown that’s historically ended in tears. It’s not witchcraft, it’s statistics: Close below the 50-week SMA? → -60% to -80% every single time. RSI? Rolling over like a fainting goat. Support? Never confirmed. It’s all right there, hiding in plain sight while influencers keep shouting “bullish!” from their YouTube mansions.
Could it bounce? Sure. Dead cats do that too. But when every lower high is accompanied by louder noise and weaker conviction, you’ve got yourself less of an “investment” and more of a live action psychology experiment.
So, is XRP on death’s door?
Let’s just say it’s knocking politely and the door’s already open.
Ww
Disclaimer
=========================================================
This isn’t financial advice. Obviously. If you’re basing your investment strategy on what some bloke on the internet with access to a TradingView account says, you deserve whatever cinematic tragedy comes next.
I don’t work for Ripple, I don’t hate Ripple, and I definitely don’t think Ripple’s going to replace Swift, unless Swift suddenly stops working and forgets how to money. So, do your own research, manage your own risk, and for the love of all things holy, stop confusing hopium with a business model.
If XRP moons, great, tell me all about it while I pretend to care. If it crashes 80%, well… don’t say the moving averages didn’t warn you.

Long trade
15min
📘 TRXUSDT.P – Trade Journal Entry (15-Min Chart)
Sat 22nd Nov 25 — 3:00 pm — NY Session PM
Buyside Trade
🟦 TRADE SUMMARY (Tab 1 — Blue)
Pair: TRXUSDT.P
Direction: Buyside Trade
Date: Sat 22nd Nov 25
Time: 3:00 pm
Session: NY Session PM
Timeframe: 15m
🟩 TRADE PARAMETERS (Tab 2 — Green Transparent)
Entry: 0.27588
Profit Level: 0.27784 (+1.52%)
Stop Level: 0.27352 (–0.13%)
Risk-to-Reward: 11.56 R
30min
🟨 MARKET CONTEXT & STRUCTURE
1. Trend Context
TRX recovered from a heavy markdown cycle seen on the 30m structure.
The 15m chart shows a micro accumulation zone beneath the 200 EMA, then a displacement above the structure. NY PM session creates a clean shift in order flow, reclaiming: The NY AM high, the FVG left during the earlier breakdown and the intraday session midpoint
2. Key Structure Points
BOS at 0.2754 marks a bullish transition.
The 50 EMA flips upward and crosses the 200 EMA — momentum confirmation.
Series of higher lows formed after the BOS → clear buyside continuation model.
🟪 LIQUIDITY
Sell-Side Liquidity Removed
Liquidity swept below 0.2738, creating a final inducement.
NY PM grabs sell-side beneath the Asian and London session lows.
This clears the path for Algorithmic Repricing.
Buyside Liquidity Targets
First cluster at 0.2775–0.2780
HTF resistance levels at 0.2795–0.2802
TP lands inside the first premium inefficiency.
Liquidity Narrative Summary
Sweep → Displacement → FVG → OB Tap → Expansion (buyside model)
🟧 ICT MODEL BREAKDOWN
Model Used: Sell-Side Sweep → BOS → FVG → PD Array → Buyside Delivery
1. Inducement
London + Tokyo lows + NY early lows all swept before entry.
2. Displacement
Strong bullish displacement candle breaks above the 0.27540 BOS level.
3. Entry Type
Entry sits directly inside a:
Bullish FVG
Discount Retracement (OTE zone)
Order Block Retest
Aligned with session timing (NY PM)
4. Target Logic
TP hits first internal buyside inefficiency.
Secondary targets remain valid at 0.2795–0.2810.
🟫 WYCKOFF ALIGNMENT
Phase TRX Reaction
Phase A Selling climax & AR
Phase B Accumulation under 50/200 EMA
Phase C Spring: final liquidity sweep at 0.2738
Phase D SOS + LPS zone (Entry 0.27588)
Phase E Markup into buyside targets
🟩 VOLUME & CONFIRMATION
Volume spikes confirmed the BOS.
Retracement into FVG shows volume tapering → bullish absorption.
No heavy sell volume returned — confirming algorithmic buy program.
🟥 OUTLOOK / CONTINUATION
If TRX holds above 0.2750–0.2753, further markup remains likely.
Extended upside zones:
0.2800
0.2820–0.2830
Invalidation: Break below 0.2734 kills the buyside idea

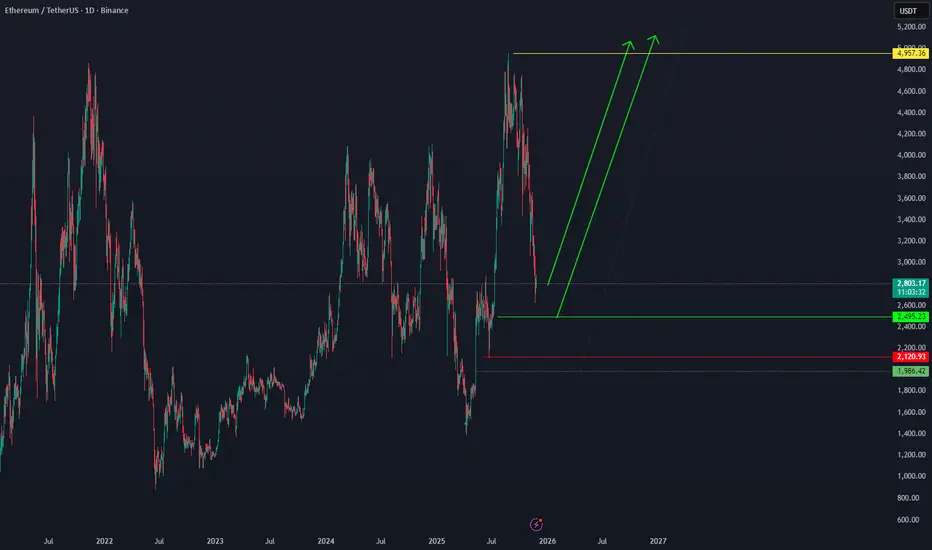
ETH is ready to reach its ATH.Ethereum can start its bullish move from the current price, as well as from 2495 — and in a more pessimistic scenario, from 1983.42 — targeting 4957 and potentially higher. BINANCE:ETHUSDT
Long trade 📘 EURJPY – Trade Journal Entry (15-Min Chart)
Mon 24th Nov 25 — 6:00 am — London Session AM
Buyside Trade
🟦 TRADE SUMMARY
Pair: EURJPY
Direction: Buyside
Date: Mon 24 Nov 25
Time: 6:00 am
Session: London Session AM
Timeframe: 15m
🟩 TRADE PARAMETERS
Entry: 180.878
Profit Level: 181.603 (+0.40%)
Stop Level: 180.802 (–0.04%)
Risk-to-Reward: 9.54 R
🟧 ICT MODEL BREAKDOWN
Model Used: SLL Sweep → OTE → BOS → FVG → Entry → Buyside Delivery
1. Inducement
Triple sweep of TF lows across Asia, Pre-LDN, and LDN warm-up.
2. Displacement
Strong BOS candle at 180.78 with large volume spike.
Two clean FVGs form in the 180.62–180.80 region.
5min TF
3. Entry Zone
Entry sits:
Inside bullish FVG
At the 62–70% fib retracement (OTE)
On top of London OB
Directly above protected low
Beneath 50 EMA + reclaim → bullish power shift
4. Target Logic
First target: fill inefficiency at 181.15
Second target: 181.60 TP
Clear premium array target.
🟫 WYCKOFF ALIGNMENT
Phase EURJPY Behaviour
A Shakeout of weak longs → move into range
B Accumulation under 181.00 key level
C Spring at 180.30 (deep liquidity grab)
D SOS & LPSR → Entry 180.878
E Markup towards buyside target
15min TF
We assume entry is positioned at the Phase C → D transition,
the strongest point of structural alignment.
🟩 VOLUME & CONFIRMATION
Heavy bearish volume during liquidity sweep (capitulation).
Volume drops during retrace → bullish absorption.
BOS candle shows volume expansion → institutional entry.
No distribution signs appear before continuation.
🟥 OUTLOOK / CONTINUATION
Continuation Zones
181.70
182.00 (major liquidity pool)
182.45 (HTF imbalance)
Invalidation
A break below 180.72 invalidates the buyside continuation.

XAU Selling Model #2Hello everyone, Welcome to the XAU-SYNDICATE...
This is my entry model for selling. If the price holds within the bearish trendline and print a clean 15 min rejection candle backed by strong volume. I'll take that as my cue to execute sell positions from this zone, aiming for a short-term downside move.
#XAU-SYNDICATE

EURNZDReasons for entering the trade:
1. Price does not break above the green Kumo
2. 1-hour static resistance
3. Price action (momentum/speed)
4. Mid-channel resistance on the 4-hour timeframe
Entry: 2.05967
TP: 2.04201
SL: 2.06555

XAU/USD 24 November 2025 Intraday AnalysisH4 Analysis:
-> Swing: Bullish.
-> Internal: Bullish.
Analysis and bias remains the same as analysis dated 20 October 2025.
Price has printed as per previous intraday expectation by printing a bearish CHoCH which indicates, but not confirms, bullish pullback phase initiation.
Price is currently trading within an established internal range, however, I will continue to monitor price with regards to depth of pullback.
Intraday expectation:
Price to continue bearish, react at either discount of 50% internal EQ, or H4 supply zone before targeting weak internal high priced at 4,380.990.
Note:
The Federal Reserve’s sustained dovish stance, coupled with ongoing geopolitical uncertainties, is likely to prolong heightened volatility in the gold market. Given this elevated risk environment, traders should exercise caution and recalibrate risk management strategies to navigate potential price fluctuations effectively.
Additionally, gold pricing remains sensitive to broader macroeconomic developments, including policy decisions under President Trump. Shifts in geopolitical strategy and economic directives could further amplify uncertainty, contributing to market repricing dynamics.
H4 Chart:
M15 Analysis:
-> Swing: Bullish.
-> Internal: Bullish.
As per analysis dated 14 November 2025, price has printed a bearish CHoCH to indicate, but not confirm bearish pullback phase initiation.
Price is currently trading within an established internal range.
Intraday expectation:
Price to trade down to either discount of 50% internal EQ, or M15 demand zone before targeting weak internal high, priced at 4,245.195
Note:
Gold remains highly volatile amid the Federal Reserve's continued dovish stance, persistent and escalating geopolitical uncertainties. Traders should implement robust risk management strategies and remain vigilant, as price swings may become more pronounced in this elevated volatility environment.
Additionally, President Trump’s tariff announcements, particularly against China, are expected to further amplify market turbulence, potentially triggering sharp price fluctuations and whipsaws.
M15 Chart:

AUDJPYPrice broke daily/H4 resistance zone around 101.000 and a pullback was made back into the zone, H4 support trendline and 50EMA. Targeting last weeks swing high (102.400) and next daily resistance zone around 103.500

EURNZD: Bullish Movement Confirmed 🇪🇺🇳🇿
There is a high probability that EURNZD will continue rising
after a test of a strong rising trend line on a 4H.
A double bottom pattern formation on that on an hourly time frame
confirms a strong bullish sentiment.
Expect a rise at least to 2.0585
❤️Please, support my work with like, thank you!❤️
I am part of Trade Nation's Influencer program and receive a monthly fee for using their TradingView charts in my analysis.

XAUUSD | Gold Swing Short SetupGold closed strong Bearish in Weekly now retesting the Bearish Ob, Until unless it doesn't take liquidation below, chances are higher it will dump again. Use proper risk management, if it forms the daily fvg, then take first entry from the 50% of daily fvg, 2nd from the entry mentioned, and hold till tp or SL.

Imbalance below range seems to be the current targetBlue zone is the bullish imbalance that was left behind last week.
Price only targets lows or imbalances below support during sell-offs. Let's see what we get with this one.
Gold: Overview 24.11This analysis is based on the Initiative Analysis (IA) method.
Hello, traders and investors!
The gold price on the daily timeframe is in a sideways range.
A seller initiative is active, with a target at 3928.
On the daily chart, the levels 4133 and 4154 are of interest for potential short opportunities, as well as the 4110 level — which is both an hourly timeframe level and the high of a seller candle with increased volume.
The first target for short positions is 3998.
Long positions should be considered only when we see signs of buyer strength on the daily timeframe — this may happen near 3998 or 3928.
Wishing you profitable trades!

Natural Gas: Correction Ahead?Pullback expected after five weeks of growth; key levels 4.283 and 4.194 in focus.
This analysis is based on the Initiative Analysis (IA) method.
Hello, traders and investors!
After five weeks of steady growth, natural gas now appears to be preparing for a correction.
On the daily timeframe, a sideways range has formed, and the seller’s formal target inside this range has already been reached.
On the 4-hour timeframe, we also see a sideways structure, but seller initiative is active. The current seller target is 4.194.
A large volume cluster has formed at the upper boundary of the range, and the price is now breaking downward from that area. This zone becomes a broad seller area at the top of the range.
It’s important to watch how the price reacts around 4.283, which represents 50% of the trading range. For now, the expectation remains the same: a move toward 4.194.
A good area to look for short entries would be around 4.392, if the price gives a pullback into that zone.
Wishing you profitable trades!

NZDCHF LONG3M is bullish and it's currently holding nicely above the 2020 high with early signs of bullish market structure, waiting for further confirmation, but it looks juicy here at the moment.

EURGBP | Bullish OutlookHTF Perspective:
Higher timeframe structure mapped and refined. Strong liquidity sits at 0.87623. Macro structure is bullish, reinforcing the upward trend.
MTF Perspective:
Mid-term mapped and followed. We spotted a sell-side liquidity sweep, after which price fell into near internal framework OBs, including a micro block underneath. This zone shows buy interest forming.
LTF Execution:
Waiting for lower timeframe confirmation to validate the shift/change. Once confirmed, buy points will be taken along the bullish leg targeting continuation into HTF highs.
Current Outlook:
Until LTF alignment occurs, we let Smart Money lead direction. Patience and discipline remain priority.
Let’s go!

CADJPY | Bullish OutlookHTF Perspective:
Higher timeframe remains bullish. Structure mapped and refined. Price broke significant highs, with HTF liquidity sitting at 109.558, a strong level to monitor. The macro bias is bullish, preparing for continuation.
MTF Perspective:
Mid-term mapped, spotting a sell-side liquidity sweep. Once liquidity is taken, price falls into our internal framework OBs, creating decisional zones for potential continuation plays.
LTF Execution:
Lower timeframes will confirm the shift/change in trend. Full candle bodies into the OB are required before considering entries — structure must validate the move.
Current Outlook:
Until LTF confirmation, we let Smart Money lead direction. Patience is key; no forcing trades.
Let’s go!

AUDCAD | Bullish Outlook
HTF Perspective:
Higher timeframe structure remains bullish. Price has been forming multiple courtyards (internal structures), signaling preparation for the next move.
MTF Perspective:
Waiting for the deep sell-side liquidity to be taken. So far, price is showing lower highs forming, which could act as resistance and indicate potential downward pressure.
LTF Execution:
If price reaches the mid-term order block, we’ll drop to lower timeframes to confirm structure and entries. Watch for lower-high breaks or flips before committing to continuation plays.
Current Outlook:
Until confirmations occur, we let Smart Money lead the direction. Patience is key — no forcing trades.
Let’s go!
