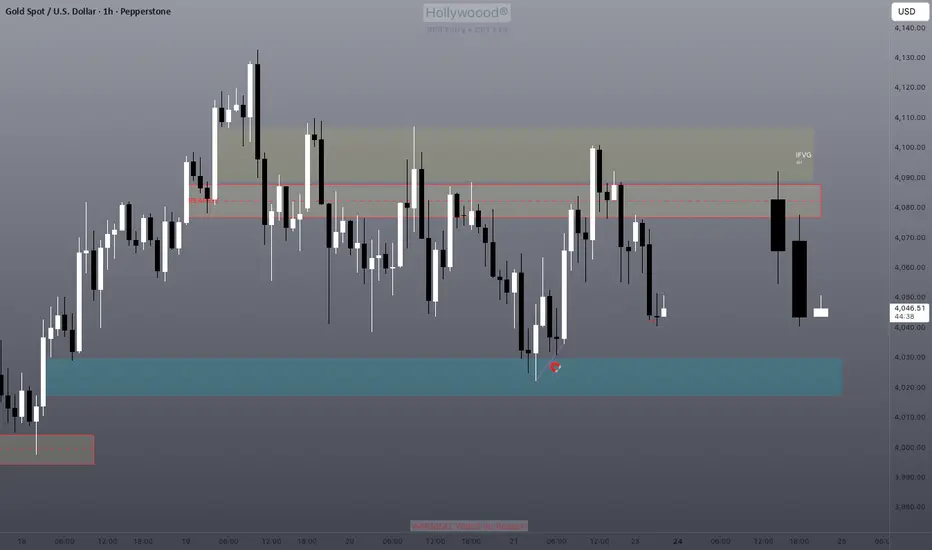
Imbalance below range seems to be the current targetBlue zone is the bullish imbalance that was left behind last week.
Price only targets lows or imbalances below support during sell-offs. Let's see what we get with this one.
Multiple Time Frame Analysis
Gold: Overview 24.11This analysis is based on the Initiative Analysis (IA) method.
Hello, traders and investors!
The gold price on the daily timeframe is in a sideways range.
A seller initiative is active, with a target at 3928.
On the daily chart, the levels 4133 and 4154 are of interest for potential short opportunities, as well as the 4110 level — which is both an hourly timeframe level and the high of a seller candle with increased volume.
The first target for short positions is 3998.
Long positions should be considered only when we see signs of buyer strength on the daily timeframe — this may happen near 3998 or 3928.
Wishing you profitable trades!

Natural Gas: Correction Ahead?Pullback expected after five weeks of growth; key levels 4.283 and 4.194 in focus.
This analysis is based on the Initiative Analysis (IA) method.
Hello, traders and investors!
After five weeks of steady growth, natural gas now appears to be preparing for a correction.
On the daily timeframe, a sideways range has formed, and the seller’s formal target inside this range has already been reached.
On the 4-hour timeframe, we also see a sideways structure, but seller initiative is active. The current seller target is 4.194.
A large volume cluster has formed at the upper boundary of the range, and the price is now breaking downward from that area. This zone becomes a broad seller area at the top of the range.
It’s important to watch how the price reacts around 4.283, which represents 50% of the trading range. For now, the expectation remains the same: a move toward 4.194.
A good area to look for short entries would be around 4.392, if the price gives a pullback into that zone.
Wishing you profitable trades!

NZDCHF LONG3M is bullish and it's currently holding nicely above the 2020 high with early signs of bullish market structure, waiting for further confirmation, but it looks juicy here at the moment.

EURGBP | Bullish OutlookHTF Perspective:
Higher timeframe structure mapped and refined. Strong liquidity sits at 0.87623. Macro structure is bullish, reinforcing the upward trend.
MTF Perspective:
Mid-term mapped and followed. We spotted a sell-side liquidity sweep, after which price fell into near internal framework OBs, including a micro block underneath. This zone shows buy interest forming.
LTF Execution:
Waiting for lower timeframe confirmation to validate the shift/change. Once confirmed, buy points will be taken along the bullish leg targeting continuation into HTF highs.
Current Outlook:
Until LTF alignment occurs, we let Smart Money lead direction. Patience and discipline remain priority.
Let’s go!

CADJPY | Bullish OutlookHTF Perspective:
Higher timeframe remains bullish. Structure mapped and refined. Price broke significant highs, with HTF liquidity sitting at 109.558, a strong level to monitor. The macro bias is bullish, preparing for continuation.
MTF Perspective:
Mid-term mapped, spotting a sell-side liquidity sweep. Once liquidity is taken, price falls into our internal framework OBs, creating decisional zones for potential continuation plays.
LTF Execution:
Lower timeframes will confirm the shift/change in trend. Full candle bodies into the OB are required before considering entries — structure must validate the move.
Current Outlook:
Until LTF confirmation, we let Smart Money lead direction. Patience is key; no forcing trades.
Let’s go!

AUDCAD | Bullish Outlook
HTF Perspective:
Higher timeframe structure remains bullish. Price has been forming multiple courtyards (internal structures), signaling preparation for the next move.
MTF Perspective:
Waiting for the deep sell-side liquidity to be taken. So far, price is showing lower highs forming, which could act as resistance and indicate potential downward pressure.
LTF Execution:
If price reaches the mid-term order block, we’ll drop to lower timeframes to confirm structure and entries. Watch for lower-high breaks or flips before committing to continuation plays.
Current Outlook:
Until confirmations occur, we let Smart Money lead the direction. Patience is key — no forcing trades.
Let’s go!

EURCAD | Bullish OutlookHTF Perspective:
Higher timeframe structure is bullish. Price is breaking significant highs with clean formations, confirming continuation bias.
MTF Perspective:
Mid-term view aligns with the bullish trend. After waiting for the sell-side liquidity sweep, price delivered the sweep and fell into our mapped order blocks. This provides the key decision zones for continuation.
LTF Execution:
On lower timeframes, we confirmed structure (shift of character). From there, buy positions were taken targeting mid-term and HTF highs.
Current Outlook:
Waiting for the market open to see continuation toward the upside. Let Smart Money lead the direction.
Let’s go!

AUDJPY | Bullish OutlookHTF Perspective:
Higher timeframe remains bullish. Price is breaking significant highs, confirming the bullish macro structure.
MTF Perspective:
On the 30-minute timeframe, we spotted a sell-side liquidity sweep. Price took that liquidity and pulled into our internal framework OB sitting underneath. This OB represents a key mitigation zone.
LTF Execution:
From here, we’ll drop to lower timeframes to confirm the testing area:
• Look for lower-high break
• Pullback on the bullish leg
• Take buy points targeting mid-term and higher-timeframe highs
Mindset:
Until LTF confirmation, let Smart Money lead direction. Patience and discipline remain priority.
Let’s go!

CHFJPY | Bullish OutlookHTF Perspective:
Higher timeframe remains bullish. Price is making significant breaks to the upside, continuing the bullish narrative.
MTF Perspective:
Mid-term structure is aligned with the trend. We waited for the sell-side liquidity sweep, which has occurred. Price has now fallen into our near internal framework OB.
We’re observing if this OB holds as a reaction zone. If not, the next OB below becomes the true decisional zone. Both testing areas have the potential to flip back to bullish, setting up a continuation toward breaking major highs.
LTF Execution:
Lower timeframes will provide confirmation through structure shifts and inducements. Until then, we let Smart Money lead the direction.
Mindset:
Patience > prediction. Wait for clean confirmations. Let price do the talking.
Let’s go!

EURJPY | Bullish OutlookHTF Bias: Bullish
Higher timeframe structure remains clean to the upside. Macro momentum is still favoring continuation.
MTF View:
Mid-term structure aligns with the bullish trend. After the sell-side liquidity sweep, we want price to fall into our near internal framework OB before looking for the next leg.
LTF Execution Plan:
Once price reaches that OB, drop to lower timeframes (5M and below) to confirm:
• Lower-high break signaling a shift/change in trend
• Price pulling back into the refined OB to align with the trend continuation
Until then, we wait and let Smart Money lead the direction.
Patience and discipline over forcing moves.
Let’s go.

GBPJPY | Bullish OutlookThe higher timeframe remains firmly bullish, so the macro direction is already set.
Right now, it’s all about letting price complete the cleanup phase before we position for continuation.
⸻
🔹 HTF Narrative (4H & Above):
• Market is in a clear bullish structure
• We already broke a previous Higher High (HH)
• Now we’re waiting for price to clean out sell-side liquidity
• After the sweep, expectation is a drop into our Turn-Off Framework OB (the refined HTF demand)
Nothing to force — smart money is setting up the next leg.
⸻
🔹 Mid-Term Structure (30M – 2H):
The midterm flow is simple:
• Bias remains bullish
• We just need the sell-side sweep to confirm the discount pricing
• Once price taps the midterm OB inside the HTF zone, we’ll reassess order flow
• This becomes the first part of your 1–2 midterm continuation sequence
We’re waiting for price to come home before the trend resumes.
⸻
🔹 LTF Execution Layer (5M):
This is where the continuation becomes tradable.
What we’re waiting for:
• A clean Lower High (LH) breach to confirm the LTF shift
• A controlled pullback into a refined OB
• Continuation of the bullish leg once structure and order flow align
This is the classic 1–3–10 continuation pattern:
1. Sweep
2. Shift
3. Pullback
4. Trend expansion
Once all three layers line up, the continuation becomes high probability.
⸻
🔹 Final Outlook:
Right now, it’s simple:
Sweep → Tap Framework OB → LTF Flip → Continue Bullish.
Until that sequence completes, we wait for smart money to set the direction.
Let price come to us — not the other way around.
Let’s work.

GBPUSD | Bulish Bias After SSL Sweep
The higher timeframe continues to confirm a bullish environment.
Price swept the sell-side liquidity and tapped directly into a strong 4H demand zone, showing clear intention from institutions to accumulate at discounted territory.
That sets the macro narrative: HTF bullish.
⸻
🔹 HTF Narrative (4H & Macro):
• Major SSL sweep completed
• Price reached deep into discounted territory
• Clean reaction from 4H demand
• HTF structure still intact on the bullish side
• Displacement out of demand confirms higher timeframe control
This is where the shift begins: liquidity taken → premium to discount → demand mitigation → displacement.
⸻
🔹 Mid-Term Structure (30M – 2H):
This is where the bullish argument truly aligns.
• A Lower High (LH) was broken, creating the first real structure shift
• That break delivered a clear CHoCH, confirming bullish intent
• Price then reached into a refined OB inside discounted territory
• This OB becomes our decisional structure point, aligning perfectly with HTF demand
Mid-term confirms the path:
Sweep → shift → return to discount → decisional OB → continuation.
You’re now fully aligned top-down.
⸻
🔹 LTF Execution Layer (5M):
This is the part that confirms whether the macro narrative deserves entries.
Price behavior delivered exactly what we needed:
• LTF respected structure perfectly
• Minor LHs were breached, confirming a micro shift
• The internal flip aligns with the mid-term CHoCH
• After liquidity was taken, price began respecting the bullish order flow
This is your 5M green light:
LTF break of structure + liquidity taken + order flow flip.
When top-down aligns like this, it’s clean, mechanical, and consistent.
⸻
🧠 Final Notes:
The entire flow is textbook:
HTF sweep → Demand reaction → Mid-term CHoCH → OB in discount → LTF flip → Move with price.
Nothing forced.
Nothing chaotic.
Just structure doing exactly what it’s supposed to.

Long trade
Trade Journal Entry
Pair: LINKUSDT.P
Trade Type: Buyside Trade
Date: Sat 22nd Nov 25
Time: 3:00 pm
Session: NY Session PM
Timeframe: 15 min
1. Trade Parameters
Entry: 11.975
Profit Level: 12.922 (+7.99%)
Stop Level: 11.922 (−0.43%)
Risk-to-Reward: 18.06 R
2. Context & Structure
The setup follows a three-session accumulation sequence (Tokyo → London → NY), forming a descending wedge within the discount range of the prior bearish leg.
The London session sweep of liquidity below 11.80 marked the final inducement before NY expansion.
The Daily Open acted as a midpoint magnet where price consolidated before displacement.
BOS (Break of Structure): confirmed on NY PM session with clear displacement above the Asian high.
EMA alignment:
50 EMA crossed above 200 EMA, signalling intraday structural reversal.
Both EMAs now serve as dynamic support zones.
3. Liquidity Story & Smart-Money Model
The sell-side liquidity beneath the 11.70–11.80 range was swept before bullish expansion.
Imbalance/FVG blocks between 11.83 – 12.18 were efficiently filled on the breakout, leaving new unmitigated FVGs below for potential re-entries.
PD Array narrative:
The price transitioned from a discount (accumulation) to equilibrium, with current targets aimed at premium inefficiencies (12.80–12.95). Multiple internal FVGs (12:18 → 12:45 → 12:68) act as continuation stepping zones.
4. Wyckoff / SMC Alignment
Wyckoff Phase Observation ICT / SMC Equivalent
Phase C London sweep of the range lows, Liquidity inducement
Phase D NY displacement through range high Break of Structure (BOS)
Phase E Retest of bullish order block & continuation
FVG + OB confluence entry
5. Volume & Confirmation
Noticeable increase in volume during the breakout of the wedge — signalling institutional participation. Volume distribution shows progressive expansion on bullish candles and contraction on retracements, consistent with smart-money accumulation → expansion behaviour.

BTCUSD Swing TradePrice just mitigated an active Demand Zone. Am bullish on this pair.
Manage risk effectively

ETH Down to 2450The reason for the trade is
1) Downtrend
2)The selling volume near the entry zone is very high(strong selling from the zone on Thursday 20 Nov)
3) 1hr Demand Just above the entry
4) Fair value gap still pending
There was a strong supply zone around 2620 which got tapped on Friday 21 Nov, to break through that zone, the market is consolidating and will need strong selling to go further down to our next target 2450. Market is slowly moving towards the demand zone right above 2950 from where it can get the selling power required to break the 2620 zone.
P.S:- Due to weekend the market won't follow the trend line drawn.

Long trade
15min TF overview
🟩 Pair: TONUSDT.P
Direction: Buyside Trade
Date: Sat 22nd Nov 25
Time: 3.00 pm
Session: NY Session PM
Timeframe: 15 minutes
Model: Accumulation → Manipulation Sweep → Expansion
🔹 Trade Details
Entry: 1.5217
Profit Level: 1.7829 (+13.57%)
Stop Level: 1.5139 (–0.51%)
Risk-Reward Ratio: RR 26.47
Optimal Trade Entry (OTE)
NY PM session liquidity window
FVG boundary
Breaker block origin
Discount within the swing range
TP zones
1. Internal Liquidity: 1.563 – 1.585 (NY session high cluster)
2. External Liquidity: 1.7005 price level (major inefficiency fill)
3. Premium Imbalance Completion: 1.7829 (Your target)
🔹 Sentiment & Narrative Analysis
Market Cycle Phase:
Micro accumulation inside macro distribution.
Psychological Narrative:
We anticipated that retail traders would be selling the breakdown at the wedge lows, providing liquidity for smart money. With the NY PM session acting as the catalyst for expansion, with price drawn towards the premium side, inefficiencies positioned above.
Sentiment:
Turning from fear → disbelief → rally.

BTC/USD potential short on 89000kPositioning for a potential short as price approaches a high-confluence rejection zone.
The setup aligns multiple factors: 66% Fibonacci retracement, 1H FVG, S/D zone, the 89,000 level, and the descending trendline.
Waiting for price to tap into this cluster and show exhaustion before confirming entry.
If the rejection holds, I anticipate a corrective move toward lower liquidity levels. Setup becomes invalid if price reclaims the zone cleanly above 89,000–90,000.

BTC: price enters the buyer zone (86,000–79,500)This analysis is based on the Initiative Analysis (IA) method.
Hello, traders and investors!
On the monthly timeframe, the last buyer candle with increased volume appeared a year ago — in November 2024. From that point, buyers attempted to resume the trend twice.
The first attempt — in January — formed the level 89,256.
The second attempt came after a manipulation of the 89,256 level between February and April 2025.
This led to the formation of a new buyer initiative with:
— upper boundary at 126,199,
— lower boundary at 74,508.
The current buyer target from this initiative is 109,608.
Now the price has returned to the volume accumulation zone created during that manipulation — the 86,000–79,500 range.
The blue band on the chart marks the minimal price range where 50% of the candle’s volume was accumulated.
The blue line marks the price of the maximum volume inside that candle.
The daily candle from 21.11 has entered the 86,000–79,500 range with the largest volume since April 2025.
(And April 2025 was exactly when the 89,256 level manipulation took place.)
This confirms buyer interest in this price zone.
This daily candle is part of the forming seller initiative.
The upper boundary of this seller initiative is 93,836, while the lower boundary is not yet defined, as the seller move has not been stopped by a buyer candle.
Any market scenario remains possible. With strong seller pressure, the price may fall below 74,508 (lower boundary of the monthly buyer initiative) or even below 66,835 (the low of the November 2024 buyer candle).
A consolidation phase is also possible — and even the most likely — but for that, we first need to see a buyer candle, followed by a return to 89,256 or higher.
We continue to monitor the situation.
Wishing you profitable trades!

Why This Time Is Not Different — BTC Could Still Drop >50%Bitcoin is moving into a phase where long-term cycles matter more than whatever the market narrative happens to be this week.
And if you look at those cycles, one thing becomes clear: BTC has never avoided a major drop after making a new ATH.
1. The timing keeps repeating — almost to the day
Every big drawdown in Bitcoin’s history has lasted almost exactly the same amount of time:
Cycle 1: 371 days
Cycle 2: 378 days
Cycle 3: 378 days again
That kind of symmetry doesn’t happen by accident.
It’s a pattern driven by liquidity, leverage, miner economics and investor behavior.
Right now, BINANCE:BTCUSDT is lining up with that same timing structure once more.
2. The size of corrections is falling… but still huge
Past drawdowns:
–83%
–77%
The market is more mature now — more liquidity, more derivatives depth, more institutional money — so the volatility is naturally lower.
But “lower volatility” in Bitcoin still means:
👉 –50% to –70% corrections
And a drop in that range would land BTC somewhere around $40k–$50k, which is consistent with the historical pattern.
3. Market maturity doesn’t erase Bitcoin’s cycles
Even with ETFs, institutional flows, and a stronger market structure, BTC still reacts to:
leverage resets
liquidity tightening
miner selling pressure
sentiment washouts
These things don’t disappear just because the market grows.
4. What the full cycle is pointing to
If the cycle keeps rhyming with the past:
Potential bottom: roughly late 2026, at the end of another ~370–380 day drawdown
Next peak: around 2028
Long-term target: $120k–$150k+
The rhythm remains the same:
big drop → long consolidation → explosive recovery.
Takeaway
This time isn’t different.
Even in a more “institutional” Bitcoin, the cycles still point to a >50% reset before the next major expansion.

EURGBP Short position Weekly Fib completion which indicates reversal.
We received a bearish candle last week.
Daily H&S

BTCUSD SIGNALThis signal is generated through a refined multi-layer technical analysis approach, combining market structure, momentum dynamics, and confirmation from key indicators. The aim is to deliver a clear, high-probability trading opportunity with well-defined risk parameters and realistic profit targets.
The setup focuses on identifying shifts in liquidity, institutional price behavior, and reaction zones where the market historically forms strong reversals or continuations. Each signal is designed to provide traders with a structured plan, allowing disciplined execution in both trending and ranging environments.
📌 Signal Details
Entry Level: Carefully selected based on structural confirmation and volume behavior
Stop-Loss (SL): Positioned at a logical invalidation point to protect capital
Take-Profit (TP): Target zones aligned with market structure, volatility projections, and liquidity pools
Analysis Insight: Short explanation of the setup and the reasoning behind the direction
Alternative Scenarios: Expected market reaction if price breaks or rejects a key level
⚠️ Risk Notice
This signal is intended for educational and analytical purposes only. It does not constitute financial advice. Market conditions can change rapidly, and it is important to manage risk responsibly and follow your own trading rules.
