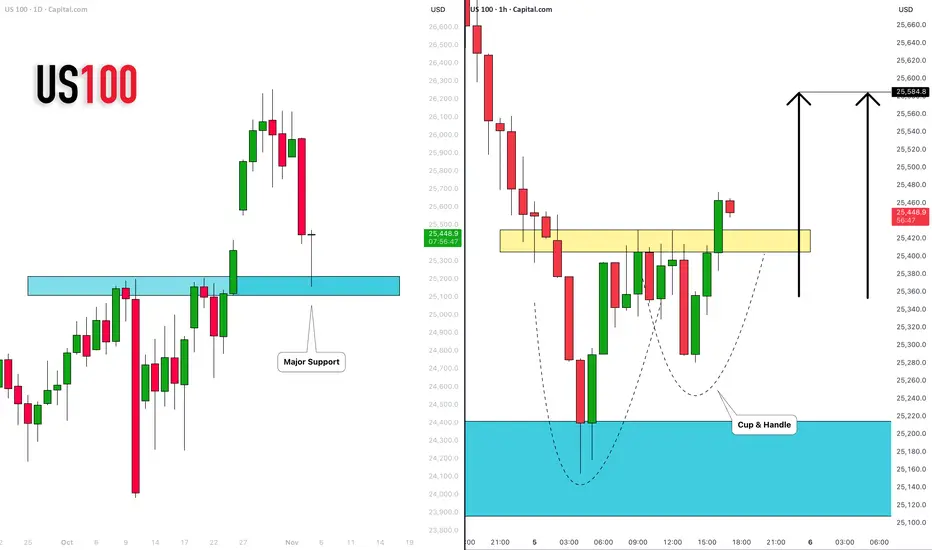
NASDAQ INDEX (US100): Time to Recover
US100 index dropped yesterday, as I predicted.
The market is recovering now, after a test of a major daily support cluster.
A formation of a cup & handle pattern on that and a breakout of its neckline
indicate a strong buying pressure.
With a high probability, the market will rise and reach 25580 level soon.
❤️Please, support my work with like, thank you!❤️
I am part of Trade Nation's Influencer program and receive a monthly fee for using their TradingView charts in my analysis.
Multiple Time Frame Analysis
EURCAD POTENTIAL LONG OPPORTUNITY....REACTION TRADEHey hey TradingView family! Hope you guys are doing amazing! Joseph here AKA JosePips just wanted to make a quick post on a reversal long opportunity I see on the EURCAD currency pair! So let's dive straight into it
OK so first things first. Higher timeframe. When looking at this currency pair on the weekly & above timeframes (which hold the most weight) we can see that price is obviously sitting @ multi month & year highs. So you may be wondering...why are you saying to buy it then? lol. Well the truth is that just because the monthly and weekly show something doesn't mean there isn't opportunity on other timeframes...and for this I see opportunity on the daily for a reaction from the buyers to the upside. Here's why...
1. Price is pulling back into area of demand (previous buyer zone)
2. Coming off of multiple weeks of pullback (good discount)
3. Lot's of technical confluence lining up in this area (demand & RSI)
4. Fib extension from previous daily impulse move (-61.8 level) as confluence
So there are multiple reasons why this setup looks interesting and technically is showing us that there is like to be some sort of REACTION from this zone of demand!
So hope you guys find some value from this and can help in your analysis and market trading. Please boost this and follow my page for more content!
Cheers!

Bitcoin: Sellers Pushed the Price Below the RangeThe price tested the 50% level of the monthly range (100,353)
Hello, traders and investors!
This analysis is based on the Initiative Analysis (IA) method.
On the daily timeframe, the market remains in a sideways range, and the seller initiative managed to push the price below its lower boundary.
The price also interacted with the 50% level of the monthly trading range — 100,353.
These two factors may trigger buying activity and a potential return of the price back into the range.
Within the seller initiative, we can see four seller candles with increasing volume, with the highest volume at the bottom — the IC candle.
To look for buying opportunities, the price needs to return into the range.
Absorption of the seller’s IC candle would be a good sign to start looking for long setups.
Nearest key levels on the daily timeframe:
— Lower boundary of the range — 102,000
— High of the seller candle that broke the lower boundary — 107,299
If we look at the 1-hour timeframe, there’s also a nearby level at 107,672, which corresponds to the 50% level of the hourly trading range.
If buyers start to move, it will be important to watch how they handle the 107,299–107,672 zone.
Wishing you profitable trades!

EU BuyAlthough this is a risky area to take a trade, I still see some potential for it to make a move to the upside. Lets see what EU brings today.

Short trade
📘 Trade Journal Entry
Pair: EURUSD
Direction: Sell-Side Trade
Date: Wed 5 Nov 25
Time: 7:00 am
Session: LND to NY Session AM
Timeframe: 1 Hour
🔹 Trade Details
Metric Value
Entry 1.15156
Profit Level (TP) 1.14109 (+0.83 %)
Stop Level (SL) 1.15409 (–0.21 %)
Risk–Reward (RR) 3.94 R
🔸 Technical Context
Market Structure:
Price remains in a confirmed bearish sequence following prior BOS and CHOCH events on both 15m and 1H timeframes. A rejection from the breaker block / FVG zone (1.1550–1.1560) confirms institutional supply continuation.
Confluence Factors:
15m CHOCH aligned with 1H BOS confirms lower-timeframe structure compliance.
Retest into the premium array post–liquidity sweep at London open.
KAMA (Adaptive MA) sharply turning down, reinforcing directional bias.
Volume contraction during retrace → expansion upon sell-side continuation.
Key Liquidity Zones:
Supply Rejection Zone: 1.1550–1.1560 (Breaker Block).
Target Zone: 1.1410–1.1400 (PD Array / Daily Imbalance Fill).
Extended Target: 1.1360 (Liquidity resting beneath prior daily swing lows).
🔹 Narrative & Bias
EURUSD continues to trail the broader USD recovery phase, mirroring setups seen across AUDUSD and NZDUSD. The setup captures the rejection of mid-range liquidity and the initiation of a new impulsive leg toward the next demand cluster.
Session Flow:
The London session provided a retracement into premium levels.
NY open accelerated displacement, confirming sell-side intent.
Macro Sentiment:
Hawkish Fed comments reinforcing dollar bids.
European data softening; ECB maintaining cautious tone.
Bond yield spreads are widening in favour of USD.
Projection:
Price expected to extend toward 1.1410–1.1400 with potential for continuation into 1.1360, completing the liquidity draw beneath October’s swing lows.

Short trade
Pair: NZDUSD
Direction: Sell-Side Trade
Date: Wed 5 Nov 25
Time: 1:00 am
Session: London Session AM
Timeframe: 4 hours
🔹 Trade Details
Metric Value
Entry 0.56548
Profit Level (TP) 0.55855 (+1.23 %)
Stop Level (SL) 0.56609 (–0.11 %)
Risk–Reward (RR) 11.36 R
🔸 Technical Context
Structure:
NZDUSD has completed a BOS and CHOCH sequence after a corrective retracement into premium, confirming continuation of the broader downtrend.
Price rejected from the breaker block + imbalance zone (0.5660–0.5680) with displacement, validating sell-side control.
Confluence Factors:
Clear BOS alignment on both 1H and 4H timeframes.
Fair Value Gap (FVG) mitigation on the retest; displacement followed immediately after.
KAMA (adaptive MA) sloping downward — confirming trend direction.
Volume: Elevated at breakdown, signalling institutional execution.
Key Liquidity Zones:
Sell Entry Zone: 0.5650–0.5660 (breaker block rejection).
Liquidity Target: 0.5580–0.5560 (previous move origin + CHOCH base).
Extended Target: 0.5480 zone (major liquidity resting beneath March swing lows).
🔹 Narrative & Bias
The trade aligns with USD dominance across the board, as observed in correlated FX pairs (AUDUSD, EURUSD).
The pair continues to distribute beneath previous structural highs, forming lower highs across multiple sessions.
Macro Alignment:
RBNZ outlook: Neutral-to-dovish amid slowing NZ CPI.
USD tone: Strength supported by safe-haven demand, following tech sector profit-taking and ETH sell-side continuation.
Projection:
Expect price to continue targeting deeper liquidity toward 0.5580–0.5560, with potential extension to 0.5480 should downside momentum persist. Maintaining sell bias as long as price remains below 0.5660 (BOS invalidation threshold).

AUDJPYDaily TF reached a strong resistance zone around 101.000 and fell off making H4 TF and below turn bearish. Last H1 support zone around 99.800 - 100.000 was broken and has been retested a couple of times holding price below it. We could see price continuing downwards to next strong support

AUDUSD sell setupOne of the most beautiful sell setup this week. AUDUSD swept a noticeable liquidity high at Supply level, then after CPI news yesterday confirming dollar strength, This led to clear Market structure shift (mss) on XXX/USD pairs.
Retest of the move today confirmed downward pressure on the pair. OB mitigation + imb
As far as there's a prescence of market gap below, my bearish bias is not yet invalidated.
Learn!

GBPCHFSwing sell setup. Valid Sell cause price will sweep the liq above while mitigating supply and also go in line with OHLC of Monthly timeframe candle. Note that price is at a supply area at the moment so continuous selling from there is also valid.
Manage risk!


BITCOIN (BTC/USD): Can 100K Support Hold - A Pullback in SightBitcoin may experience a rebound from a significant daily historical support level.
Following its test, the price formed a double bottom pattern on an hourly timeframe and has successfully broken above its neckline.
I anticipate a bullish movement towards 104,000.

Nasdaq Selloff Extends in Asia — But How Bad Is It, Really?Asian markets saw a second wave of selling today, with Nasdaq futures falling around 1% during Asian trade. After fielding several emails from journalists asking “why,” I can’t help but think this move may be more about technical repositioning after an extended run higher.
In this video, I walk through the monthly, weekly, and daily Nasdaq charts to share where I think we could go from here.
Matt Simpson, Market Analyst at City Index.

XAU/USD Update 1Next move on the way, focus on proper risk management & stay discipline. Wishing you successful trades..!
Key Reason:
1. 1H OB key point.
2. Fresh and unmitigated Supply order flow still in pending.
3. SIBI still in pending.
4. Possible downside move expected from this zone.
Confirmation is most important part of this analysis. Let's see how it will work.

Short trade
Day TF overview
📘 Trade Journal Entry
Pair: ETHUSDT.P
Direction: Sell-Side Trade
Date: Tue 4 Nov 25
Time: 12:40 pm
Session: NY Session PM
Timeframe: 1 Day
🔹 Trade Details
Metric Value
Entry 3,983.39
Profit Level (TP) 3,000.44 (+11.71 %)
Stop Level (SL) 4,141.42 (–4.7 %)
Risk–Reward (RR) 1:8.68
Projected Target
(Extended) 2,577.25 (–34.14 %)
🔸 Technical Context
Market Structure:
ETHUSDT has completed a Preliminary Supply → Buying Climax → UTAD sequence indicative of Wyckoff Distribution Phase C–D. Price has broken below the Change of Character (CHOCH) level at 3,900, confirming a bearish bias. The Breaker Block formed near 4,050 was retested and rejected — validating institutional sell-side control.
15min ~ TF overview
Fair Value Gaps (FVGs):
Multiple downside FVGs remain unmitigated between 3,800 → 3,000, offering magnet zones for draw-on-liquidity targets.
Daily inefficiencies suggest further markdown toward the 3,000 handle.
Confluence Factors:
Adaptive KAMA turning downward (bearish momentum confirmation).
High-volume rejection wicks at the 4,100–4,150 zone (supply confirmation).
A daily displacement candle formed after the retest (institutional order flow shift).
🔹 Narrative & Bias
ETH is transitioning into a markdown leg after completing a multi-month accumulation rally.
The rejection at 4,100 aligns with the broader crypto sector rotation into BTC dominance and short-term USD strength.
Phase Alignment:
Wyckoff Distribution → Phase D to Phase E progression.
Characterised by lower highs and successive liquidity sweeps.
Macro Sentiment:
BTC outperforming ETH across cross-pairs (ETHBTC ratio declining).
The market is reacting to tightening liquidity and lower risk appetite post-Fed communications.
Projection:
Primary target: 3,000 zone (daily FVG mitigation + PD array).
Extended target: 2,577 (institutional discount zone aligning with prior accumulation base).
Continuation bias is valid while below 4,050 resistance and until FVGs below 3,200 are filled.

220% Ethereum rally to $14,000 in 16 weeks? - October 2025...if… and a big if, past resistance confirms as support.
A few months ago the idea “ Ethereum blockchain to $6.6k before dying a slow death ” was published by myself in August. The premise behind the bearish outlook is simple enough, the legacy support curve has failed.
A recent question to this idea “Ww what would it take to invalidate this bearish outlook?”
Please remember, I do not hold this asset or have any interest in it. My opinion is impartial.
Two questions all traders and investors must ask:
1. What is the trend?
2. Support and resistance, which is it?
You’d be surprised how few actually master those questions, instead preferring the ramblings of the influencer. If you’re reading this, congratulations, you already have patience by making it past the headline. So few do! Let’s have an example:
On Ethereum:
Question 1 is positive, an uptrend. Ethereum printed a higher low back in April at $1600
Question 2 is negative, price action is very much trading under resistance.
I tell you all that to tell you this, it is entirely possible question 2 returns positive with a break of resistance. If a resistance breakout of $4400 occurs AND a 2 week candle body close (ignore wicks) on or above $4500, then in all likelihood the bearish outlook is void. A resistance breakout and support confirmation would see price action continue to rally until $14k, the cycle top.
The technical analysis
A new 2 month candle shall print next month (November) on the above 2 month chart.
Over the last year price action saw resistance at 3400. It is incredible that price action continued to trade in this area for so long until July 2025 breaking the 1st resistance.
The recent liquidation event saw price action once again test the 3400 area. It was no surprise price action saw strong demand from this level after trading as resistance for over a year. The folks that panic sold at this level almost certainly made a mistake.
Price action is now about to do something very important. IF price action closes the 2 month candle above 4400 in the month of October, then you’ll have a positive answer to question 2!
A confirmation of support on past resistance.
Positive answers to questions one and two is a green light for a long entry. And more importantly a cancellation of the bearish idea.
Why $14k forecast?
For this we return to the log growth curve. Like Bitcoin, Ethereum is despite the forecast, an asset rotating from growth to how can I say “Nothing burger”. If you buy the top you’ll be holding onto an asset that trades sideways for 10+ years.
Ethereum continues to see growth rising until its breakdown in April 2022, the red arrow. A break of growth does not mean price action cannot continue to rise, but it does mean the rate of growth is now in decline. The medium growth (black line) that was past support is now due a resistance test.
Why should this offer resistance now when it broke up in March 2021?
Each market top of Ethereum (just like Bitcoin) saw price action top out at a reduced resistance Fibonacci level (black arrows). The next level down just so happens to be beneath the medium growth curve. Coincidence?
2 week
There’s more.. the same forecast is also matched by a Cup and Handle pattern. Now that’s more than a coincidence.
2 week Cup and Handle
Conclusions
Ethereum’s technical structure is approaching a decisive moment. The 2 month close for October will likely determine whether the long standing resistance at $4,400–$4,800 transitions into confirmed support, a shift that would completely invalidate the prior bearish outlook.
If this confirmation occurs, the path toward $14,000 becomes not just plausible but technically justified. The convergence of a resistance support flip, the log growth curve retest, and a textbook Cup and Handle formation would signal strong alignment across multiple timeframes, a rare occurrence.
However, perspective is essential. A 220% move from current levels, while substantial, is not unprecedented in this market and may even lag behind opportunities elsewhere, particularly in equities and emerging sectors. Ethereum’s macro trend remains in a phase of decelerating growth; even if this rally unfolds, it may represent the final euphoric leg before a prolonged consolidation era.
In short, Ethereum to $14k if and only if resistance confirms as support. Until then, patience, not prediction, remains the edge.
Ww
Disclaimer:
This post is for educational purposes only and reflects my personal opinion, not financial advice. I don’t hold a position in Ethereum and have no vested interest in the outcome of this analysis.
Always do your own research, manage risk, and make decisions based on your own strategy and timeframe. Markets reward patience, not predictions.


btcusdtAfter breaking the daily trend, the price is moving towards the opposite level of the daily trend, and on its way, the weekly trend has also been broken. If the price remains within these ranges and the weekly break consolidates, it will reach the lower levels of the weekly zone.

AUDCAD SHORT Market structure bearish on HTFs 3
Entry at Daily AOI
Weekly Rejection at AOi
Daily Rejection at AOi
Previous Structure point Daily
Around Psychological Level 0.92000
H4 Candlestick rejection
Rejection from Previous structure
TP: WHO KNOWS!
Entry 95%
REMEMBER : Trading is a Game Of Probability
: Manage Your Risk
: Be Patient
: Every Moment Is Unique
: Rinse, Wash, Repeat!
: Christ is King..

NZDCAD SHORT Market structure bearish on HTFs DW
Entry at both Weekly And Daily AOi
Weekly Rejection at AOi
Previous Weekly Rejection at AOi
Daily Rejection at AOi
Previous Daily Structure Point
Around Psychological Level 0.80500
Touching EMA H4
H4 Candlestick rejection
TP: WHO KNOWS!
Entry 100%
REMEMBER : Trading is a Game Of Probability
: Manage Your Risk
: Be Patient
: Every Moment Is Unique
: Rinse, Wash, Repeat!
: Christ is King.

Is a visit to $100k about to print for Bitcoin? - October 15thUp’October is widely expected, myself included. Statistically speaking the 2nd October post Halving is a strong green month. All the influencers are talking about it. That was until the largest forced liquidation event in the history of the asset class wiped out $19billion. What a number. One man, one tweet = mass panic.
The liquidations cascaded one after the other sending a number of alternative tokens all the way to near zero before quickly recovering. Confidence in the Ponzi scheme has taken quite a hit. In fairness market participants must accept some blame, 80% of the money entering the space was on leverage products with the small remainder into spot positions. In summary the liquidity in the spot market is near non existent. No one is touching it, which was first identified in the " Is alt season dead? " idea.
The technical analysis
Price action follows an upward trending channel on the above 4 day chart. Price action has recently rejected the medium line and confirmed it as resistance for the 3rd time. Look left, previous events sent price action to the lower side of the channel. Is this time different?
“Strong” and “weak”, notice the labels here? When price action tests the Gaussian channel (uptrend or downtrend) it is expected to bounce strongly as a confirmation of the current momentum behind the trend.
The test at this moment is a 4 day candle that prints today, the reaction to the channel has been anything but strength, it is complete weakness. This is what happens when interest in the asset is sub-zero, buyers are nowhere to be seen.
** It is highly likely price action shall test the lower side of the channel should a candle body print inside the channel **
In order words, price action will correct to $92k should it drop in a straight line. Looking left a period of up to 30 days is likely to follow before a test. The channel is rising and price action would likely be around $102k by mid-November.
** This will be the reddest October ever! **
$102k, a line in the sand
Price action at this level cannot fail support as shown on the above 4 day chart. Broken market structure would be confirmed should a candle body close under this level. That would mean Bitcoin entered a bear market and trend reversal.
Conclusions
Bitcoin has now reached a point in the structure where the reaction must be strong, but it isn’t. The rejection from the channel midline for the third time and the subsequent weak Gaussian test are not the signs of a healthy uptrend.
If price action fails to hold, it risks closing a 4-day candle body inside the Gaussian channel, a condition that historically precedes a move to the lower boundary. Based on the current slope, that lower test aligns near $92,000 tomorrow and $102k by mid-November.
There’s still room for recovery, but it must happen immediately. The longer Bitcoin trades near channel support with low volume, the greater the probability of structural failure.
Should a confirmed close occur below $102k, that would officially mark the first trend reversal since the 2024 post-halving rally, a shift from expansion to contraction. In simple terms, a break below this level transitions Bitcoin from bull to bear.
For now, October’s historical strength remains a statistic, not a guarantee. The market doesn’t care what month it is, only where the liquidity is.
Ww
====================
Disclaimer
This analysis is for educational purposes only and expresses personal opinion, not financial advice. I hold no position in Bitcoin and no vested interest in it.
Cryptocurrency markets are volatile and unpredictable. Always conduct your own analysis, manage your risk carefully, and never trade solely based on another person’s idea.
Patience, confirmation, and risk control, the only things that survive every market cycle.

USDJPY LONG Market structure bullish on HTFs 3
Entry at both Weekly and Daily AOi
Weekly Rejection At AOi
Daily Rejection at AOi
Previous Daily Structure Point
Around Psychological Level 153.000
Touching EMA H4
H4 Candlestick rejection
Rejection from Previous structure
TP: WHO KNOWS!
Entry 110%
REMEMBER : Trading is a Game Of Probability
: Manage Your Risk
: Be Patient
: Every Moment Is Unique
: Rinse, Wash, Repeat!
: Christ is King.

Is Rivian about to tumble into Bankruptcy? <EV market adoption is saturating, in my opinion. And don’t get me started on environmental benefits with which this whole debacle began. If demand for electric vehicles drop before the environmental “payback” period (when EV use starts offsetting the emissions from production), then:
The upfront emissions from mining and refining critical minerals would still have occurred.
The long-term climate benefits from cleaner driving wouldn’t materialise.
Which means the net effect could actually worsen global warming in the short to medium term, since we’d have massive energy use and emissions from mining and manufacturing,
That's better, get the rant over with sooner than late.
The background
The net zero drive has been incredibly frustrating to watch unfold, a forced movement, without being fully thought through.
The race to the bottom further emphasised as Chinese firms like BYD who are able to undercut almost every other manufacturer, regardless of the production environmental impact. The hypocrisy knows no bounds. Especially as you consider a net zero initiative requires a mass scale solution. How is niche purchasers of mass off road SUVs to contribute to this change?
If you ignore the environmental gesture owners convince themselves on purchase, what would you rather use off-road in a snow covered mountainside? Yeah..
Recently I had an opportunity to share a ride in a 4-5 year old Tesla. It was notable how quickly tech has dated, like last year’s iPhone. It's still good but Meahh. The interior cabin looked like a lost 1990's Starbucks corner where hope went to die and the vacuum cleaner on strike. Do serious coffee drinkers still use Starbucks? Anyway…
The technical
A while back the unpopular idea “ eVTOL manufacturer Lilium on the verge of 80% collapse? ” was published. This annoyed fanboys convinced the Jetsons future would be here any moment.
And collapse it did. The business was drowning in debt, technically weak, spending energy on a product no one wanted. Who on earth wants a flying battery with all the complications that includes when the proven technology of the helicopter and safety record continues to succeed? If it works, don’t fix it. Unfortunately Rivian and their investors din’t get that memo.
On the above 2 week chart, Rivian’s technical setup and fundamentals appear to be converging in a way that suggests significant downside risk. From a chart perspective, the descending triangle pattern, coupled with multiple bearish engulfing candles and a series of lower highs, highlights persistent selling pressure. These are classic hallmarks of a weakening structure. A decisive breakdown from the triangle could, based on prior measured moves, imply a potential ~60% decline from current levels. On the fundamental side, the headwinds are equally stark:
$5 billion in debt,
Negative P/E ratio (~–4.17),
$11 million in monthly interest obligations,
Continued margin pressure in a slowing EV market.
If consumer demand plateaus before Rivian reaches cost efficiency and scale, the company could face liquidity stress or even solvency risk. This risk is amplified by rising competition, particularly from BYD and other cost efficient Chinese EV producers. In short, Rivian’s position in the premium EV niche looks precarious, both technically and structurally.
Conclusions
Rivian, oh, here we go. The electric SUV company that was gonna save the planet. I got those emails periodically in the spam filter. I doubt bankruptcy will stop them from arriving.
Yeah, apparently the world’s going green, right? We’ll all be driving electric trucks up mountains while saving polar bears. Brilliant. Except now they’ve got five billion dollars of debt and owe eleven million a month just in interest. That’s not a company, that’s a bloke with too many credit cards pretending he’s fine.
So yeah, technically, fundamentally, whatever you want to call it, it’s a mess. The chart says ‘down,’ the balance sheet says ‘help,’ and the investors are probably saying, ‘Where’s the exit?’
The only bullish thing left is the optimism of the shareholders. And that’s fading faster than a Tesla interior ;-)
Ww
====================================================
Disclaimer
This analysis is provided for educational and informational purposes only, whilst being a lot more environmentally friendlier than a new Rivian SUV. It represents personal opinions based on publicly available data and technical chart interpretation, not financial advice.
Trading and investing in financial markets involves substantial risk, including the potential loss of capital. Always conduct your own due diligence and consult a qualified financial advisor before making investment decisions.

NZDUSD SHORTsMarket structure bearish on HTFs 3
Entry at Both Weekly And Daily AOi
Weekly Rejection at AOi
Previous Weekly Structure Point
Daily Rejection at AOi
Previous Daily Structure Point
Around Psychological Level 0.57500
Touching EMA H4
H4 Candlestick rejection
Rejection from Previous structure
TP: WHO KNOWS!
Entry 120%
REMEMBER : Trading is a Game Of Probability
: Manage Your Risk
: Be Patient
: Every Moment Is Unique
: Rinse, Wash, Repeat!
: Christ is King.
