USDJPY LONG Market structure bullish on HTFs 3
Entry at both Weekly and Daily AOi
Weekly Rejection At AOi
Daily Rejection at AOi
Previous Daily Structure Point
Around Psychological Level 153.000
Touching EMA H4
H4 Candlestick rejection
Rejection from Previous structure
TP: WHO KNOWS!
Entry 110%
REMEMBER : Trading is a Game Of Probability
: Manage Your Risk
: Be Patient
: Every Moment Is Unique
: Rinse, Wash, Repeat!
: Christ is King.
Multiple Time Frame Analysis

Is Rivian about to tumble into Bankruptcy? <EV market adoption is saturating, in my opinion. And don’t get me started on environmental benefits with which this whole debacle began. If demand for electric vehicles drop before the environmental “payback” period (when EV use starts offsetting the emissions from production), then:
The upfront emissions from mining and refining critical minerals would still have occurred.
The long-term climate benefits from cleaner driving wouldn’t materialise.
Which means the net effect could actually worsen global warming in the short to medium term, since we’d have massive energy use and emissions from mining and manufacturing,
That's better, get the rant over with sooner than late.
The background
The net zero drive has been incredibly frustrating to watch unfold, a forced movement, without being fully thought through.
The race to the bottom further emphasised as Chinese firms like BYD who are able to undercut almost every other manufacturer, regardless of the production environmental impact. The hypocrisy knows no bounds. Especially as you consider a net zero initiative requires a mass scale solution. How is niche purchasers of mass off road SUVs to contribute to this change?
If you ignore the environmental gesture owners convince themselves on purchase, what would you rather use off-road in a snow covered mountainside? Yeah..
Recently I had an opportunity to share a ride in a 4-5 year old Tesla. It was notable how quickly tech has dated, like last year’s iPhone. It's still good but Meahh. The interior cabin looked like a lost 1990's Starbucks corner where hope went to die and the vacuum cleaner on strike. Do serious coffee drinkers still use Starbucks? Anyway…
The technical
A while back the unpopular idea “ eVTOL manufacturer Lilium on the verge of 80% collapse? ” was published. This annoyed fanboys convinced the Jetsons future would be here any moment.
And collapse it did. The business was drowning in debt, technically weak, spending energy on a product no one wanted. Who on earth wants a flying battery with all the complications that includes when the proven technology of the helicopter and safety record continues to succeed? If it works, don’t fix it. Unfortunately Rivian and their investors din’t get that memo.
On the above 2 week chart, Rivian’s technical setup and fundamentals appear to be converging in a way that suggests significant downside risk. From a chart perspective, the descending triangle pattern, coupled with multiple bearish engulfing candles and a series of lower highs, highlights persistent selling pressure. These are classic hallmarks of a weakening structure. A decisive breakdown from the triangle could, based on prior measured moves, imply a potential ~60% decline from current levels. On the fundamental side, the headwinds are equally stark:
$5 billion in debt,
Negative P/E ratio (~–4.17),
$11 million in monthly interest obligations,
Continued margin pressure in a slowing EV market.
If consumer demand plateaus before Rivian reaches cost efficiency and scale, the company could face liquidity stress or even solvency risk. This risk is amplified by rising competition, particularly from BYD and other cost efficient Chinese EV producers. In short, Rivian’s position in the premium EV niche looks precarious, both technically and structurally.
Conclusions
Rivian, oh, here we go. The electric SUV company that was gonna save the planet. I got those emails periodically in the spam filter. I doubt bankruptcy will stop them from arriving.
Yeah, apparently the world’s going green, right? We’ll all be driving electric trucks up mountains while saving polar bears. Brilliant. Except now they’ve got five billion dollars of debt and owe eleven million a month just in interest. That’s not a company, that’s a bloke with too many credit cards pretending he’s fine.
So yeah, technically, fundamentally, whatever you want to call it, it’s a mess. The chart says ‘down,’ the balance sheet says ‘help,’ and the investors are probably saying, ‘Where’s the exit?’
The only bullish thing left is the optimism of the shareholders. And that’s fading faster than a Tesla interior ;-)
Ww
====================================================
Disclaimer
This analysis is provided for educational and informational purposes only, whilst being a lot more environmentally friendlier than a new Rivian SUV. It represents personal opinions based on publicly available data and technical chart interpretation, not financial advice.
Trading and investing in financial markets involves substantial risk, including the potential loss of capital. Always conduct your own due diligence and consult a qualified financial advisor before making investment decisions.

NZDUSD SHORTsMarket structure bearish on HTFs 3
Entry at Both Weekly And Daily AOi
Weekly Rejection at AOi
Previous Weekly Structure Point
Daily Rejection at AOi
Previous Daily Structure Point
Around Psychological Level 0.57500
Touching EMA H4
H4 Candlestick rejection
Rejection from Previous structure
TP: WHO KNOWS!
Entry 120%
REMEMBER : Trading is a Game Of Probability
: Manage Your Risk
: Be Patient
: Every Moment Is Unique
: Rinse, Wash, Repeat!
: Christ is King.

CADJPY LONG ΩMarket structure bullish on HTFs 3
Entry at both Weekly and Daily AOi
Weekly Rejection at AOi
Daily Rejection at AOi
Previous Daily Structure Point
Around Psychological Level 109.500
Touching EMA H4
H4 Candlestick rejection
Rejection from Previous structure
TP: WHO KNOWS!
Entry 105%
REMEMBER : Trading is a Game Of Probability
: Manage Your Risk
: Be Patient
: Every Moment Is Unique
: Rinse, Wash, Repeat!
: Christ is King.

BITCOIN (BTCUSD): Pullback From Key Support
Bitcoin is currently trading within a wide horizontal range on a daily.
We see a test of its support now.
There is a high chance that the price will bounce from that, following
a formation of a confirmed bullish imbalance candle.
Goal - 105170
❤️Please, support my work with like, thank you!❤️
I am part of Trade Nation's Influencer program and receive a monthly fee for using their TradingView charts in my analysis.

Bitcoin (BTC/USD) Market Analysis | November 2025The overall bias remains unchanged from the previous outlook. After BTC touched the 103,500 level on Oct 17, 2025, we saw a brief bullish push toward the 116,329 resistance zone.
However, price was rejected three times, and the daily candle never closed above this level — confirming it as a strong supply zone.
🔹 The rejection aligns perfectly with the 50% Fibonacci retracement, adding solid confluence to the bearish move that followed.
🔹 BTC has now returned to the key area of interest between 104,700 – 90,000, which stands as the final zone to defend for any long-term bullish continuation.
A clear break and daily close below 90,000 would likely invalidate the bullish structure and open the door for deeper downside movement.
#Bitcoin #BTCUSD #CryptoAnalysis #PriceAction #TechnicalAnalysis #Fibonacci #SupportAndResistance #TradingView #CryptoMarket #SwingTrading #MarketUpdate

Possible long on EURUSD Monday swept through Liquidity and gave us a good CHoCH today so we can can possibly see some buys coming in
Risk wisely

Long Potential: EURUSD 15M.Long/Buy potential on 15M EURUSD. Always do your own analysis before took someone's else.

EURUSD: Buyers not yet activeDaily range continues as seller initiative completes; potential buyer move toward 1.1820
Hey traders and investors!
This analysis is based on the Initiative Analysis (IA) method.
EURUSD is currently in a sideways range on the daily timeframe.
The seller initiative has reached its target, and now a buyer initiative is projected, with a target at 1.1820.
However, the weekly timeframe target sits much lower — at 1.16082.
So far, we don’t see active buying; candle volumes are declining.
It’s possible that meaningful buying will only start from the 1.14463 level.
Wishing you profitable trades!

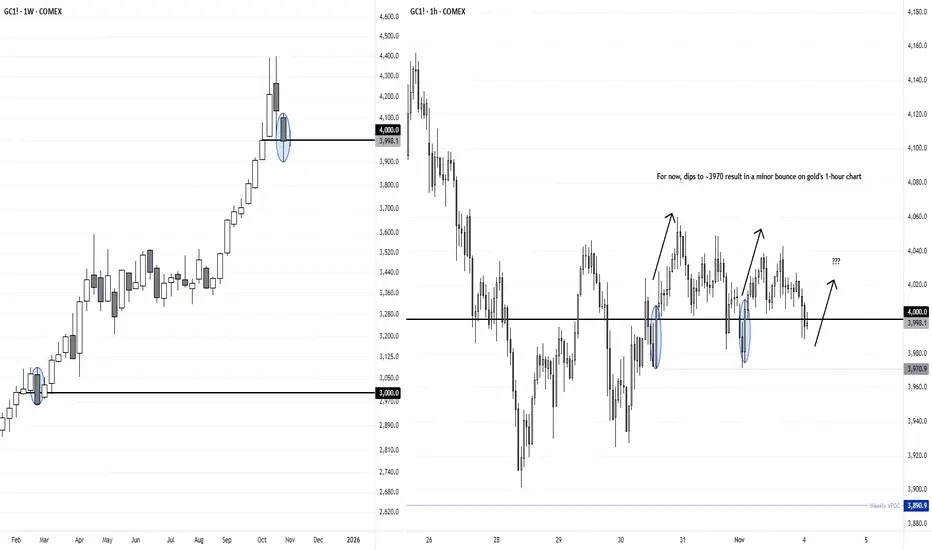
Gold Bulls Defend the $4000 Level as Bears Struggle for ControlGold closed lower for a second week, and prices are now meandering around the 4000 handle. We can see that the last time it tried to break back below such a milestone level, gold bear sonly managed a single weekly close below 3000 before the rally continued.
I doubt we’ll see another 1000 directly from current levels, and my bias is actually for the retracement to eventually dip lower before its bullish trend resumes. But for now, traders could seek false breaks below 4000 in anticipation of at least a minor move higher.
My video from Friday provides a bullish bias on the daily timeframe over the near term which still stands. But for those on intraday timeframes, notice that bullish engulfing candles have appeared on the 1-hour chart on the prior two occasions that gold tried (but failed) to break beneath 4000. It’s as if gold bears are trying to force the golden beach ball below its 4000 waterline.
Matt Simpson, Market Analyst at City Index
EURJPY ANALYSIS AND CONFLUENCE After seeing the daily candle close as a doji above 177.500 we could confirm that the market is still very bullish and we could be expecting a new leg to the upside seeing that the 4hr retested the moving average and formed a short term resistance that we are looking for a break above before going long.....
PS. From the previous video i do apologize for the misleading because the analysis said short when it should have been long

Potential Range Rebalance After Bullish Exhaustion on SP500Based on Candle Range Theory , the recent large bullish range has been followed by a series of smaller bearish candles, showing reduced momentum and potential exhaustion from buyers. Price is currently retracing into the lower range of the previous expansion, indicating that liquidity may be resting below.
If price fails to reclaim the upper range of the previous bullish candle, we could see continuation to the downside as the market seeks equilibrium within or below that expansion range. However, a strong rejection from the lower boundary could confirm range preservation and set up another bullish leg.
In short : the market’s next move depends on whether this retracement turns into a liquidity grab or a deeper correction beneath the prior candle range.

USDT Dominance is going to "fill the wick"CRYPTOCAP:USDT.D is likely going to fill the previous wick.
Then, if the downtrend is respected we'll likely retrace to new lows.
W1 timeframe is still bearish and D1 is transitioning to bullis/neutral.
IMO max pain before any signs of reovery. Bear trap, then the big expansion move.
2 / 3 weeks of pain in the markets, then UP ONLY.
If this is wrong, the cycle is over and we'll go into massive a bear market.

Long trade
📘 Trade Journal Entry
Pair / Symbol: MNQ1! (Micro E-Mini Nasdaq-100 Index Futures)
Direction: Buy-Side Trade
Date: Mon 3 Nov 25
Time: 1:00 am
Session: London Session AM
Timeframe: 1 Hour
🔹 Trade Details
Metric Value
Entry 26,057.50
Profit Level (TP) 26,390.50 (+1.28 %)
Stop Level (SL) 26,004.00 (–0.21 %)
Risk–Reward (RR) 4.36 R
🔸 Technical Context
Market Structure:
The index has been consolidating after a prior impulsive up-leg from mid-October.
A liquidity sweep below the 26,000 handle and BOS on lower time frames confirmed short-term accumulation.
15min TF Overview
Confluence Factors:
KAMA (Kaufman Adaptive MA) has flattened and begun to curl upward — early momentum shift.
Volume Expansion: Spike during the London open, suggesting institutional re-entry after the weekend gap. Intraday PD Array Alignment: Demand zone and VWAP cluster at 25,980–26,020 confluence zone. Session Overlay: Previous NY session lows have been taken out; London reclaim confirms buyside intent.
Key Zones:
Demand Base: 26,000 – 26,030
Target Zone: 26,380 – 26,400 (liquidity resting above prior London swing highs)
Extended Target: 26,790 (1.618 fib projection of current impulse)
🔹 Narrative & Bias
The setup reflects short-term accumulation within the broader bullish structure, consistent with rotation back into tech futures as the USD consolidates.
The 26,000 psychological level acted as a liquidity magnet — price swept stops, reclaimed structure, and produced a bullish displacement candle.
Macro Sentiment:
Renewed optimism in the Q4 earnings cycle; U.S. indices stabilising post-CPI data.
NASDAQ is outperforming due to sector rotation into large-cap growth (AAPL, ZS, NVDA correlation).
Projection:
Expect price to continue toward 26,390–26,400, with a partial profit zone near the prior swing high and potential continuation to the 26,780 1.618 extension if NY session momentum follows through.

USDJPY breaking out of long pennantThis could be quite a significant breakout for USDJPY. The monthly pennant with the peak that formed in June 2024 is finally breaking out to the upside. If this holds, the pair is likely to retest that all time high at 162.00 and possibly break higher.

ASTER : Soaring to the Stars or Heavy Plunge?This currency is currently sitting on a demand level (red zone). If it breaks the trend line (green line), it will head toward a supply zone (blue) in a lower timeframe. If it can't break through that zone, we expect continued decline; but if it does, we expect the uptrend to continue. If it doesn't break the trend line and drops below the demand zone, we expect a drop down to the green zone.

After a long pause, I'm backIt's been a minute since I've posted or traded. As it happens trading drew me back. Let's see the first position I've taken.
We've got ourselves a downtrend on euro-dollar since sep, and around the 1.15 area is my trade. Is it risky? Yes. But, I'll only give it 2-3 options to be able to break further down or need an extra super strong signal of bullish momentum to change my view.
Initial stop will be very close: 1.1545
First tp is @1.1454
RR is 1:2.

USDJPY | Liquidity Sweep & Demand Reaction SetupUSDJPY is maintaining an overall bullish structure, but after a strong impulsive move, the market is now in a correction phase, forming equal lows and session liquidity beneath the current range.
This creates a potential opportunity for buyers once liquidity is collected and price reacts from a valid demand zone.
🔹 Market Context:
The higher timeframe remains bullish, showing strong displacement and multiple Breaks of Structure (BOS) to the upside.
Currently, price is consolidating in a range, building liquidity below session lows.
Under this liquidity area, there’s a clean Fair Value Gap (FVG) and Order Block (OB), both acting as potential demand zones for a continuation move.
🔹 Trade Idea & Plan:
1️⃣ Wait for Liquidity Sweep:
Allow price to take out the equal lows and session liquidity below the current range.
This will confirm that liquidity has been collected.
2️⃣ Look for Tap into FVG or OB:
Once liquidity is taken, expect price to tap into the FVG or OB zone highlighted on the chart.
These are the areas where smart money participants are likely to re-enter long positions.
3️⃣ Wait for LTF Confirmation:
After the tap, shift to lower timeframes to identify a BOS or CHOCH signaling bullish intent.
This will confirm that buyers are stepping in.
4️⃣ Execution & Target:
Enter only after confirmation — no confirmation means no trade.
Target the next internal high or swing high, aligning with the overall bullish direction.
🔹 Key Notes:
The setup is purely structure and liquidity-based — not driven by sentiment.
We wait for the market to sweep liquidity, tap demand, and confirm direction before entering.
Patience and confirmation are the main filters that protect capital and improve accuracy.
If the market fails to confirm, we simply stay out and wait for the next opportunity.
🔹 Summary:
👉 Liquidity lies below current range lows.
👉 FVG + OB below = strong confluence demand zone.
👉 Wait for LTF CHOCH/BOS for entry confirmation.
👉 Target next high once structure confirms continuation.
No confirmation = No trade 🚫
React to the market, don’t predict it 🧠
⚠️ Disclaimer:
This idea is for e ducational purposes only and not financial advice . Always perform your own analysis and use proper risk management before trading.

Bitcoin/USDT FuturesBitcoin/USDT Futures will first go up and then down, and news will only accelerate this.
So first Touch point of 3 in above 2 .
In the short term, the trend will be upward and in the long term, downward.

Is the CHFJPY Gap Fill to 185 About to Play Out?This pair has been on an absolute tear this year, clocking in nearly 14 straight bullish weeks — one of the strongest runs we’ve seen in a long time. Most of that surge came right after the Japanese election results last month, and now, things are looking seriously overextended.
Looking at the Monthly and Weekly charts, the structure remains bullish, but momentum is clearly stretched. The pair is deep in overbought territory, setting up a nice potential bearish correction — possibly down to fill the open gap around 185.00.
Daily Chart Breakdown:
Zooming into the daily chart, we can see a clear sideways range forming over the last six days. Thursday’s fake bullish breakout likely trapped a lot of retail traders, triggering stop losses right after the BOJ rate decision.
What caught my attention is that while price popped higher on Thursday, the MACD moving averages crossed down — a clear sign that underlying momentum is shifting bearish.
Game Plan:
If we get a daily close below 191.00 support, I’ll be watching closely for a quick retracement back above that level — that’s where I’ll be looking to get in on the short setup, either tomorrow or in the coming days.
Targets:
First Target: 189.00 (previous support)
Second Target: 185.00 (gap fill level from early last month)
If this plays out, we’re looking at a 300–500 pip opportunity on this move.
This pair has been flying for months, but even strong trends need to breathe — and this one’s showing all the signs of exhaustion.
Let me know what you think below 👇

XAU/USD 03 November 2025 Intraday AnalysisH4 Analysis:
-> Swing: Bullish.
-> Internal: Bullish.
Analysis and bias remains the same as analysis dated 20 October 2025.
Price has printed as per previous intraday expectation by printing a bearish CHoCH which indicates, but not confirms, bullish pullback phase initiation.
Price is currently trading within an established internal range, however, I will continue to monitor price with regards to depth of pullback.
Intraday expectation:
Price to continue bearish, react at either discount of 50% internal EQ, or H4 supply zone before targeting weak internal high priced at 4,380. 990.
Note:
The Federal Reserve’s sustained dovish stance, coupled with ongoing geopolitical uncertainties, is likely to prolong heightened volatility in the gold market. Given this elevated risk environment, traders should exercise caution and recalibrate risk management strategies to navigate potential price fluctuations effectively.
Additionally, gold pricing remains sensitive to broader macroeconomic developments, including policy decisions under President Trump. Shifts in geopolitical strategy and economic directives could further amplify uncertainty, contributing to market repricing dynamics.
H4 Chart:
M15 Analysis:
-> Swing: Bullish.
-> Internal: Bearish.
Analysis and bias to remain the same as yesterday's bias date 29 October 2025.
As expected, price has printed a bullish CHoCH to indicate bullish pullback phase initiation.
Price is now trading within an established internal range.
Intraday expectation:
Price to continue bullish, react at either premium of internal 50% EQ or M15 demand zone before targeting weak internal low, priced at 3,886.465.
Note:
Gold remains highly volatile amid the Federal Reserve's continued dovish stance, persistent and escalating geopolitical uncertainties. Traders should implement robust risk management strategies and remain vigilant, as price swings may become more pronounced in this elevated volatility environment.
Additionally, President Trump’s tariff announcements, particularly against China, are expected to further amplify market turbulence, potentially triggering sharp price fluctuations and whipsaws.
M15 Chart:

EURJPY WEEKLY CONFLUENCEAfter seeing the previous week spike down into 178.750 key level and a sharp rejection from there , the daily also showing signs of bearish power we could see this pair push down for a few more pips especially with the 4hr structure making LL and LH and the price trading below the moving average

AUDCHF: Another Bullish Confirmation 🇦🇺🇨🇭
AUDCHF went up as I predicted on Friday.
Analyzing the pair after the market opening, I see
another strong bullish signal today.
The price successfully broke a resistance of a horizontal
parallel channel that was formed after a retest of a daily structure.
A new higher high higher close suggests a highly probable bullish continuation.
Next goal - 0.5286
❤️Please, support my work with like, thank you!❤️
I am part of Trade Nation's Influencer program and receive a monthly fee for using their TradingView charts in my analysis.
