GBPNZD: Pullback From Support 🇬🇧🇳🇿
There is a high chance to see a pullback from a key daily support on GBPNZD.
The price formed a fair value gap after FED rate decision yesterday.
The gap has been filled this night and the pair will likely go up now.
Goal - 2.2906
❤️Please, support my work with like, thank you!❤️
I am part of Trade Nation's Influencer program and receive a monthly fee for using their TradingView charts in my analysis.
Multiple Time Frame Analysis

Gold Could Finally Be Set for a BounceGold is on track for its second week lower, its first such bearish sequence since June. But clues on price action and options positioning suggests upside risks for gold could prevail.
Matt Simpson, Market Analyst at City Index.

Trade idea on xauusd So here is my speculation on xau
Sell signal on retest of the 3947.40-3950.00
Invalidation of idea:a violation of the 3962.50 -3965.64
Else: a break of the 3950.00 resistance indicates a bullish takeover then we position to buy at around the retest of 3937.50 or continuation buy at 3950.00 based on momentum
Let’s watch out for reactions around these key zones and act based on confirmation and how price reacts around them
Apply proper risk management, this is just my 2 cents

Bitcoin Setting Up a Bullish Megaphone Toward $160KBTCUSDT has completed its previous falling wedge pattern, fully reaching its projected target.
Price is now consolidating within a developing bullish megaphone structure, suggesting continued expansion and volatility.
If structure holds, the next projected upside target points toward the $160K zone over the medium term.
Meanwhile, there’s a CME gap around the $110K level, which could attract a sharp move toward that zone aligning with our buy-back region. If price revisits this area, it could present a strong buying opportunity before the next major upside leg.
Share your thoughts in the comments don’t forget to like and share if you find this analysis helpful.
Drop your altcoins below, and I’ll review and analyze them for you!

EURUSD | Bias Shift & QML Zone in FocusThe previous setup has been invalidated as the market showed a clear Change of Character (ChoCh), flipping the structure and order flow to bullish.
With that shift, my bias has now turned bullish, and I’ve marked the QML (Quasimodo Level) zone as my area of interest.
I’ll be waiting for price to tap into this zone and show confirmation before considering any execution.
Adaptability is part of discipline — the market evolves, and so should the bias.
⚠️ Disclaimer: This analysis is for educational purposes only. Always manage your risk and trade responsibly.

Short EURLots of smooth support ready to become liquidity and swept on the higher timeframe. Short longterm, watching and trading any Asia buy side sweeps during London.
Cheers

GBPUSD SHORT Market structure bearish on HTFs 3
Entry at Both Weekly and Daily AOi
Weekly Rejection at AOi
Previous Weekly Structure Point
Daily Rejection at AOi
Around Psychological Level 1.33500
Touching EMA H4
H4 Candlestick rejection
TP: WHO KNOWS!
Entry 100%
REMEMBER : Trading is a Game Of Probability
: Manage Your Risk
: Be Patient
: Every Moment Is Unique
: Rinse, Wash, Repeat!
: Christ is King..

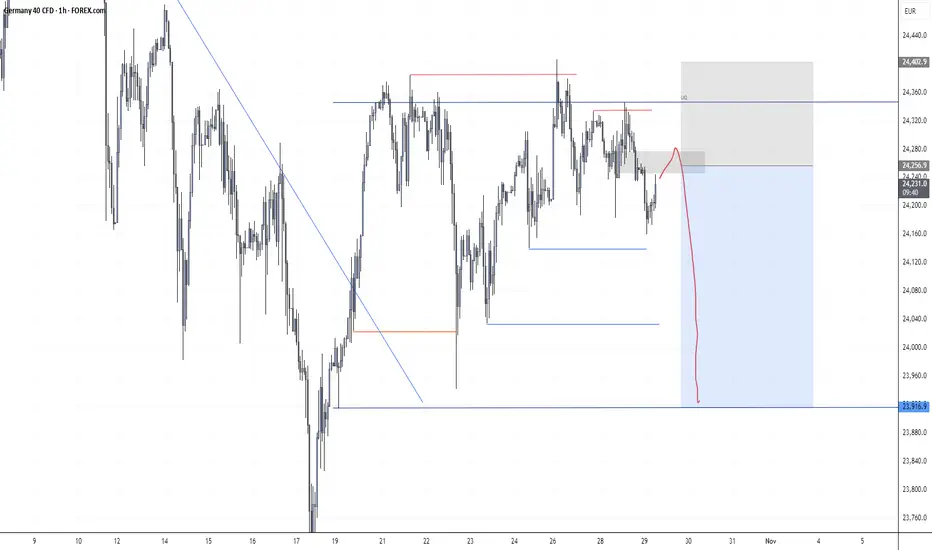
GER40(DAX)-1H SHORT Setup/RiskyChartLiquidity Grab: The recent sweep above internal liquidity failed to continue higher, indicating buy-side exhaustion.
Bearish Rejection Zone: The marked gray area aligns with a previous imbalance and premium zone, ideal for short entries.
Target Zones:
1. First Target: 24,000 – intraday demand zone.
1. Final Target: 23,920 – previous weekly low / external liquidity pool.
Invalidation: A clean 1H candle close above 24,360 (LQ) would invalidate this bearish setup.
Strong Recovery, Key Level Ahead $TRUMPAfter the recent crash, $TRUMP/USDT has made a strong comeback, recovering sharply from the bottom with solid momentum.
On the daily timeframe, the price has successfully broken above the key resistance trendline, showing clear bullish intent. However, it’s now testing a major resistance on the weekly chart.
If the price manages to break and close above this weekly resistance trendline, it could trigger an explosive upside move for TRUMP.
DYOR, NFA
Thanks for reading! Appreciate your support and engagement 🙏

GOLD (XAUUSD): Short Trade Before the FED
I see an intraday pullback trade on Gold ahead of
FOMC & FED Interest Rate Decision today.
The price will likely retrace from the underlined resistance,
following a confirmed bearish imbalance and a formation
of a double top pattern.
Expect a bearish movement at least to 3988 level.
❤️Please, support my work with like, thank you!❤️
I am part of Trade Nation's Influencer program and receive a monthly fee for using their TradingView charts in my analysis.

#GBPUSD short in profit.Currently still in #GBPUSD shorts but took most of the profits off the table; now I'm just managing my SL.
The less I trade, the better it goes. I don't have much time for scalping or day trading, so swinging is perfect for now but i hope this changes soon! #FOREX

USDCAD: High Chance for a Pullback 🇺🇸🇨🇦
There is a high chance that USDCAD will move up
after a confirmed bearish trap.
A formation of a bullish imbalance candle provides
a strong confirmation.
Expect a pullback to 1.396 level.
❤️Please, support my work with like, thank you!❤️
I am part of Trade Nation's Influencer program and receive a monthly fee for using their TradingView charts in my analysis.

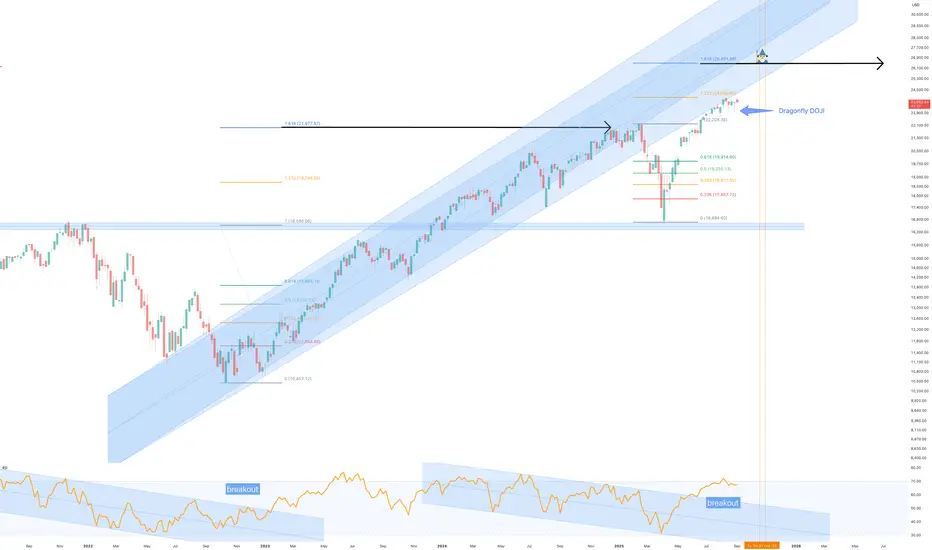
NASDAQ to 26,000 before year end - September, 2025No doubt this idea will be controversial as a majority of ideas published on the platform call for a bearish outlook.
Earlier this year paper hands were flushed out of the market on tariff scares. They couldn’t exit the market fast enough, some didn’t actually know why they were selling as emotions were in full control.
Today those same traders and investors sit in cash as they wait for an opportunity to buy in. Others betting heavily against the trend for Armageddon. All the while the market grinds upwards and onwards.
Two very simple questions everyone must ask when entering or betting against the market:
1. What is the trend?
2. Support and resistance, which is it?
You cannot maintain a bearish bias should you answer both of those questions positively. That’s emotion. Do you find yourself scanning lower timeframes to look for bias confirmation? You'd be in majority then. Notice how many published ideas you see operating in the 15 and 30 minute charts with 2 to 3 month forecasts? Always makes me smile, but it will not change the facts of the chart.
The Trend
Higher lows are evident on the daily chart below, marked out in black. The trend is your friend until the end.
Support & resistance
Look left. On the daily chart we can see multiple support tests with confirmation on past resistance. If the levels do not at first appear, zoom out using a higher timeframe. A majority will zoom in instead to confirm bias, that’s a red flag.
The Put / Call ratio
Retail traders are aggressive in their attempts to “short” this market. Nowhere is that more evident than the Put/Call ratio. Anytime you see dumb money move the put call ratio to 90 and above, the market rips. Just recently short sellers moved the ratio beyond this level. The chart below provides a comparison with the NDX to show what happens next. The rally that follows will typically last up to 2 months on average after this signal.
Why 26000?
The market entered price discovery after the previous all time high breakout of 22k. The forecast area was previously published, see linked ideas. The same conditions that allowed those forecasts now repeat. In addition the Fibonacci extensions; the NDX repeatably rallies to the 1.618 extension after each and every emotional flush out. It’s a gift horse of an opportunity.
Previous years:
Conclusion
Markets climb walls of worry, and this moment is no different. The loudest voices today call for collapse, but the charts, price action, and sentiment data are telling another story entirely. Higher lows, confirmed support, extreme put/call ratios, and Fibonacci extensions all align with one clear outcome: continuation.
A move to 26,000 on the NASDAQ before year-end is not a wild stretch of imagination, but the logical conclusion of repeating market behaviour. Every emotional flush out has historically created the runway for price discovery to the 1.618 extension, and this time is no different.
If you’re betting against the trend, you’re not fighting the market, you’re fighting math, structure, and history. The bears may dominate headlines but that just News. The market is not listening to fear. It’s grinding higher, and the destination is 26,000.
Ww
XAU/USD 29 October 2025 Intraday AnalysisH4 Analysis:
-> Swing: Bullish.
-> Internal: Bullish.
Analysis and bias remains the same as analysis dated 20 October 2025.
Price has printed as per previous intraday expectation by printing a bearish CHoCH which indicates, but not confirms, bullish pullback phase initiation.
Price is currently trading within an established internal range, however, I will continue to monitor price with regards to depth of pullback.
Intraday expectation:
Price to continue bearish, react at either discount of 50% internal EQ, or H4 supply zone before targeting weak internal high priced at 4,380. 990.
Note:
The Federal Reserve’s sustained dovish stance, coupled with ongoing geopolitical uncertainties, is likely to prolong heightened volatility in the gold market. Given this elevated risk environment, traders should exercise caution and recalibrate risk management strategies to navigate potential price fluctuations effectively.
Additionally, gold pricing remains sensitive to broader macroeconomic developments, including policy decisions under President Trump. Shifts in geopolitical strategy and economic directives could further amplify uncertainty, contributing to market repricing dynamics.
H4 Chart:
M15 Analysis:
-> Swing: Bullish.
-> Internal: Bearish.
As expected, price has printed a bullish CHoCH to indicate bullish pullback phase initiation.
Price is now trading within an established internal range.
Intraday expectation:
Price to continue bullish, react at either premium of internal 50% EQ or M15 demand zone before targeting weak internal low, priced at 3,886.456.
Note:
Gold remains highly volatile amid the Federal Reserve's continued dovish stance, persistent and escalating geopolitical uncertainties. Traders should implement robust risk management strategies and remain vigilant, as price swings may become more pronounced in this elevated volatility environment.
Additionally, President Trump’s tariff announcements, particularly against China, are expected to further amplify market turbulence, potentially triggering sharp price fluctuations and whipsaws.
M15 Chart:

XAUUSD(Gold/USD)-15m Smart Money Concept Analysis / RiskyChartTechnical Breakdown:
Market Context:
The market broke structure (BOS) to the downside early in the session, showing a bearish bias.
However, a Change of Character (CHoCH) formed later, indicating a possible short-term bullish retracement or reversal zone.
Multiple CHoCH levels marked to confirm internal structure shifts.
Liquidity sweep (SMT) observed near the session low — suggesting potential accumulation before a rally.
PDH (Previous Day High) and PDL (Previous Day Low) zones highlighted to identify external liquidity targets.
Fair Value Gaps (FVGs) filled during retracements, supporting balanced price delivery.
Notable volume spikes on reversal candles signal institutional activity.

Why I'm Suspicious Of This Bitcoin BounceThe rebound in bitcoin I warned about last week has come to fruition. Yet despite its recovery above the 200-day EMA, I remain bearish on the higher timeframes. Looking at bitcoin futures, I explain why I think bears are lurking above and may be happy to fade into rallies towards 120k.
Matt Simpson, Market Analyst at City Index and Forex.com


Trade idea on xauusdSell at current market price near 3975.00
Use the parameters on the chart for the SL and Tp
Apply proper risk management

ADAUSDT — Dual Wave ConfluenceTwo independent cycles now point to the same liquidity zone.
The wine wave (macro) has entered its BC retracement phase, and its BC target aligns perfectly with the green micro-wave’s C-target , forming a rare dual confluence at the same level. This overlap creates a liquidity magnet — a structural point where both wave systems expect equilibrium before a bullish expansion.
Price is currently reacting inside the BC demand zone , finalizing the correction before expansion toward the macro C projection at 0.7575 .
The alignment between both scales confirms that momentum and liquidity are synchronized for continuation.
Strengths :
Perfect alignment of macro BC and micro C targets
Discount entry within structural demand
Defined invalidation below BC low
High asymmetric RR toward 0.7575
Weaknesses :
Requires bullish displacement confirmation from demand zone
Possible short-term inducement before expansion
Invalidation if structure breaks below BC
Bias : Bullish continuation
Target : 0.7575 (macro C projection zone)

LONG ON GOLD XAU/USDGOLD Has swept sell side liquidity at a major support zone.
It also has bullish divergence on the lower timeframes.
Additionally there is conflict between Iran and Israel which leads investors to safe havens like gold and silver.
I am looking to catch over 300 points on GOLD which is over 3000 pips.

GBPCAD SHORT Market structure bearish on HTFs 3
Entry at Daily AOi
Weekly Rejection at my AOi
Previous Weekly Structure Point
Daily Rejection at AOi
Previous Daily Structure Point
Daily EMA retest
Around Psychological Level 1.87000
Touching EMA H4
H4 Candlestick rejection
TP: WHO KNOWS!
Entry 105%
REMEMBER : Trading is a Game Of Probability
: Manage Your Risk
: Be Patient
: Every Moment Is Unique
: Rinse, Wash, Repeat!
: Christ is King.

EURUSDThis a retracement into the 4hr FVG which Aligns with 30mins Breaker block. Then price might continue bearish.

Trade idea on XauusdUpdate on how our IF ELSE condition played out with the zones we called out earlier.
Our initial POI was around
4000.00
4004.46
But in a fast moving market,price continues from the nearest available zone which was the reason for our ELSE condition at 3975.00 zone
That was the rationale behind the short idea, we just continued the trend from that zone and we got nice pips.
This can be repeated over and over again with ease.
The name of my Model, i call it the GJS
Believers geng
