Nokia ($NOK): The Most Underestimated Comeback Story in Tech Inf6G Leadership & Strategic Relevance
Nokia is already positioning itself as a major player in 6G development, with research partnerships across the EU, U.S., and Japan.
2 Strong Core Business
Despite macro headwinds, Nokia’s Network Infrastructure and Cloud & Network Services divisions continue to grow. The company is maintaining profitability even through currency and tariff pressure.
3 Valuation Gap
The market values Nokia at a fraction of its peers like Ericsson or Cisco, even though its tech portfolio is equally deep. Trading near $5.5, the stock looks undervalued based on long-term earnings potential.
4 Financial Stability
Nokia holds solid cash reserves, low leverage, and generates consistent free cash flow.
5 Catalysts
Major new contracts in 2025-2026
Possible tailwinds from stronger EUR/USD
Investor re-rating once margins improve
Multiple Time Frame Analysis

Double Fakeout on GoldHi traders and investors!
This analysis is based on the Initiative Analysis (IA) concept.
Gold has corrected by 6.5% from its peak and so far shows no signs of recovery.
On the 1-hour timeframe, the market is in a sideways range.
First, there was a false breakout below the lower boundary, and then a false breakout above the upper boundary of the range.
Now the seller has broken through the lower boundary of the sideways range, and the price has dropped below the 50% level of the daily buyer initiative.
At the base of the last buyer initiative on the daily timeframe, there is a buyer zone between 4058 and 3944 — a good area to look for potential trade setups.
Wishing you profitable trades!

Silver at critical resistance, is a great collapse next?Silver has a long history of dramatic price spikes, each coinciding with significant global macro events:
June 1980, the Hunt Brother’s squeeze sent silver parabolic before collapsing
March 2011, post Global Financial Crisis (GFC) stimulus + QE mania led to another blow off top
Present day, amidst chaotic politics and incomprehensible levels of debt price action is once again testing the same resistance zone around $50
This area has proven to be a multi-decade resistance. Each prior approach ended in a swift and brutal correction.
Technical analysis
Monthly chart: Price action has surged aggressively. 300% since the lows of 2020 to the $45-50 resistance band, mirroring the same vertical rallies of 1980 and 2011.
RSI: A long term descending RSI resistance line connects the 1980 and 2011 tops. Current RSI is once again colliding with this barrier, hinting at exhaustion.
Momentum: While silver is undeniably strong, history suggests the upside risk may be limited at these levels compared to the downside potential.
Risk reward breakdown
Upside potential: A clean breakout above $50 could open the door to a true price discovery phase possibly $60+ if silver enters a secular commodities super cycle.
Downside risk: Failure here would mimic the historic collapses:
1980: -90% drawdown
2011: -70% drawdown
A pullback to $25-30 would not be unusual, especially if macro liquidly tightens.
Trading strategy ideas:
Aggressive traders: Consider short setups or profit taking near the $50 resistance, with stops above $52-53 to manage risk.
Conservative traders: Wait for confirmation, either a monthly breakout or close above $50 (bullish) or a strong rejection signal.
Conclusion
Silver has once again like Gold reached historic levels. The risk/reward profile favours caution here on. History shows that vertical rallies into this level tend to end poorly for late longs. Unless silver breaks and holds above $50, the probability of a deep correction remains high.
Is it possible price action continues higher? Sure.
Is it probable? No.
Ww

EURAUDGot rejected at daily resistance.
H4/H1 has given a head and shoulder with neckline broken, retest has been made with H4 rejecting with a bearish engulfing candle. Targeting daily support since we're in a daily range.

XAU/USD Update 1Next move on the way, focus on proper risk management & stay discipline. Wishing you successful trades..!
Key Reason:
1. Price deeply grab all SSL.
2. Overall market structure was bullish.
3. Trendline respect.
4. 1H Fresh zone for buying.
5. Once price tap in our zone then switch into smaller time frame and look for bullish confirmation. Bullish move expected.
This is not a financial advise. Let's see how it will work.

USOIL – Downtrend Still IntactUSOIL remains fundamentally weak with technical confirmation of a prevailing downtrend. Short-term pullbacks are likely corrective and may provide better short-entry setups.
Resistance levels:
59.14
60.36
61.91 (Ultimate)
Support levels:
54.81
53.13
51.95 (Ultimate)

EUR/USD Forecast: How I Plan to Trade the Euro Next WeekOn the daily chart, we can see the formation of a new trading range as a result of interaction with the weekly key level. We can mark D FVG as a zone of interest from which I would like to work on continuing the trend in long. Entry into the position will be executed upon confirmation of the volume on the 4-hour chart.
If you found this useful, please write about it in the comments. Feedback is very motivating to publish more useful material.

XAU/USD 21 October 2025 Intraday AnalysisH4 Analysis:
-> Swing: Bullish.
-> Internal: Bullish.
Analysis and bias remains the same as yesterday's analysis dated 20 October 2025.
Price has printed as per previous intraday expectation by printing a bearish CHoCH which indicates, but not confirms, bullish pullback phase initiation.
Price is currently trading within an established internal range, however, I will continue to monitor price with regards to depth of pullback.
Intraday expectation:
Price to continue bearish, react at either discount of 50% internal EQ, or H4 supply zone before targeting weak internal high priced at 4,380. 990.
Note:
The Federal Reserve’s sustained dovish stance, coupled with ongoing geopolitical uncertainties, is likely to prolong heightened volatility in the gold market. Given this elevated risk environment, traders should exercise caution and recalibrate risk management strategies to navigate potential price fluctuations effectively.
Additionally, gold pricing remains sensitive to broader macroeconomic developments, including policy decisions under President Trump. Shifts in geopolitical strategy and economic directives could further amplify uncertainty, contributing to market repricing dynamics.
H4 Chart:
M15 Analysis:
-> Swing: Bullish.
-> Internal: Bearish.
Analysis and bias remains the same as yesterday's analysis dated 20 October 2025.
I have been mentioning in my alternative scenario for almost 1-month that all higher timeframes are requiring a pullback, and we are seeing a narrowing of internal structure, price could target strong internal low. This is how price printed.
Price has printed a bearish iBOS after a very long duration and subsequently a bullish CHoCH to indicate, but not confirm bullish pullback phase initiation.
The bearish iBOS has also confirmed the swing-high.
Intraday expectation:
Price to continue bullish, react at either premium of 50%, or M15 demand zone, before targeting weak internal low priced at 4,185.910.
Note:
Gold remains highly volatile amid the Federal Reserve's continued dovish stance, persistent and escalating geopolitical uncertainties. Traders should implement robust risk management strategies and remain vigilant, as price swings may become more pronounced in this elevated volatility environment.
Additionally, President Trump’s tariff announcements, particularly against China, are expected to further amplify market turbulence, potentially triggering sharp price fluctuations and whipsaws.
M15 Chart:

Shakeout - PurchasesThe professional has already shakeout and also it already confirmed us each phase. So, what we could expect? higher prices once it breaks 4287

AUDNZD: Triple Confluence Sell –Monthly, Weekly & MACD All AlignPrice has been locked in a long-term range between 1.14 and 1.02 since 2013, with several spikes above and below this zone—but every time, price has ultimately closed back inside the range.
On the Monthly chart, we can see that price broke through the 1.11 resistance in September, which opened the door for a 300-pip rally up toward the major range top at 1.14.
Since reaching this key level, the Weekly candles have shown clear signs of exhaustion — three consecutive topping-tail candles, followed by a spinning-top last week, suggesting momentum is stalling.
Zooming into the 2-Day chart, as explained in the video, we now have a MACD bearish crossover forming right at resistance — a strong confluence with the monthly level and the weekly rejection candles.
This combination makes for a high-probability sell setup.
My Trading Plan
Looking for one final pop toward 1.14 (or slightly below) to initiate shorts.
First target: 1.115 — the previous resistance turned support, which also aligns with the 50% FIB retracement of the current leg up.
If 1.115 breaks: next levels to watch are 1.105, then 1.06, which marks the bottom of the long-term range.
📉 Summary:
All major timeframes are aligning — monthly resistance, weekly exhaustion, and a 2-day MACD crossover.
If we see a rejection near 1.14, this could develop into a powerful swing short back into the middle and potentially the bottom of the multi-year range.
Stop loss will be well above 1.15 and will be based on what price I get in.
Let me know what you think below

EURJPY ANALYSISAfter seeing the previous daily candle close as a doji rejecting the moving average and key support areas.. we could expect further sells into the gap area below

USDJPY: Holds Above HTLOn the daily timeframe, price broke through a previous HTL, which is now acting as support. There's also uptrend confluence signaled by price remaining above the EMAs and EMA20 being above EMA60.
Over on the H1 timeframe, price is also beginning to deviating away from the EMAs, which signals to me that there's momentum picking up.
In addition, price is also breaking above the DTL right now, which indicates that the counter-trend move is likely over.

Long trade
📘 Trade Journal Entry
Pair: AAPL (Apple Inc)
Direction: Buyside Trade
Date: Fri 10th Oct 2025
Time: 11:30 AM
Session: London Session AM
Timeframe: 15 minutes
🔹 Trade Details
Entry: $258.49
Profit Level: $269.22 (+4.27%)
Stop Level: $243.69 (–1.96%)
Risk-Reward Ratio (RR): 2.16
🔹 Technical Context
The demand zone on the 15-minute timeframe (near $252–$255) held strongly following an earlier breaker block and order block reaction.
Price retraced to the 0.618–0.786 Fibonacci zone before resuming upward momentum.
Kaufman Adaptive Moving Average (KAMA) is trending upward, confirming directional bias alignment.
RSI recovered from mid-range, showing bullish divergence and improved momentum.
The 1.618 Fib extension aligns closely with the target zone (~$261–$262), confluencing with prior structural resistance.
🔹 Narrative
After a period of range compression within the 255–258 zone, Apple broke from its re-accumulation structure following a liquidity sweep below the 15-minute demand zone.
Institutional accumulation was evident, as reflected by high-volume candle expansion and a clear reclaim of structure at 257.
🔹 Market Sentiment Context
Broader NASDAQ composite strength aligns with post-earnings optimism and risk-on appetite.
USD weakness and moderating Treasury yields have improved tech-sector conditions.
The upcoming Q4 earnings cycle and expectations of a potential Fed rate cut sustain short-term bullish sentiment across mega-cap equities.

Long trade
15min TF overview
📘 Trade Journal Entry
Pair: MAVUSDT.P (Maverick Protocol Perpetual Mix Contract)
Direction: Buyside Trade
Date: Sat 18th Oct 2025
Time: 10:30 AM
Session: London to New York Session AM
Timeframe: 15 minutes
🔹 Trade Details
Entry: 0.04112
Profit Level: 0.04643 (+12.59%)
Stop Level: 0.03947 (–2.31%)
Risk-Reward Ratio (RR): 4.89
🔹 Technical Context
The trade follows a liquidity sweep below prior range lows (0.039–0.038), followed by a sharp reclaim and consolidation within a tight bullish structure.
Price respected the discount zone (0.618–0.786 Fib retracement) drawn from the prior swing move.
Kaufman Adaptive Moving Average (KAMA) slope turned positive — confirming momentum alignment with buy-side continuation.
Volume confirmation supports re-accumulation at lower bounds after heavy capitulation wick (0.045–0.050 zone).
Overhead inefficiency near 0.046–0.047 marks a fair value gap target area for partials or full exit.
🔹 Narrative
MAVUSDT shows strong signs of accumulation after a capitulation event and recovery through the discount zone. The shift in structure suggests an early phase B–C transition (Wyckoff accumulation) with potential for a spring retracement confirmation.
The entry capitalises on the low-end liquidity grab, targeting the mid-range inefficiency gap above 0.046. With RSI climbing steadily and adaptive MA confirming trend alignment, this setup carries a clean continuation bias into early week sessions.
🔹 Sentiment & Context
Altcoin sector rotation remains buoyant, with smaller-cap DeFi assets showing relative strength as BTC stabilises. MAV’s DEX narrative and liquidity pool integrations underpin fundamental demand as DeFi capital rotations re-ignite. Expect near-term continuation if BTC maintains above 107K–109K (macro pivot zone).

#XAUUSD Trend Deciding LevelsWill the #bulls take charge to take #xauusd #gold to #4500
Or the Bears will take control from last selling Levels.
Buy and Sell targets in Chart.
Follow #riskmanagement Do your own analysis before initiating any trades !

USDCHF: Momentum into NY SessionKey Observations
This pair is starting off slow, but I'm expecting momentum to pick up during the New York session.
The daily chart is indicating an overall downtrend. Price is holding below both EMAs. However, the price action is a little bit weaker and the daily HTL isn't a significant level.
On the H1 timeframe, price is showing overlapping bars. I am hoping to see a stronger break to the downside as price crosses out of the EMA brand and accelerates.

GBPCAD: Price Supported Above Daily HTLKey Observations
Price is holding above the daily HTL, which is a good sign that this breakout is likely structural and there isn't much selling pressure (resistance)
On the H1 timeframe, price is also showing a similar characteristic. Price tried to trade below the EMA but could not.
Since price is accelerating to the upside once again, it's likely we'll be seeing trend continuation throughout the rest of the week.

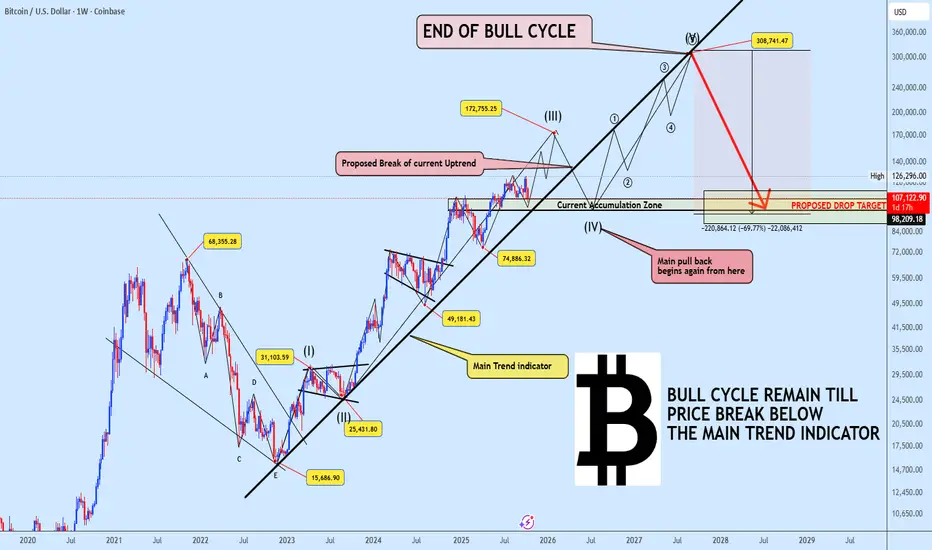
BITCOIN The Super Cycle Still Unfolding Wave 3 in Motion!Bitcoin continues to respect the Main Trend Indicator, keeping the broader super cycle wave (3) intact. Based on our projection, the ongoing bullish leg is expected to complete near $172,000, marking the end of wave (III).
From there, we anticipate a corrective wave (IV) to unfold likely breaking below the uptrend support toward the $107K region. This move will act as the last deep pullback before Bitcoin begins its final explosive rally (wave V) that could extend toward $300K, concluding the entire bull cycle before a true bear market emerges.
Historical Parallel:
To understand this better, it’s important to recall the 2020–2021 bull cycle. Back then, BTC repeatedly tested a similar dynamic trendline, maintaining its strength as long as the structure held. Even after the eventual breakdown that confirmed the bull cycle’s exhaustion, price still pushed to a new all-time high before the real decline began.
This serves as a crucial reminder market tops rarely happen instantly. They evolve with clear structural warnings, and we may be approaching such a phase again.
Key Takeaway:
As long as Bitcoin trades above the Main Trend Indicator, the bull cycle remains valid.
A confirmed breakdown below it, however, will signal the start of the macro correction phase one that may eventually reset the entire structure.
Stay prepared, stay disciplined, and understand that each phase of the cycle brings new opportunities. If you find this analysis insightful, don’t forget to like, share, and drop your thoughts below, your engagement helps keep quality analysis alive!
Meanwhile, I’ve noticed a surge in volume across Binance Alpha projects. Drop your coin name below for a quick market analysis.
XAU/USD 20 October 2025 Intraday AnalysisH4 Analysis:
-> Swing: Bullish.
-> Internal: Bullish.
Price has printed as per previous intraday expectation by printing a bearish CHoCH which indicates, but not confirms, bullish pullback phase initiation.
Price is currently trading within an established internal range, however, I will continue to monitor price with regards to depth of pullback.
Intraday expectation:
Price to continue bearish, react at either discount of 50% internal EQ, or H4 supply zone before targeting weak internal high priced at 4,380. 990.
Note:
The Federal Reserve’s sustained dovish stance, coupled with ongoing geopolitical uncertainties, is likely to prolong heightened volatility in the gold market. Given this elevated risk environment, traders should exercise caution and recalibrate risk management strategies to navigate potential price fluctuations effectively.
Additionally, gold pricing remains sensitive to broader macroeconomic developments, including policy decisions under President Trump. Shifts in geopolitical strategy and economic directives could further amplify uncertainty, contributing to market repricing dynamics.
H4 Chart:
M15 Analysis:
-> Swing: Bullish.
-> Internal: Bearish.
I have been mentioning in my alternative scenario for almost 1-month that all higher timeframes are requiring a pullback, and we are seeing a narrowing of internal structure, price could target strong internal low. This is how price printed.
Price has printed a bearish iBOS after a very long duration and subsequently a bullish CHoCH to indicate, but not confirm bullish pullback phase initiation.
The bearish iBOS has also confirmed the swing-high.
Intraday expectation:
Price to continue bullish, react at either premium of 50%, or M15 demand zone, before targeting weak internal low priced at 4,185.910.
Note:
Gold remains highly volatile amid the Federal Reserve's continued dovish stance, persistent and escalating geopolitical uncertainties. Traders should implement robust risk management strategies and remain vigilant, as price swings may become more pronounced in this elevated volatility environment.
Additionally, President Trump’s tariff announcements, particularly against China, are expected to further amplify market turbulence, potentially triggering sharp price fluctuations and whipsaws.
M15 Chart:


Daily Trade Idea: Looking To SELL EURNZD @ 2.039??Today I am looking to short the EURNZD down towards the daily trendline @ 2.025.

CADJPY: Bearish Move From Resistance Confirmed 🇨🇦🇯🇵
There is a high probability that CADJPY will retrace
from the underlined daily resistance.
A breakout of a support line of a rising wedge pattern
on 1H time frame provides a strong bearish signal.
I expect a retracement at least to 107.26
❤️Please, support my work with like, thank you!❤️
I am part of Trade Nation's Influencer program and receive a monthly fee for using their TradingView charts in my analysis.

