$MSTR ..Houston we’ve found a support NASDAQ:MSTR , MSTR went from trading at 400 times bitcoin value to less than 1(slightly) book to value. And it Happened suspicously while hitting the volume profile point of control.
Optionsstrategies

Opening (IRA): UNG April 17th 10C/January 16th -16C... for a 4.08 debit.
Comments: Seasonal natural gas play, buying the deep ITM, high delta long in April and selling the shorter-dated in January.
Metrics:
Buying Power Effect: 4.08 ($408)
Max Profit: 1.92 ($192)
ROC at Max: 47.06%
50% Max: .96
ROC at 50% Max: 23.53%
Will generally look to money/take/run at 50% max or look to roll out the short call to reduce my break even further.

Opening (IRA): SPY January 30th 605/615/730/740 Iron Condor... for a 1.25 credit.
Comments: Structuring the setup such that the credit received is about 1/10th the width of the wings which results in the short option legs being at about their respective 10 delta strikes.
Metrics:
Max Profit: 1.25 ($125)
Max Loss/Buying Power Effect: 8.75 ($875)
ROC at Max: 14.28%
ROC at 50% Max: 7.14%
Will generally look to adjust on side test or on side approaching worthless. Am looking to take profit at .25, resulting in a 1.00 ($100) realized gain.

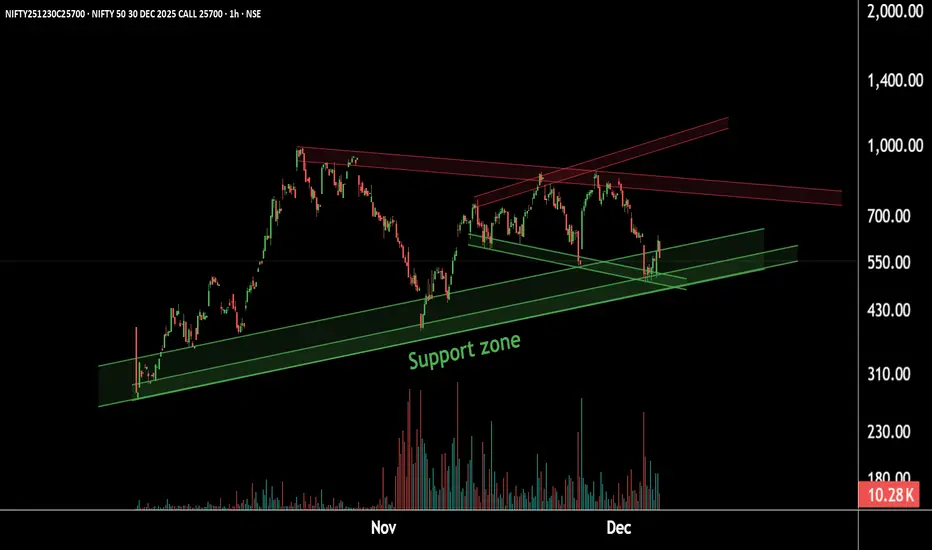
Nifty Option Chart Setting Up for a Big Bull WaveThis is the 1-hour timeframe chart of the NIFTY 25,700 CE.
The option is currently trending near a strong support zone at ₹450–₹500.
The chart indicates that the call is taking support at this level, and any dip into this zone may trigger a bullish reversal.
If this support holds, we may witness an upside move toward the potential resistance area of ₹800–₹850 , short term level 680 and 730 .
Thank you.
Opening (IRA): IBIT December 19th -56P... for a 1.67 credit.
Comments: A starter position at around the 25 delta strike. Will look to add at intervals, assuming I can get in at strikes better than what I currently have on.
Metrics:
Max Profit: 1.67 ($167)
Buying Power Effect: 54.33
ROC at Max: 3.07%

Opening (IRA): SPY March 20th -550P... for a 5.75 credit.
Comments: Adding at intervals, assuming I can get in at prices better than what I current have on. Targeting the strike paying around 1% of the strike price in credit.
I'm going out quite far dated here because I already have rungs on in December 31st (-642P), January (-605P, -625P), and February (-575P, -600P) expiries and didn't want to step on those as it were as I look to manage them via roll.

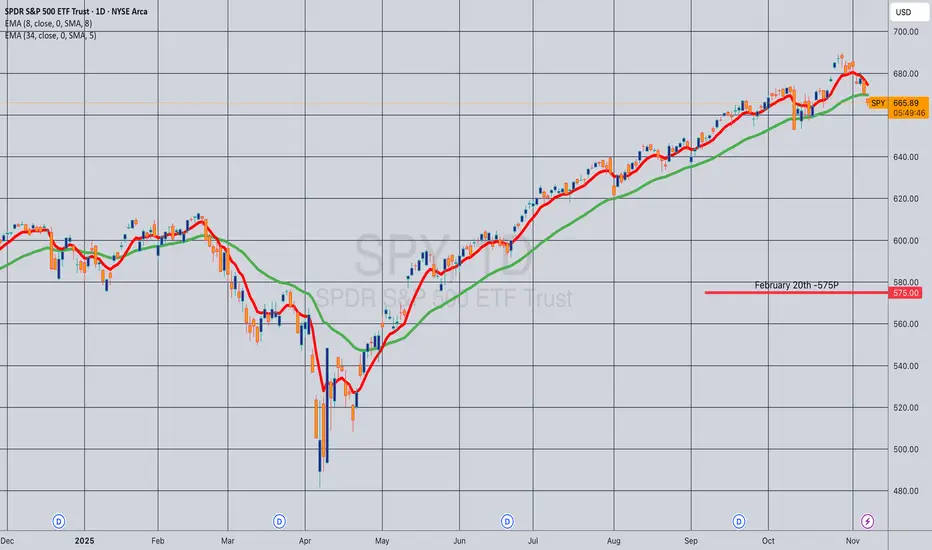
Opening (IRA): SPY February 20th -600P... for a 6.09 credit.
Comments: Laddering out at strikes better than what I currently have on. It would be better if I had weakness, but I've got dry powder for that should it occur.
Targeting the strike paying around 1% of the strike price in credit. Will generally roll to lock in realized gains and/or "window dress" (i.e., roll down and out to a lower strike paying approximately the same amount of credit.

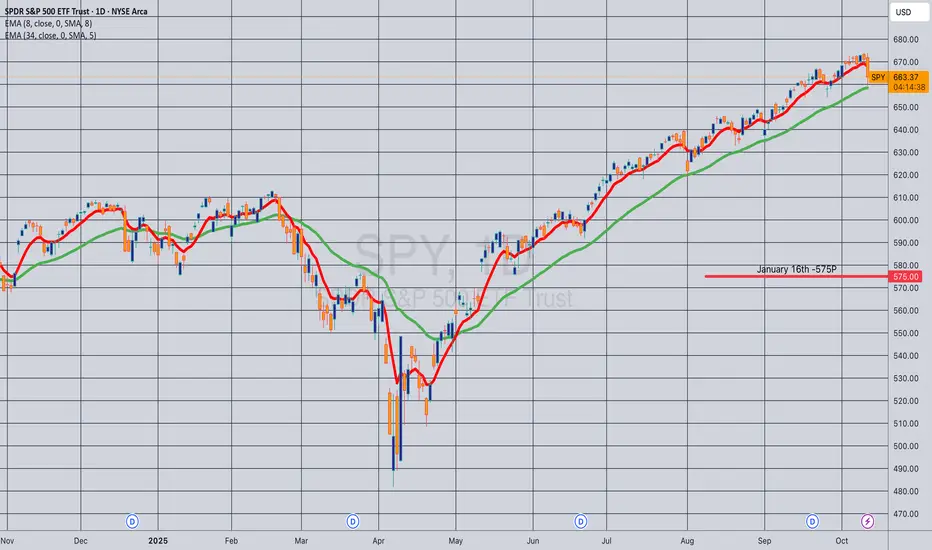
Opening (IRA): SPY January 16th -575P... for a 5.94 credit.
Comments: Laddering out ... . Targeting the strike paying around 1% of the strike price in credit. Will look to add at intervals, assuming I can get in at strikes/break evens better than what I currently have on and/or roll out short put at 50% max.
Opening (IRA): SPY February 20th -575P... for a 5.93 credit.
Comments: Adding at strikes better than what I currently have on, targeting the strike paying around 1% of the strike price in credit.
Opening (IRA): SPY December 19th -605P... for a 6.47 credit.
Comments: On second thought, going to ladder out a bit here on weakness plus higher IV. Targeting the strike paying around 1% of the strike price in credit.
Will look at add at intervals, assuming I can get in at strikes better than what I currently have on and/or roll out at 50% max.

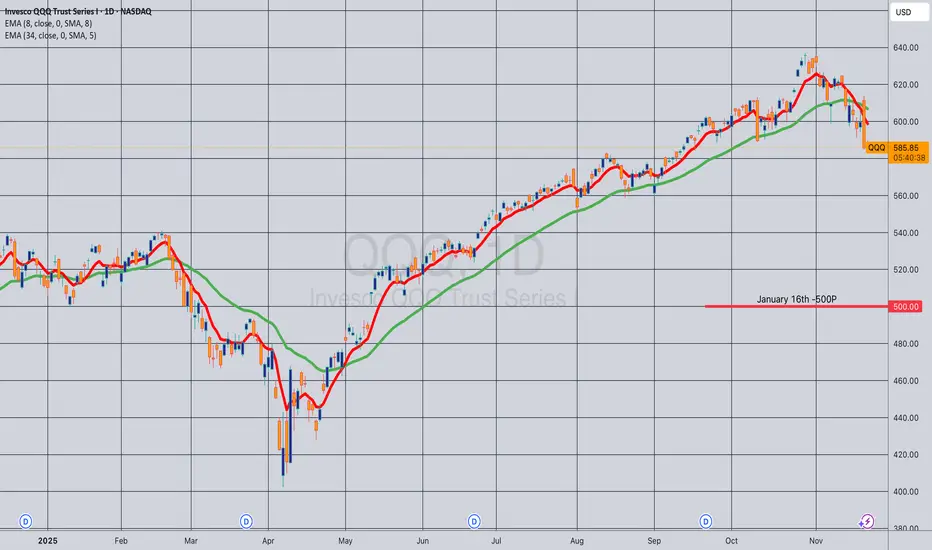
Opening (IRA): QQQ January 16th -500P... for a 5.22 credit.
Comments: My SPY position is becoming somewhat of a spaghetti works, so opting to open a run in the Q's instead, targeting the strike paying around 1% of the strike price in credit.
Will look to add/ladder out at intervals, assuming I can get in at strikes better than what I currently have on.
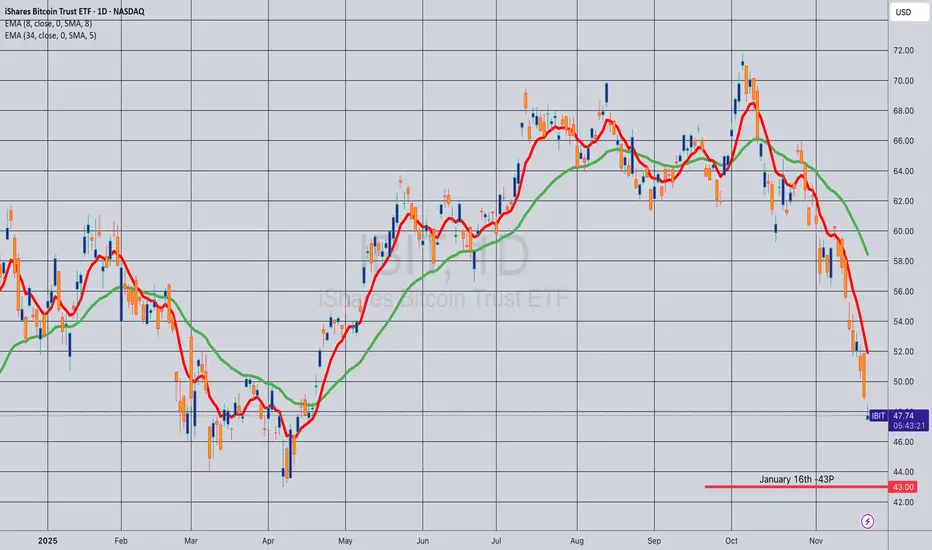
Opening (IRA): IBIT January 16th -43P... for a 2.07 credit.
Comments: Adding at intervals at strikes better than what I currently have on, targeting the 25 delta strike.
Metrics:
Buying Power Effect: 40.93
Max Profit: 2.07 ($207)
ROC at Max: 5.06%
Opening (IRA): ETHA January 16th -18P... for a 1.39 credit.
Comments: Adding at intervals at strikes better than what I currently have on, targeting the 25 delta strike.
Metrics:
Buying Power Effect: 16.61
Max Profit: 1.39 ($139)
ROC at Max: 8.37%

Opening (IRA): ETHA December 19th -23P... for a 1.38 credit.
Comments: High IVR/IV. Adding at strikes better than what I currently have on. Using a 20-ish delta short put here.
Metrics:
Buying Power Effect: 21.62
Max Profit: 1.38 ($138)
ROC at Max: 6.38%
50% Max: .69 ($69)
ROC at 50% Max: 3.19%

Opening (IRA): ETHA December 19th -21P... for a 1.06 credit.
Comments: Adding at intervals at strikes/break evens better than what I currently have on. Here, selling the 25 delta strike.
Max Profit: 1.06 ($106)
Buying Power Effect: 19.94
ROC at Max: 5.32%
Will generally look to start taking profit at 50% max, but am also okay with taking assignment of shares and then proceeding to sell call against.

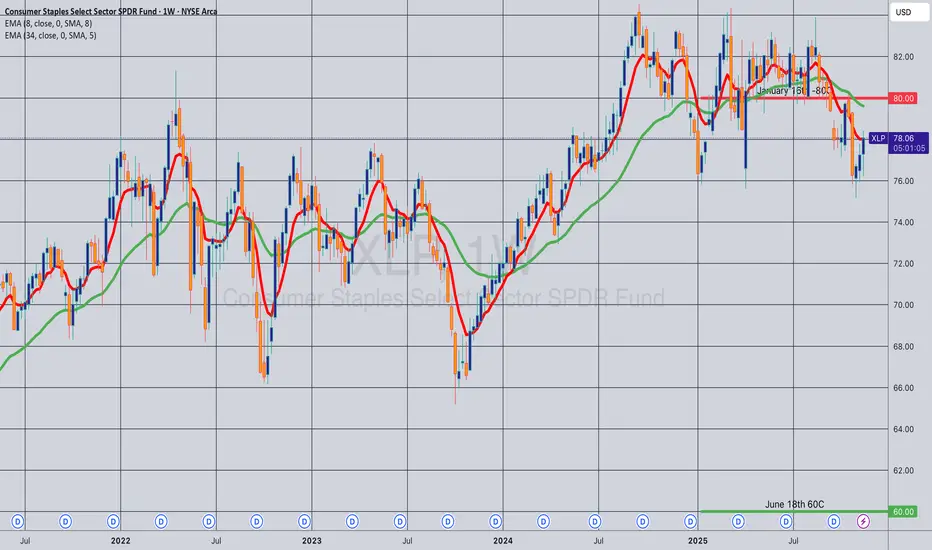
Opening (IRA): XLP June 18th 60C/January -80C LCD*... for a 17.88 debit.
Comments: Re-upping here, buying the June 90 delta call and selling the January call that pays for all of the extrinsic in the long.
Metrics:
Buying Power Effect: 17.88
Max Profit: Short Call Strike (80) minus Long Call Strike (60) minus debit paid (17.88) or 2.12 ($212)
ROC at Max: 11.86%
50% Max: 1.06 ($106)
ROC at 50% Max: 5.93%
Will generally look to take profit at 50% max.
* -- Long Call Diagonal.
Options Trading Idea: Energy Transfer LP 1-3 MonthsThree companies caught our eye last week from insider activity, namely:
Transocean (RIG): Offshore drilling upcycle fueling new high-rate contracts. Insiders bought millions of shares, signalling confidence. Strong oil prices and recent debt reduction amplify upside. Short-term catalysts: additional rig contract wins and positive earnings momentum.
Gran Tierra (GTE): Oversold oil producer with 30% YoY output growth. Upcoming catalyst: management’s debt-cut plan (Dec) – could re-rate equity higher. High risk-reward, as leverage magnifies upside if the plan succeeds.
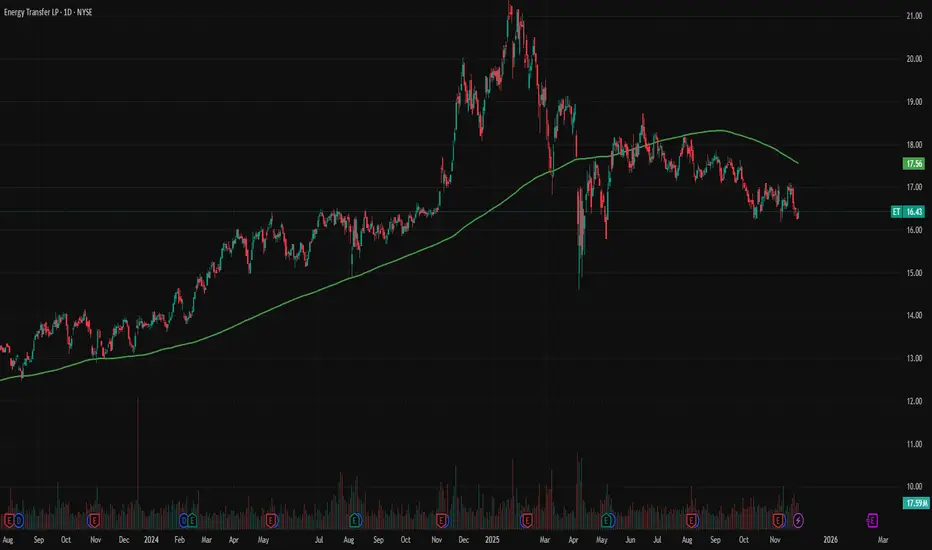
Energy Transfer (ET): A high-yield midstream MLP offering, the insiders are accumulating shares at a cheap valuation. Lower-risk trade with a catalyst of potential distribution growth or project news.
1. What Energy Transfer Actually Does
Energy Transfer LP exemplifies an expansive midstream energy infrastructure, driven by its vast pipeline network and strategic market positioning. It is one of the most extensive midstream energy partnerships in North America, owning and operating more than 130,000 miles of pipelines and associated storage, processing, and export infrastructure across the U.S., moving natural gas, NGLs, crude oil, and refined products from wellhead to end markets.
Broadly, its system is organised into:
NGL & refined products (fractionation, the process where raw liquids are split into higher-value products; storage facilities; export docks)
Crude oil transportation (gathering, which involves collecting oil from different sources; long-haul pipelines for transportation)
Natural gas/midstream (gathering, processing, intrastate and interstate pipelines)
Investments in Sunoco LP & USA Compression (fuel distribution and compression services)
This integrated footprint gives ET exposure to most major U.S. basins, especially the Permian, and to global NGL markets via Gulf Coast export terminals.
2. Earnings Power and Margin Structure
Over the last 12 months, Energy Transfer generated about $79.8 billion in revenue and $4.3 billion in net earnings, implying a net margin of about ~5%. This margin can be attributed to the company’s strategic balance between tariff contracts and commodity exposure. A significant portion of the earnings is stabilised by long-term tariff contracts, which ensure consistent revenue regardless of market fluctuations. On the other hand, spot market deals tied to commodity prices introduce some variability. Gross profit was roughly $16.1 billion against a $63.7 billion cost of revenue. These figures underline the operational leverage and its capacity to manage expenses effectively.
These numbers matter because they frame the debate around ET:
On one hand, scale and diversification support relatively stable cash flows even when commodity prices swing.
On the other hand, it is still a capital-intensive, low-margin business, which means balance-sheet discipline and project selection are crucial for equity holders.
From a growth perspective, analysts expect ~11% annual EPS growth and ~6.4% revenue growth over the next several years, slightly below broader U.S. market earnings growth but ahead of typical pipeline peers on revenue.
3. Balance Sheet: Leverage With Cushion
Midstream investors care as much about leverage as they do about growth. Energy Transfer historically carried a heavy debt load following years of acquisition-driven expansion. Two years ago, the debt-to-EBITDA ratio was around 5.0x. Today, it has improved to approximately 4.3x, showcasing the company’s commitment to reducing leverage and highlighting tangible progress in its financial strategy.
Short-term assets: ~$17.4bn vs short-term liabilities of ~$12.4bn
Long-term assets: ~$111.9bn vs long-term liabilities of ~$69.8bn
This tells us three things:
The asset base is large and tangible – pipelines, plants, and terminals that are hard (and expensive) to replicate.
ET has favourable short-term coverage; current assets comfortably back near-term obligations.
Long-term leverage is meaningful, but assets still exceed liabilities by a wide margin, giving lenders and equity holders a buffer.
Credit-rating agencies and management guidance suggest a target leverage range around 4.0–4.5x debt/EBITDA, with recent trends moving gradually lower as growth capex moderates.
4. Ownership and Insider Alignment
One of the more interesting aspects of Energy Transfer is who owns it.
General public: 64.7%
Institutions: 31%
Individual insiders: 4.27%. That 4.27% is not trivial on a partnership of this size. It reflects substantial holdings by Executive Chairman Kelcy Warren and other insiders, who collectively own more than 140 million units. Warren’s recent purchase of an additional 2 million units in the open market represents a significant personal investment, estimated to be a considerable portion of his personal net worth. This strong alignment of interests with other stakeholders suggests a deep conviction in Energy Transfer's long-term prospects.
Recently, Warren purchased an additional 2 million units in the open market, at a cost of roughly $33 million of personal capital. Historically, Warren’s heavy open-market purchases have often coincided with attractive entry points for long-term investors.
5. Valuation: A Deep Discount on Cash Flows
Where the story becomes compelling is the valuation. The Simply Wall St fair-value gauge shows:
Current price: ~$16.27
Estimated fair value: ~$43.57
Implied 62.7% undervaluation
This fair value is based on a discounted cash flow (DCF) model using consensus forecasts and a cost of equity input. To stress-test these assumptions, consider a scenario in which growth drops by two percentage points or the cost of equity rises by 1%. Even under these more conservative assumptions, the valuation gap remains significant, suggesting ET is at least modestly undervalued.
External sources corroborate this discount:
The units trade at about 8–9x forward distributable cash flow (DCF), translating to an implied earnings yield of approximately 30%. This perspective highlights the potential upside for income-focused investors. In comparison, high-quality utility-like infrastructure often trades at mid-teens multiples, and many midstream peers trade at 10–12x. This gap in peer multiples can be viewed as a margin of safety for investors considering ET.
The distribution yield is ~7–8%, and coverage has been trending toward ~2x on a DCF basis, providing room for modest distribution growth or buybacks.
Relative PE vs Peers
Your PE-comparison chart reinforces the absolute valuation story:
ET: ~13x earnings
Kinder Morgan: ~21.8x
Williams Companies: ~30.6x
Enterprise Products Partners: ~12.3x
MPLX: ~11.3x
Peers on average trade closer to 19x, yet ET sits near the bottom of the range despite comparable or slightly better earnings growth forecasts.
6. Growth Outlook and Capital Allocation
Consensus expects ET’s earnings to grow ~11.2% annually, broadly in line with the midstream industry’s 12.1% but below the broader U.S. market at 16%. Revenue is forecast to grow 6.4% annually, versus the industry’s 3.1%.
In plain language:
Top line grows slightly faster than peers, driven by Permian volumes and NGL exports.
Bottom line growth is slightly slower than the market because ET is more mature and capital-intensive.
Management has signalled a pivot from “growth at all costs” toward balanced capital allocation:
Moderating growth capex, many big projects are either complete or nearing completion.
Using incremental cash to deleverage, targeting lower debt/EBITDA.
Gradually increasing distributions and opportunistically returning capital (e.g., buybacks) when units are undervalued.
7. Translating this into Strategy
Information on the strategies is based on options pricing data from TradingView, assessed on 26 November 2025.
7.1. Best Income Play (High Probability)
SELL CASH-SECURED PUT - Strike: $16 (Dec 26 or Jan 2)
Delta: ~0.24
Premium: ~$0.22–$0.28
Probability of expiring OTM: ~76%
Implied return: 1.3–1.7% for 35–40 days
Annualised return ≈ 14–17%
Why it works
ET is fundamentally undervalued.
Strike is very close to support.
You get paid whether the price goes up or stays flat.
Best market condition
Sideways to slightly bullish.
7.2. Best Directional Trade (High Reward, Low Risk)
BULL CALL SPREAD — Buy $16.5 / Sell $17.5 (Jan 2)
Buy 16.5 call (~$0.34 ask)
Sell 17.5 call (~$0.18 ask)
Net debit ~ $0.16
Payoff
Max profit: $1.00 spread – $0.16 cost = $0.84 (525% return)
Breakeven: $16.66
Max loss: $0.16
Why is this optimal
ET expected to drift into $17–18 zone.
Liquidity is strong at 16.5 and 17.0/17.5 strikes (your images show thick volume).
Small debit, very convex profile.
Excellent theta efficiency.
7.3. Best Intermediate Strategy (Theta + Delta Blend)
DIAGONAL CALL SPREAD — Buy Jan 2 $17 call / Sell Dec 19 $17.5 call
This captures IV skew + slow grind upwards.
Long leg has more time (Jan 2).
Short leg burns faster (theta gain).
You roll the short call forward every week.
Why it’s powerful
ET moves slowly → diagonals exploit drip-up movement.
You earn time decay each week as your long call appreciates.
7.4. High Win-Rate Spread (Good for Small Accounts)
CREDIT PUT SPREAD — Sell $16 / Buy $15.5 (Dec 26)
Collect ~$0.08–0.10 credit
Max loss: $0.40
Win rate: ~74%
Probability of profit: ~70%+
Better risk-adjusted than naked puts for smaller capital.
7.5. Directional “Rerating + Breakout” Strategy
BROKEN-WING BUTTERFLY — 16.5 / 17.5 / 19 (Jan 2)
Cheap entry (~$0.05–0.10)
Max profit if ET closes near $17.50
Higher profit zone extended due to long wing at $19
This captures the slow drift and gives a huge reward if ET spikes.
Note, this is not financial or trading advice; the information represented in this article is for information and research purposes only. All graphic information and options data were sourced from TradingView and Simple Wall Street.
IMPP Imperial Petroleum Options Ahead of EarningsIf you haven`t bought IMPP before the rally:
Now analyzing the options chain and the chart patterns of IMPP Imperial Petroleum prior to the earnings report this week,
I would consider purchasing the 7usd strike price Calls with
an expiration date of 2026-4-17,
for a premium of approximately $0.85.
If these options prove to be profitable prior to the earnings release, I would sell at least half of them.

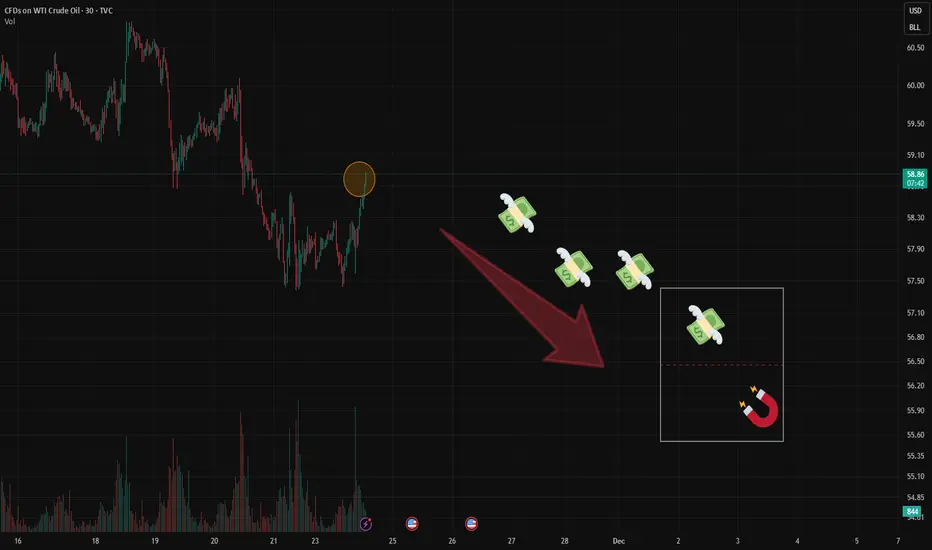
Oil Upd:Price at Resistance–But the Real Story Is in OptionFlowRight now, price has reached the upper boundary of the 1σ Expected Range (ER).
A pause or rejection here is possible.
But that’s not the main story.
Bears are getting active in the options market.
First sign: A significant Put Condor has appeared — large enough to stand out.
Target range: $55–$57
Timeframe: 20 days to expiry
📌 For those still learning:
A Condor profits most when price stays within a tight range at expiry.
Second wave of bearish positioning:
Additional players are placing Put Spreads targeting $54–$55, but with a much shorter horizon — 5–7 days.
This shows a layered approach:
Short and mid- term pressure expected
🧠 Bottom Line:
I’m not jumping into shorts right now — and I wouldn’t advise it blindly.
But given this growing bearish sentiment, it’s smart to start looking for short setups
Sentiment is building.
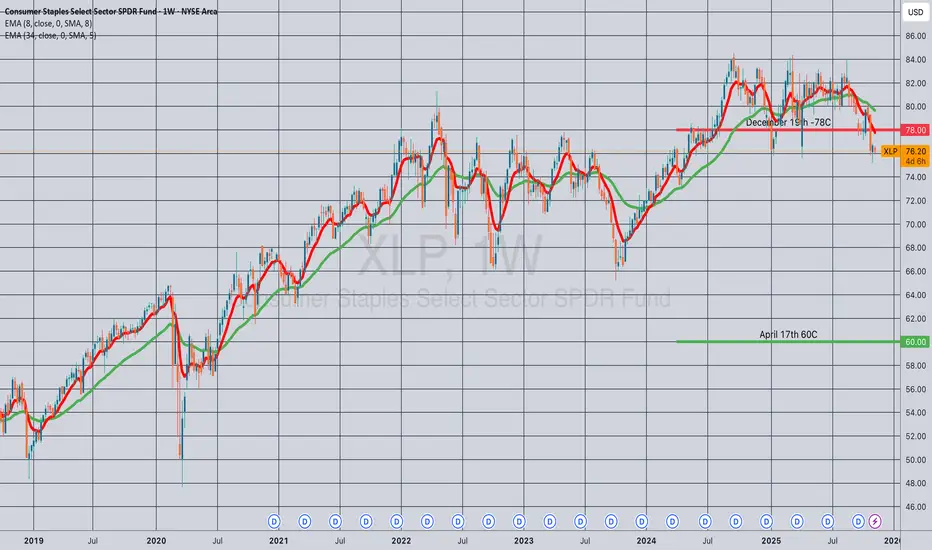
Opening (IRA): XLP April 17th 60C/December 19th -78C LCD*... for a 15.83 debit.
Comments: At or near 52-week lows. Buying the back month 90 delta call and selling the front month out-of-the-money call that pays for all of the extrinsic in the long.
Metrics:
Max Profit: 2.17 ($217)
Buying Power Effect: 15.83
ROC at Max: 13.71%
Break Even: 78.83/share
Will generally look to work the setup like a covered call, rolling the short call to reduce my cost basis in the setup.
* -- Long Call Diagonal.
QuantSignals V3 | HIVE Pre-Earnings Bearish TradeHIVE Earnings Signal | 2025-11-14
Ticker: HIVE
Current Price: $3.38
Trend: Bearish / Oversold
Confidence: 65%
Expiry: 2025-11-21 (7D)
Strike: $3.50
Position Size: 2% of portfolio
📊 AI & Technical Forecast
Katy AI Trajectory: $3.39 → $3.28 (–3.2%)
RSI: 11.1 → extreme oversold
MACD: –0.0617 → negative momentum
ROC: –35% → strong bearish pressure
24h Move: –11.05% → accelerated decline
Insights:
Earnings today → high expected volatility
Recent news: Bitcoin mining expansion & AI data centers, but poor historical earnings performance (0% beat rate, –130.9% surprise)
Options Flow: PCR 1.09 → slight put bias, neutral overall
IV: 148% → high implied volatility, amplifying moves
🎯 Trade Setup
Parameter Value
Direction PUT
Strike $3.50
Entry $0.35
Target 1 $0.60 (+100%)
Target 2 $0.75 (+150%)
Stop Loss $0.15 (–50%)
Expiry 2025-11-21
Position Size 2% portfolio
Confidence 65%
⚡ Key Advantages
Katy AI bearish trajectory + oversold RSI → asymmetric risk/reward
Earnings volatility provides potential for fast downside gains
Strike at $3.50 → moderate delta, intrinsic value cushion
Tight stop loss & small size mitigate earnings risk
Timing Edge:
Pre-earnings close entry captures potential post-announcement downside
Oversold conditions may prevent extreme spikes but favor put buying
🚨 Risk Notes
High beta (4.4x) → amplified moves
Earnings date uncertainty → timing risk
Extreme IV → expensive options; consider scaling entry
Potential for short-term bounce due to oversold RSI
Summary
HIVE presents a medium-conviction earnings put setup, combining Katy AI bearish signals, oversold technicals, and poor earnings history. Ideal for short-term traders targeting downside during earnings volatility.

QuantSignals V3 | BABA Put Signal — Maximize Reversal Potential🧭 Overview
Ticker: BABA
Current Price: $161.93
Trend: Overbought / Mixed
Confidence: 60%
Expiry: 2025-11-21 (7D)
Strike: $157.50
📊 AI & Technical Forecast
Katy AI Target: $159.42 (-1.55%) by week’s end
Extended Series: Downtrend toward $158.58 (-2.07%) by 11/20
RSI: 73.9 → overbought, high reversal potential
EMA / MACD: Diverging momentum, weakening bullish trend
VWAP: $161.40 → mean reversion pressure
Insights:
Price at 94.7% of weekly range → extreme overextension
News catalysts mixed: AI Mode rollout and ChatGPT competitor → initial bullish; hedge fund profit-taking → bearish
Options Flow: PCR 1.92 → institutional bearish positioning, smart money hedging
🎯 Trade Setup
Parameter Value
Direction PUT
Strike $157.50
Entry $1.91
Target 1 $2.87 (+50%)
Target 2 $3.82 (+100%)
Stop Loss $1.34 (–30%)
Position Size 3% of portfolio
⚡ Key Advantages
Contrarian setup: overbought RSI + institutional put-heavy flow
Friday expiration → gamma effects amplify put premium expansion
Tight 30% stop loss limits downside
Delta –0.301 balances probability and payout
Timing Edge:
Weekly expiration compresses timeframe; downside moves accelerate profit potential
Price near top of weekly range → asymmetric risk/reward
🚨 Risk Notes
Low AI confidence (50%) → speculative
Friday expiration → active monitoring required
Break above $164.36 → exit immediately
Positive AI/tech news could override technical forecast

SPY QuantSignals V3 | 0DTE Scalper PlanSPY QuantSignals V3 | 0DTE | 2025-11-12
🎯 Direction: 🟩 BUY CALLS
📊 Confidence: 62% (Low Conviction)
🧭 Bias: NEUTRAL → Slight Bullish Tilt
⚠️ Risk: Moderate (Reduce Size)
💹 TRADE SETUP
Parameter Details
Expiry 2025-11-12 (same-day)
Strike $684.00
Entry $1.80 – $1.82
Target 1 $2.70 (~50% gain)
Stop Loss $1.20
Gamma Risk Low
🧠 QUICK ANALYSIS
Katy AI Forecast:
→ Neutral (50% confidence)
→ Range: -0.20% – +0.15%
→ Slight afternoon uptick → peak ~$685.43 @ 15:33
Tech Check:
SPY @ $684.42 > VWAP ($684.25) → Mild bullish bias
RSI 21.7 → oversold bounce zone
Trend Strength 76.7% → strong regime detected
Range: $682.43 – $685.88 (watch resistance at $685.88)
Flow Intel:
Put/Call Ratio = 1.55 → Bearish skew (contrarian long setup)
Heavy $696 puts → mostly hedging, not conviction selling
News Sentiment:
Mixed:
• Fed comments = neutral
• OpenAI headlines = slightly negative
• Gov. shutdown vote = potential bullish catalyst (PM session)
⚖️ RISK NOTE
High volatility + 0DTE decay → scalp only 🕒
Use small sizing; exit on failed bounce below VWAP.
